Latent Class Analysis Using Stata Chuck Huber Stata

Latent Class Analysis Using Stata Chuck Huber Stata. Corp chuber@stata. com Stata Webinar March 27, 2018
 – Estimation and postestimation options – margins and")
Outline • Latent class analysis (LCA) – Estimation and postestimation options – margins and marginsplot • Latent class analysis with covariates • Latent class analysis by groups • Latent profile analysis

Latent Class Analysis • A latent class model is characterized by having a categorical latent variable and categorical observed variables. • The levels of the categorical latent variable represent groups in the population and are called classes. • We are interested in identifying and understanding these unobserved classes. Class 3 Class 2 Class 1

Latent Class Analysis • Behavioral Research – Classify people who are more likely to exhibit specific behaviors – Different kinds of social phobias – Categories of eating disorders • Medicine and Health – Identify patients with different disease risk profiles • Marketing Research – Differentiate subsets of customers and their buying habits • And many, many more…

Latent and Observed Variables • Latent variables are hypothetical constructs that we cannot measure directly (e. g. “intelligence” or “depression”) • Observed variables are variables that we observe (e. g. “SAT scores” or “Feel sad”)

Latent and Observed Variables Continuous Observed Categorical Observed Continuous Latent Categorical Latent Factor analysis Latent Profile Analysis Latent trait analysis or Item Response Theory Latent Class Analysis Reproduced from Table 1. 1 in Collins and Lanza (2010)

Example Data

Example Data • Class 1 – “Possible rule breaking and norm violations” – May include underage drinking • Class 2 – “More actively delinquent” – Occasional drug use, skipping school, and non-violent crime • Class 3 – “Highly delinquent” – Regular drug use, theft, and violent crime

Example Data Note that we do not have a variable for class membership.

Example Data

Conceptual Path Diagram Class 3 Class 1 Class 2 alcohol truant vandalism theft weapon
 gsem (alcohol truant vandalism theft weapon <- _cons)")
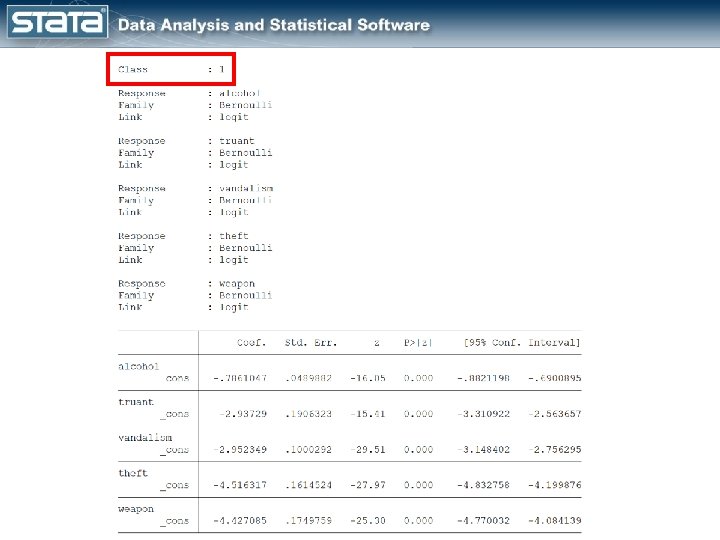
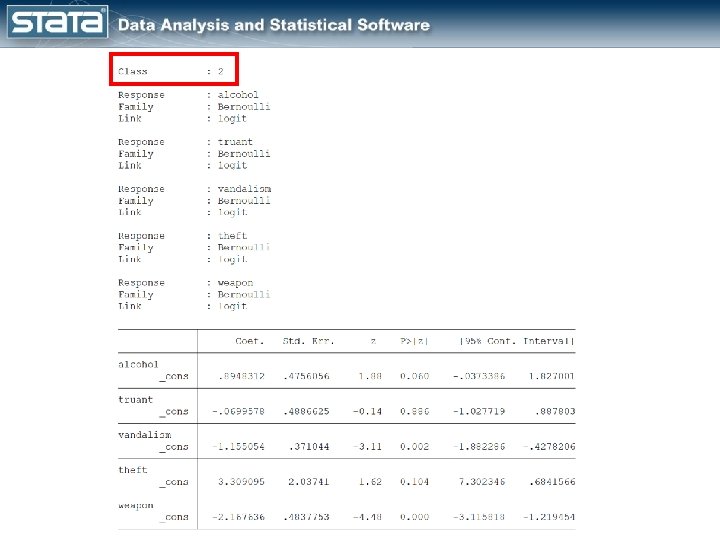
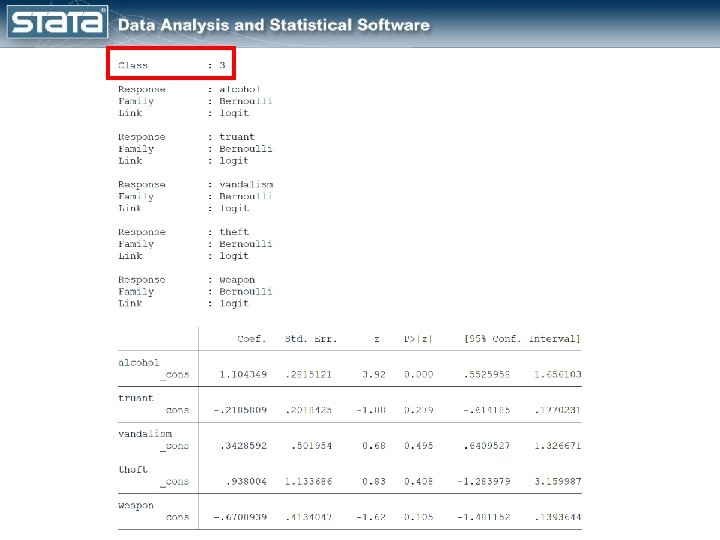
Statistics > LCA (latent class analysis) gsem (alcohol truant vandalism theft weapon <- _cons) , family(bernoulli) link(logit) lclass(C 3) ///

The coefficients for class

LCA Postestimation

LCA Postestimation
 gsem (alcohol")
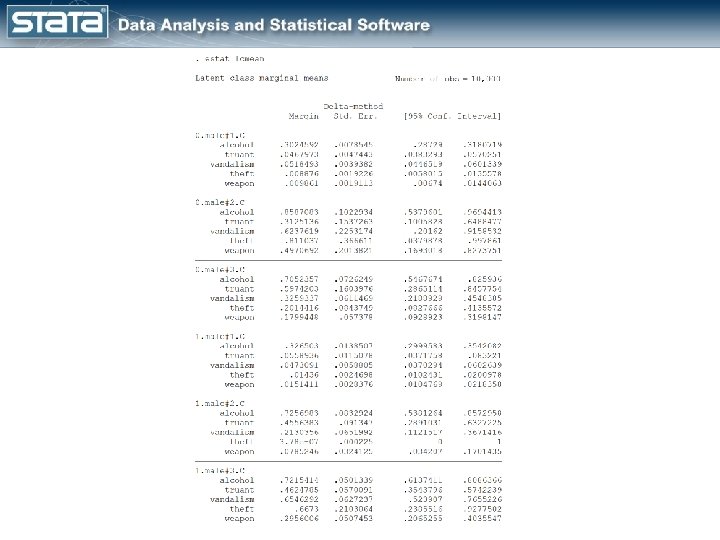
Estimation and Postestimation • First you estimate the parameters (fit the model) gsem (alcohol truant vandalism theft weapon <- _cons) , family(bernoulli) link(logit) lclass(C 3) /// • Then you calculate quantities such as goodnessof-fit statistics, model predictions, residuals, etc estat lcmean estat lcprob

margins and marginsplot • You can use margins to calculate marginal predictions after you fit almost any kind of model in Stata. • You can use marginsplot to graph those marginal predictions.
) predict(classpr class(2)) predict(classpr class(3)) /// marginsplot, xtitle(\"\") ytitle(\"\")")
margins and marginsplot margins, predict(classpr class(1)) predict(classpr class(2)) predict(classpr class(3)) /// marginsplot, xtitle("") ytitle("") xlabel(1 "Class 1" 2 "Class 2" 3 "Class 3") title("Predicted Latent Class Probabilities with 95% CI") ///
) predict(classpr class(2)) predict(classpr class(3)) /// marginsplot, recast(bar) xtitle(\"\")")
margins and marginsplot margins, predict(classpr class(1)) predict(classpr class(2)) predict(classpr class(3)) /// marginsplot, recast(bar) xtitle("") ytitle("") xlabel(1 "Class 1" 2 "Class 2" 3 "Class 3") title("Predicted Latent Class Probabilities with 95% CI") ///
 predict(outcome(truant) predict(outcome(vandalism) predict(outcome(theft) predict(outcome(weapon) class(3)) class(3)) /// /// marginsplot,")
margins and marginsplot margins, predict(outcome(alcohol) predict(outcome(truant) predict(outcome(vandalism) predict(outcome(theft) predict(outcome(weapon) class(3)) class(3)) /// /// marginsplot, recast(bar) xtitle("") ytitle("") xlabel(1 "Alcohol" 2 "Truant" 3 "Vandalism" 4 "Theft" 5 "Weapon") title("Predicted Probability of Behaviors For Class 3 with 95% CI") ///
 class(1)) predict(outcome(alcohol) class(2)) predict(outcome(alcohol) class(3)) /// marginsplot, recast(bar) xtitle(\"\")")
margins and marginsplot margins, predict(outcome(alcohol) class(1)) predict(outcome(alcohol) class(2)) predict(outcome(alcohol) class(3)) /// marginsplot, recast(bar) xtitle("") ytitle("") /// xlabel(1 "Class 1" 2 "Class 2" 3 "Class 3") /// title("Predicted Pr(alcohol=1) with 95% CI")

LCA Postestimation

LCA Postestimation
, logit lclass(C")
How many classes? quietly gsem (alcohol truant vandalism theft weapon <- ), logit lclass(C 1) estimates store oneclass quietly gsem (alcohol truant vandalism theft weapon <- ), logit lclass(C 2) estimates store twoclass quietly gsem (alcohol truant vandalism theft weapon <- ), logit lclass(C 3) estimates store threeclass

Options for Starting Values
 , logit")
Options for Starting Values gsem (alcohol truant vandalism theft weapon <- _cons) , logit lclass(C 3) startvalues(randompr, draws(20) seed(15)) ///
 /// ,")
Options for Starting Values gsem (alcohol truant vandalism theft weapon <- _cons) /// , logit lclass(C 3) /// startvalues(randompr, draws(20) seed(15) difficult)
 ///")
Options for the EM Algorithm gsem (alcohol truant vandalism theft weapon <- _cons) /// , logit lclass(C 3) /// startvalues(randompr, draws(20) seed(15) difficult) /// emopts(iterate(30) difficult)
 – Estimation and postestimation options – margins and")
Outline • Latent class analysis (LCA) – Estimation and postestimation options – margins and marginsplot • Latent class analysis with covariates • Latent class analysis by groups • Latent profile analysis

LCA With Covariates
 (C <- age),")
LCA With Covariates gsem (alcohol truant vandalism theft weapon <- _cons) (C <- age), family(bernoulli) link(logit) lclass(C 3) ///

LCA With Covariates

LCA With Covariates

LCA With Covariates
) predict(classpr class(2)) predict(classpr class(3)) at(age=(13(1)18)) /// /// marginsplot,")
margins and marginsplot margins, predict(classpr class(1)) predict(classpr class(2)) predict(classpr class(3)) at(age=(13(1)18)) /// /// marginsplot, title("Predicted Latent Class Probabilities with 95% CI") legend(order(1 "Class 1" 2 "Class 2" 3 "Class 3") rows(1) position(12) ring(1)) ytitle("") ///
Option gsem (alcohol truant vandalism theft weapon <- _cons) (C")
Initial Values with the from()Option gsem (alcohol truant vandalism theft weapon <- _cons) (C <- age), family(bernoulli) link(logit) lclass(C 3) from(b, skip) ///
Option // Fit a model without age gsem (alcohol truant")
Initial Values with the from()Option // Fit a model without age gsem (alcohol truant vandalism theft weapon <- _cons) , family(bernoulli) link(logit) lclass(C 3) /// // Store the parameter estimates in a matrix named b matrix b = e(b) // Fit a model including age using matrix b for the starting values gsem (alcohol truant vandalism theft weapon <- _cons) /// (C <- age), family(bernoulli) link(logit) /// lclass(C 3) /// from(b, skip)
 – Estimation and postestimation options – margins and")
Outline • Latent class analysis (LCA) – Estimation and postestimation options – margins and marginsplot • Latent class analysis with covariates • Latent class analysis by groups • Latent profile analysis

LCA By Groups
 (C <- age),")
LCA By Groups gsem (alcohol truant vandalism theft weapon <- _cons) (C <- age), family(bernoulli) link(logit) lclass(C 3) group(male) ginvariant(coef) ///

LCA By Groups

LCA By Groups
 – Estimation and postestimation options – margins and")
Outline • Latent class analysis (LCA) – Estimation and postestimation options – margins and marginsplot • Latent class analysis with covariates • Latent class analysis by groups • Latent profile analysis

Latent and Observed Variables Continuous Observed Categorical Observed Continuous Latent Categorical Latent Factor analysis Latent Profile Analysis Latent trait analysis or Item Response Theory Latent Class Analysis Reproduced from Table 1. 1 in Collins and Lanza (2010)

Latent Profile Analysis

Latent Profile Analysis

Latent Profile Analysis
, family(gaussian) link(identity) lclass(C 3) ///")
Latent Profile Analysis gsem (glucose insulin sspg <- _cons), family(gaussian) link(identity) lclass(C 3) ///

Latent Profile Analysis

Latent Profile Analysis
) predict(classpr class(2)) predict(classpr class(3)) /// marginsplot, xtitle(\"\") ytitle(\"\")")
Latent Profile Analysis margins, predict(classpr class(1)) predict(classpr class(2)) predict(classpr class(3)) /// marginsplot, xtitle("") ytitle("") xlabel(1 "Class 1" 2 "Class 2" 3 "Class 3") title("Predicted Latent Class Probabilities with 95% CI") ///
) predict(classpr class(2)) predict(classpr class(3)) /// marginsplot, recast(bar) xtitle(\"\")")
Latent Profile Analysis margins, predict(classpr class(1)) predict(classpr class(2)) predict(classpr class(3)) /// marginsplot, recast(bar) xtitle("") ytitle("") xlabel(1 "Class 1" 2 "Class 2" 3 "Class 3") title("Predicted Latent Class Probabilities with 95% CI") ///
 class(1)) class(2)) class(3)) /// marginsplot, recast(bar) xtitle(\"\") ytitle(\"\") ///")
Latent Profile Analysis margins, predict(outcome(glucose) class(1)) class(2)) class(3)) /// marginsplot, recast(bar) xtitle("") ytitle("") /// xlabel(1 "Class 1" 2 "Class 2" 3 "Class 3") /// title("Predicted Mean Glucose For Each Class 95% CI")
 class(1)) class(2)) class(3)) /// marginsplot, recast(bar) xtitle(\"\") ytitle(\"\") ///")
Latent Profile Analysis margins, predict(outcome(insulin) class(1)) class(2)) class(3)) /// marginsplot, recast(bar) xtitle("") ytitle("") /// xlabel(1 "Class 1" 2 "Class 2" 3 "Class 3") /// title("Predicted Mean Insulin For Each Class 95% CI")
 class(1)) class(2)) class(3)) /// marginsplot, recast(bar) xtitle(\"\") ytitle(\"\") ///")
Latent Profile Analysis margins, predict(outcome(sspg) class(1)) class(2)) class(3)) /// marginsplot, recast(bar) xtitle("") ytitle("") /// xlabel(1 "Class 1" 2 "Class 2" 3 "Class 3") /// title("Predicted Mean SSPG For Each Class 95% CI")
 – Estimation and postestimation options – margins and")
Summary • Latent class analysis (LCA) – Estimation and postestimation options – margins and marginsplot • Latent class analysis with covariates • Latent class analysis by groups • Latent profile analysis

Thanks for Coming! Questions?
- Slides: 61