Last lecture summary Which measures of variability do

Last lecture summary • Which measures of variability do you know? • What are they advantages and disadvantages? • Empirical rule
 vs. sample parameter (population) vs. statistic (sample)")
Statistical jargon population (census) vs. sample parameter (population) vs. statistic (sample)
.")
Statistical inference • A statistic is a value calculated from our observed data (sample). • A parameter is a value that describes the population. • We want to be able to generalize what we observe in our data to our population. In order to this, the sample needs to be representative. • How to select a representative sample? Use randomization.

New stuff
 – each possible sample from the population")
Random sampling • Simple Random Sampling (SRS) – each possible sample from the population is equally likely to be selected. • Stratified Sampling – simple random sample from subgroups of the population • subgroups: gender, age groups, … • Cluster sampling – divide the population into non- overlapping groups (clusters), sample is a randomly chosen cluster • example: population are all students in an area, randomly select schools and create a sample from students of the given school
 • výběr s navrácením • Generates")
Simple random sampling • sampling with replacement (WR) • výběr s navrácením • Generates independent samples • Two sample values are independent if that we get on the first one doesn't affect what we get on the second. • sampling without replacement (WOR) • výběr bez navrácení • Deliberately avoid choosing any member of the population more than once. • This type of sampling is not independent, however it is more common. • The error is small as long as 1. the sample is large 2. the sample size is no more than 10% of population size

Bias • If a sample is not representative, it can introduce bias into our results. • bias – zkreslení, odchylka • A sample is biased if it differs from the population in a systematic way. • The Literary Digest poll, 1936, U. S. presidential election • surveyed 10 mil. people – subscribers • 2. 3 mil. responded predicting (3: 2) a Republican candidate to win • a Democrat candidate won • What went wrong? • only wealthy people were surveyed (selection bias) • survey was voluntary response (nonresponse bias) – angry people or people who want a change

Bessel’s correction www. udacity. com – Statistics

Sample vs. population SD •

Bessel's game

Bessel's game •

Bessel’s game 1. 2. List all possible samples of 2 cards. Calculate sample averages. Population of all cards in a bag Sample average

Bessel’s game 1. 2. 3. 4. List all possible samples of 2 cards. Calculate sample averages. Now, half of you calculate sample variance using /n, and half of you using /(n-1). And then average all sample variances. Population of all cards in a bag Sample average 0, 2 1 0, 4 2 2, 0 1 2, 4 3 4, 0 2 4, 2 3 0, 0 0 2, 2 2 4, 4 4 Sample variance
 Sample variance (n) 0, 2 1 0,")
Bessel’s game Sample average Sample variance (n-1) Sample variance (n) 0, 2 1 0, 4 2 8 4 2, 0 1 2, 4 3 2 1 4, 0 2 8 4 4, 2 3 2 1 0, 0 0 2, 2 2 0 0 4, 4 4 0 0 average
 • standard deviation is not robust • IQR is robust")
Median absolute deviation (MAD) • standard deviation is not robust • IQR is robust • mean absolute deviation MAD – a robust equivalent of the standard deviation • Také your data, find median, calculate absolute deviation from the median, find the median of absolutes deviations
 Data Median deviation 5 10 30 20 30 5 15")
Median absolute deviation (MAD) Data Median deviation 5 10 30 20 30 5 15 10 15 Median: MAD: Absolute deviation

NORMAL DISTRIBUTION

Playing chess • Pretend I am a chess player. • Which of the following tells you most about how good I am: 1. 2. 3. My rating is 1800. 8110 th place among world competitive chess players. Ranked higher than 88% of competitive chess players.

Distribution We should use relative frequencies and convert all absolute frequencies to proportions. Distribution of scores in one particular year

Height data – absolute frequencies http: //wiki. stat. ucla. edu/socr/index. php/SOCR_Data_Dinov_020108_Heights. Weights

Height data – relative frequencies
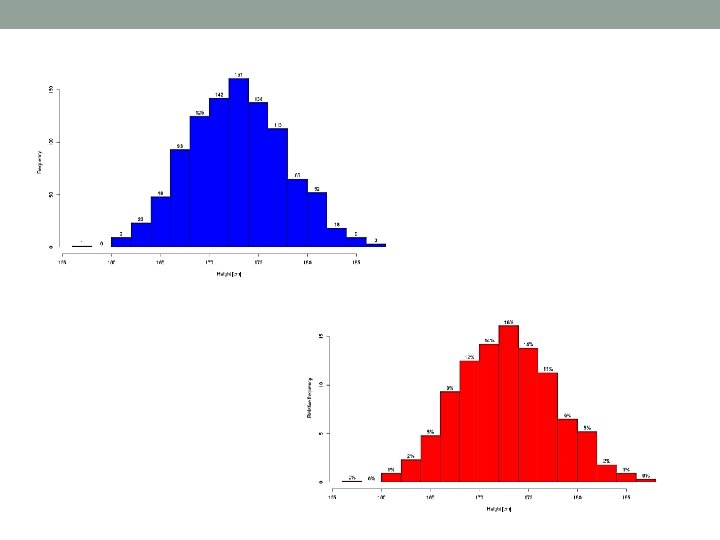

Height data – relative frequencies What proportion of values is between 170 cm and 173. 75 cm? 30%

Height data – relative frequencies What proportion of values is between 170 cm and 175 cm? We can’t tell for certain.

• How should we modify data/histogram to allow us a more detail? 1. 2. 3. Adding more value to the dataset Increasing the bin size A smaller bin size

Height data – relative frequencies What proportion of values is between 170 cm and 175 cm? 36%

Height data – relative frequencies

Height data – relative frequencies

Normal distribution recall the empirical rule 68 -95 -99. 7
- Slides: 29