Lasswell Who Says What In Which Channel To


 presented some evidence concerning the degree to")


 Capturing")


")
")


 age (0 to 8")

 Commonsense Media (Fall 2011)")


, marshalling")

 Viewing by Parent Income, 0 - to 8 -year olds")

- Slides: 70
Lasswell • Who • Says What • In Which Channel • To Whom • With What Effect
“The process by which a complex organization with the aid of one or more machines produces and transmits public messages that are directed at large, heterogeneous, and scattered audiences”
Enriching our Minds Or Melting Our Brains? (And if it’s brain melt, how much have I lost, Doc? ) COMM 203: Communication & Mass Media September 17, 2012 Laurel J. Felt Ph. D Candidate, USC Annenberg www. laurelfelt. org felt@usc. edu
• Why do we engage with media? • So what? • Something’s happening • Let’s measure • Nothing’s happening • What could happen? • Let’s get real
Why do we engage with media?
1. NO IDEA “Bryant and Zillmann (1984) presented some evidence concerning the degree to which people, on their own, can report on the processes that govern viewing decisions. Only 14% of their subjects (college undergraduates) ‘were able to articulate a notion which might be considered an informal, personal theory’ (p. 19)” (Webster & Wakshlag, 1985, p. 52).
Your Ideas!
So what?
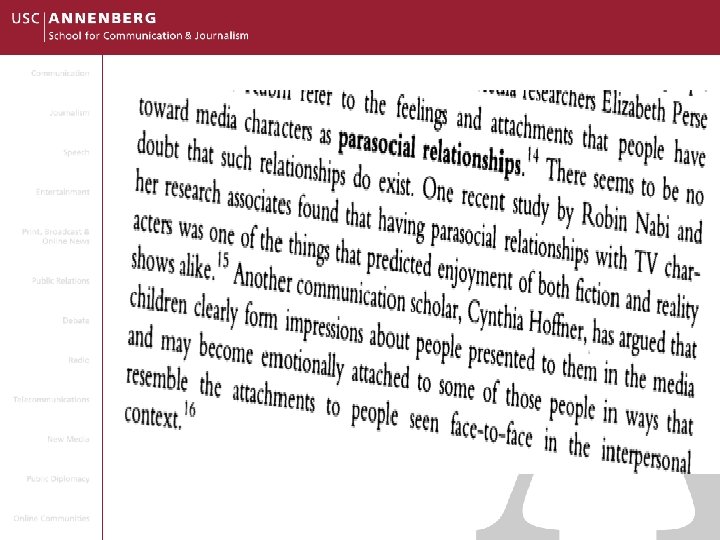
“The relationship between what viewers bring with them to the viewing experience and how viewing subsequently affects them is one of the most important areas of current research in the uses and gratifications tradition” (Sparks, 2012, p. 78).
“This study cannot establish whethere is a cause and effect relationship between media use and grades, or between media use and personal contentment. And if there are such relationships, they could well run in both directions simultaneously” (Rideout, Foehr & Roberts, 2010, p. 4).
“The entire study of mass communication is based on the premise that there are effects from the media, yet it seems to be the issue on which there is least certainty and least agreement” (Mc. Quail, 2005, p. 456).
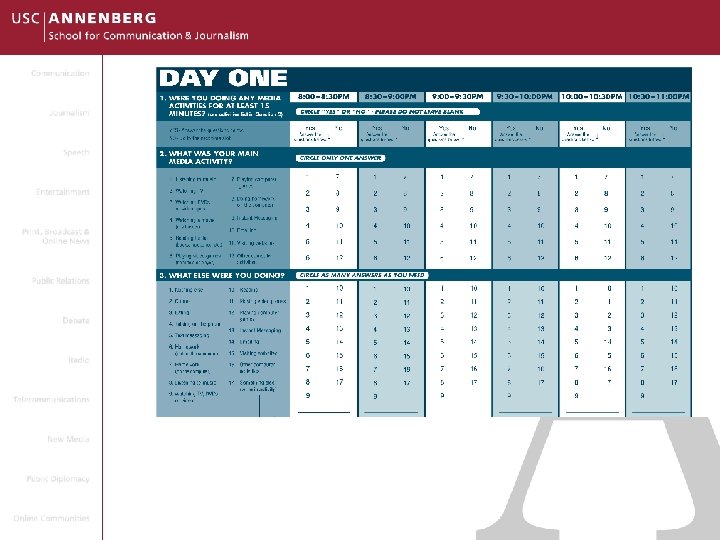
Let’s measure 1. Unobtrusive 2. Behavior as it occurs 3. No particular effort
WHAT What you’re paying attention to in the moment HOW PRO’S CON’S
WHAT What’s playing on the TV HOW PRO’S CON’S
WHAT What you’re paying attention to in the moment + What’s playing on the TV HOW PRO’S CON’S
WHAT What you’re paying attention to in the moment + What’s playing on the TV HOW PRO’S CON’S
WHAT What you’re watching NOW HOW PRO’S CON’S
WHAT What you say you’re watching NOW HOW PRO’S CON’S
WHAT What you say you watch as you’re watching or a little after you’ve watched it HOW PRO’S CON’S
WHAT What you say you watch much after you’ve watched it HOW PRO’S CON’S
KFF, 2010, p. 65 Self Report
KFF, 2010, p. 65 Self Report
Big Four Methods 1. 2. 3. 4. Survey Diary Cameras (lab, in home) Capturing devices
7 hours 38 minutes/day 10 hours 45 minutes/day
Prevalence of TV still ubiquitous! 96. 7% of American households own a set (down from 98. 9%) lowest in 20 yrs (sourse: NY Times, 5/3/2011)
Nielsen Company Household TV Use 2009 2008 2007 1999 1990 1970 8 8 8 7 6 5 hrs. , 21 21 14 26 53 56 mins. Source: The Nielsen Company, NTI Annual Averages, 1994 -present estimates based on start of broadcast season September to September. Beginning in 2007, estimates include Live+7 HUT viewing. Prior to 9/87: Audimeter Sample; 9/87 to present: People Meter Sample. This information was featured in TV_Basics. pdf
Nielsen Company
Prevalence of Media Use Kaiser Family Foundation (2010)
Kaiser Family Foundation (2010)
Nothing’s happening
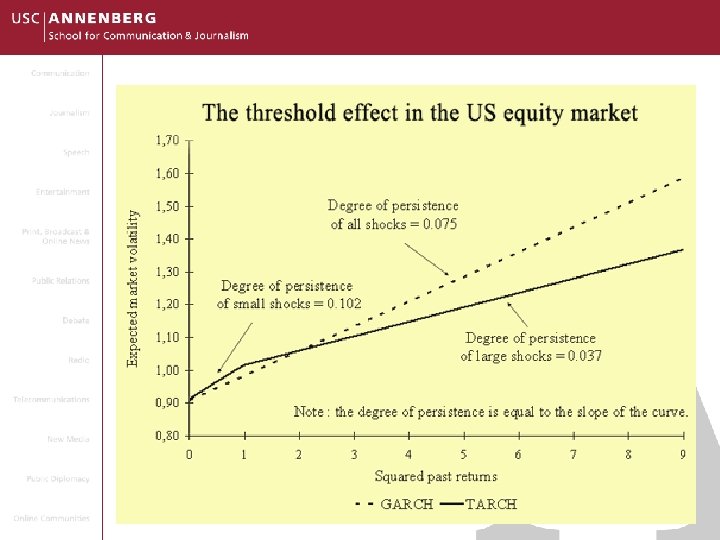
“While tests of statistical significance are a vital tool of the social sciences, they seem to have been more often used in this field as instruments of torture on the data until it confesses something which could justify publication in a scientific journal. If one conclusion is possible, it is that the jury is not still out. It's never been in. Media violence has been subjected to lynch mob mentality with almost any evidence used to prove guilt” (emphasis added; Cumberbatch, 2001, cited in Heins & Bertin, 2002, p. 2).
What could happen?
Let’s get real
At present, we can surely agree that, to those who fear that the media are responsible for a growing range of social problems, one might argue that the evidence base is carefully and critically scrutinized, for such findings as exist generally point to more modest, qualified and context-dependent conclusions. To those who hope, however, that the media play little or no role in today’s social problems, one might point to the complex and diverse ways in which different media are variably but crucially embedded in most or all aspects of our everyday lives, and that it seems implausible to suggest that they have no influence, whether positive or negative. The truth, surely, as always, lies somewhere in the middle. . . Just how we should conceptualise, debate, and research this is the challenge ahead. (Livingstone, 2007, p. 12).
• “In short, it seems wise to frame the question differently, eschewing the bald question – do the media have harmful effects or not, and instead insisting on a more complex formulation of the question, namely—in what way and to what extent do the media contribute, if at all, as one among several identifiable factors that, in combination, account for the social phenomenon under consideration (violence, racism, etc. )” (p. 9). “Just how we should conceptualise, debate, and research this is the challenge ahead” (p. 12).
THANK YOU!
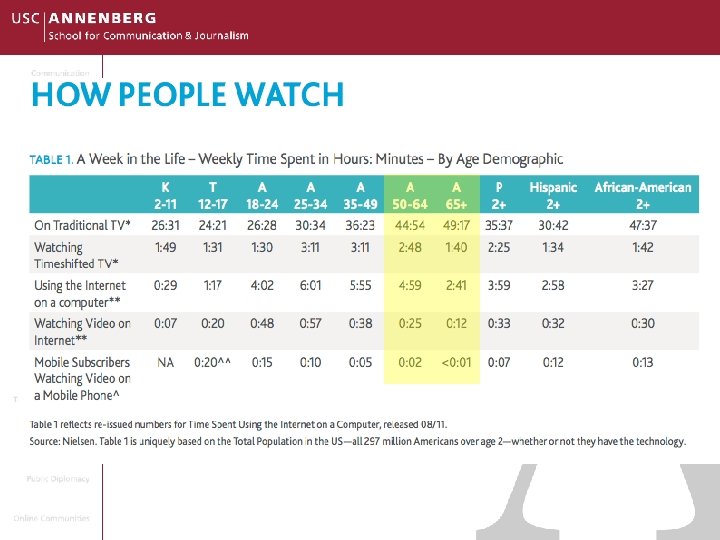
Factors Affecting Media Use age (8 - to 18 -year-olds) age (0 to 8 -year-olds) age (55+ year-olds)
Commonsense Media, Fall 2012 asdfadsf 1, 384 parents of 0 to 8 -year olds were surveyed May-June 2011. Probability based online panel, assumed to be representative of the U. S. population. Margin of error +/2. 6% and the response rate was 59%. (see page 15 of the report).
Media Use (0 -8 year olds) Commonsense Media (Fall 2011)
Senior citizens = “Embracers” of television: - 13% of population - 1. 9 -3. 3% of TV pt characters - 4. 3% of Film characters (2008) (Davis, 1971; Gerbner & Ozyegin, 1997; Vernon et al. 1990; Smith & Choueiti, 2011; US Census, 2011)
Factors Affecting Media Use age gender
8 - to 18 -yr olds Source: Kaiser Family Foundation, 2010
8 - to 18 -yr olds Source: Kaiser Family Foundation, 2010
Ratio Males to Females: 2. 57 2. 71 1. 92 2. 66 1. 67 5. 98 1. 92 3 to to 1 1 G-rated Films (Smith et al. , 2006) 1 G, PG-13, R-rated films (Smith et al. , 2008) 1 G, PG-13, R-rated Jacket Covers (Smith et al. 2008) 1 Oscar Nominated Best Picture (Smith et al. , 2008) 1 Children’s Television Programming (Smith et al. , 2007) 1 Top-Selling Video Games (Downs & Smith, in press) 1 Prosocial Acts on American TV (Smith et al. , 2006) Violent Acts on American TV (Smith et al. , 1998) Form of Content?
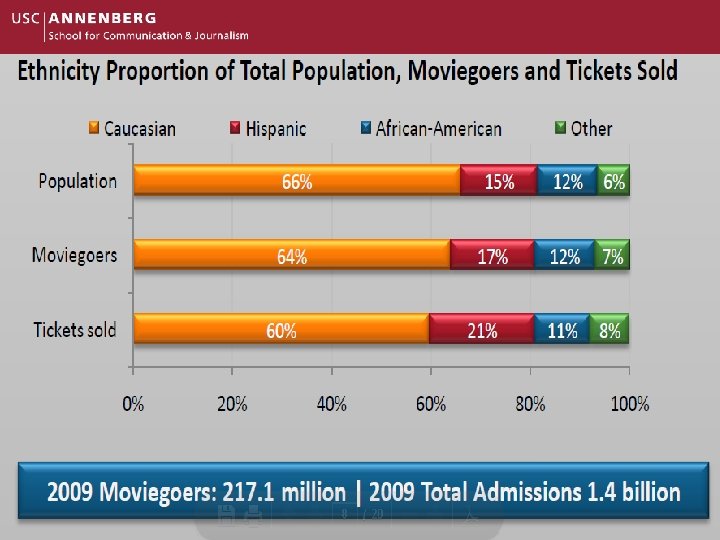
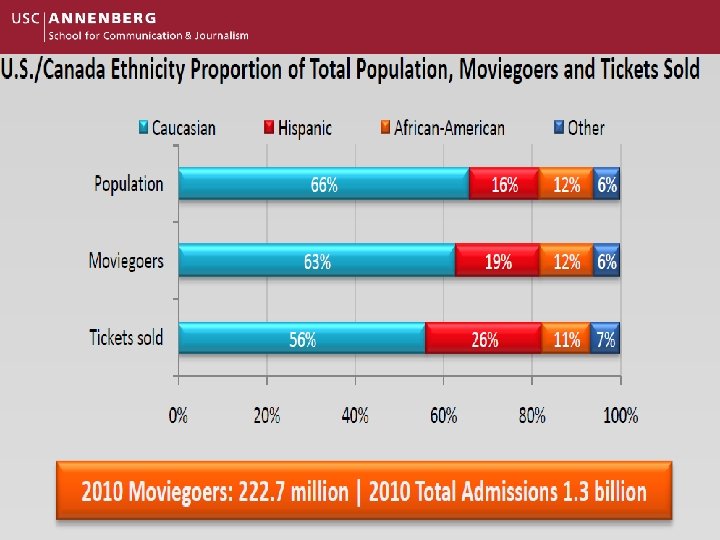
Factors Affecting Media Use age gender race/ethnicity
Kaiser Family Foundation, 2010
Race/Ethnicity – Commonsense Media Note: Commonsense Media, page 25. Ward, L. M (2004), marshalling evidence from other studies argues that “Black children have been reported to hold a more positive orientation toward the media than Whites (Comstock & Cobby, 1979; Graves, 1996; Stroman, 1991). Evidence indicates that African Americans compared with White Americans, hold more favorable attitudes towards TV (Bales, 1986), report higher levels of satisfaction with TV (Albarran & Umphrey, 1993) and are more likely to report using TV for information and as a source of guidance (e. g. Greenberg, 1972). ” Developmental Psychology, 40 (2), p. 285.
Factors Affecting Media Use age gender race/ethnicity socio economic income
Commonsense Media (2011) Viewing by Parent Income, 0 - to 8 -year olds
Reaction Paper #2 – Media Exposure Half a page; 10 points -Select a medium: Television, The Internet, or Radio -Conceptualize exposure to it (what would exposure to _____ look like? ). -Operationalize exposure to it, meaning come up with a way of measuring exposure to the medium (i. e. , quantify exposure). What sort of technology, tools, device, etc. would you use and how? Don’t forget your Name & Student ID#!