LaserInduced Fluorescence LIF Using UltraViolet Optical Screening Tool
 Using Ultra-Violet Optical Screening Tool (UVOST®) Context (Site Introduction) Issue Selection")
 Site in operation")


 • In April 2018, 31")


")


- Slides: 14
Laser-Induced Fluorescence (LIF) Using Ultra-Violet Optical Screening Tool (UVOST®) Context (Site Introduction) Issue Selection Application Analysis and Contrast Conclusion
Site Introduction • Site is an active Underground Storage Tank (UST) Site in operation since 1950 s. An adjacent property is an operating diesel Aboveground Storage Tank (AST) facility. • 2012 -2014, investigations identified light non-aqueous phase liquid (LNAPL) and dissolved phase petroleum hydrocarbons in groundwater monitoring wells on-site. • Site geology consists of silty clay from the surface to 10 -15 feet below ground surface (ft. bgs) and sands from approximately 15 -40 ft. bgs with some clay, silt and gravel. • Initial conceptual site model (CSM) identified evidence of a gasoline release and remediation included a mobile multi-phase extraction system and LNAPL recovery system.
Figure 1. Site Map – Need pre-UVOST plume map if possible
Primary Issue • Investigation using traditional borings and groundwater monitoring wells identified LNAPL at the Site, but after 4 years of LNAPL recovery, elevated benzene concentrations and LNAPL were still present in the monitoring wells on-site. Additional investigation was needed to develop a three dimensional model of of the LNAPL mass beneath the Site. Potential impacts from the adjacent AST facility operations were also unknown. The additional information would be used to design a more robust remediation system to address the LNAPL and dissolvedphase petroleum hydrocarbon plume. • As shown on the Site Map, the known extent of the plume was limited to the on-site monitoring and recovery well data. • Without this information LNAPL recovery could take several more years with an uncertain success.
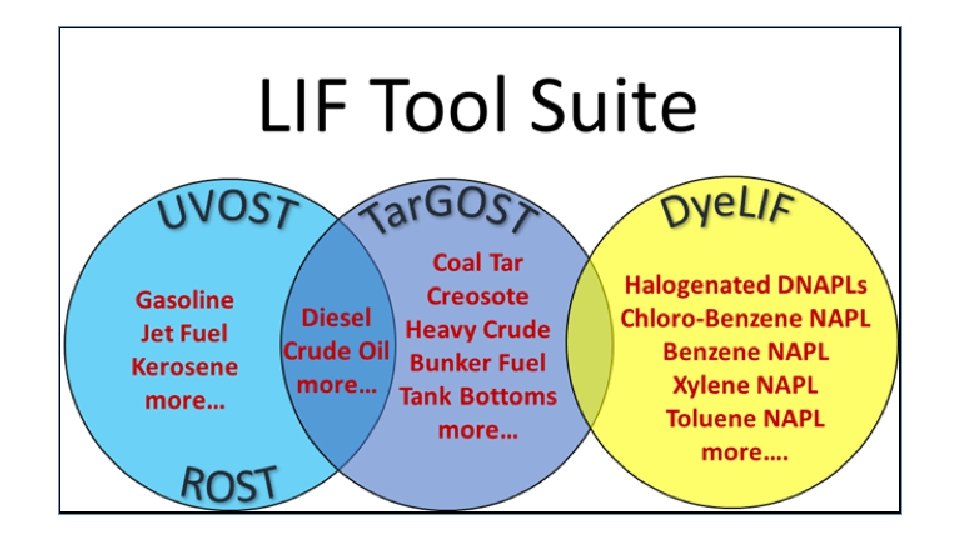
Selection • In order to complete our picture of the site in a timely manner and design a more effective remedy, we selected an LIF technology. In this case, we selected the UVOST® technology to identify LNAPL beneath the Site and the adjacent property. • UVOST® is a commercially available LIF technology used to create high-resolution three-dimensional maps of LNAPL. • UVOST® is deployed using direct-push technology (DPT) drilling rigs and provides real -time measurements of LNAPL distribution. • The output data can be used to develop a three-dimensional data visualization of the LNAPL plume. • In addition to collecting the higher resolution data, utilizing UVOST® will reduce the timeframe for investigation compared to traditional investigation methods that require borings, well installation, and laboratory analyses. • Combining the LIF (UVOST®) data with the existing Site data will support the development of an improved CSM, remedy selection, and remedial design.
Insert tool image
Application of Tool to Site • Set-up (30 seconds) • In April 2018, 31 UVOST® borings were advanced using a DPT drilling rig (Figure 3). • The boring locations were laid out in a grid pattern with an approximate separation of 50 -feet between borings to improve the resolution of the three-dimensional analysis of the UVOST® output results. • Borings were advanced to an average depth of approximately 43 ft. bgs and were completed over a period of 4 days. • A total of 1, 323. 95 ft. of UVOST® logging was completed averaging approximately 331 feet per day. • LNAPL was detected in 28 of the borings at depths ranging from approximately 10 -40 ft. bgs. • The LIF waveforms encountered during the investigation were indicative of intact (unweathered) gasoline, weathered gasoline, and diesel fuel. • Confirmation cores were collected at select LIF locations to validate UVOST® responses. Soil samples were submitted for laboratory analyses using EPA Methods 8015 M and 8270 M. • Dakota technologies conducted an advanced data analysis to create three-dimensional visualization of the UVOST® responses further described in Figures 4 and 5.
Figure 3. UVOST® Boring and Site Monitoring Well Locations
B A C Figure 4. Examples of advanced analysis waveform harvesting and basis set non-negative least squares (NNLS ) results. (A) Waveform harvesting for “Intact Gasoline” basis set. (B) Example of NNLS output, showing fluorescence dominated by intact gasoline. (C) Example of NNLS output, showing fluorescence dominated by diesel.
B A C Figure 5. 3 D Visualizations of NNLS UVOST Basis Set. (A) Intact Gasoline. (B) Weathered Gasoline. (C) Diesel
Analysis and Contrast • The UVOST® data collected refined the soil, groundwater, and LNAPL data previously collected at the Site. • The UVOST® data also provided us with information on the presence of a previously undetected diesel LNAPL plume beneath the Site and adjacent property. • The visualization results indicate that the concentration and vertical distribution of the diesel DNAPL is greatest beneath the adjacent diesel AST property. • In the areas closest to the gasoline USTs and pumps, discontinuous masses of weathered and intact gasoline LNAPL appear in the vadose zone. • The diesel LNAPL beneath the gasoline UST and pump areas appears at greater depth than observed beneath the diesel AST property.
Conclusion • While conventional monitoring wells and soil borings helped us to generally outline the LNAPL contamination, after 4 years of LNAPL recovery at the site, we were still uncertain regarding the three dimensional location of the primary LNAPL mass(es). Without this information we could not refine our CSM to select an alternative remedy. The application of LIF using the UVOST® tool has increased our confidence regarding the location of the LNAPL. This data was collected in 4 days and 1 mobilization. We are now ready to move to remedy selection. • The total cost to conduct the investigation was approximately $30, 500. Data validation sampling and analysis costs were approximately $9, 200. While the short-term cost was significant, the cost to conduct a similar investigation using conventional techniques would likely be higher and lower resolution due to the limitations of conventional investigation methods (e. g. drilling, monitoring wells)
Point to the ASCT Online Resource • If you would like to learn more about LIF, the UVOST ® tool or any of the # other tools, please consult the ITRC website. There you will find all # of the tools videos as well as the ASCT electronic guidance document.