Laser and Laser Amplifier 1 Photon Optics A
")


 Electrons in a semiconductor obey")


 represents the net gain in the photon-flux density per unit length")
 on the frequency of")


, (13. 2 -2) and (13. 2")


 (13.")


 is sapphire (Al 203), in which")


- Slides: 40
Laser and Laser Amplifier (1)
Photon Optics A. Photon Energy Photon optics provides that the energy of an electromagnetic mode is quantized to discrete levels separated by the energy of a photon. The energy of a photon in a mode of frequency v is where h=6. 63 x 10 -34 J-s is Planck's constant and ћ=h/2. Energy may be added to, or taken from, this mode only in units of hv.
Photons and Atoms • Atoms, Molecules, and Solids The behavior of a single nonrelativistic particle of mass m (e. g. , an electron), with a potential energy V(r, t), is governed by a complex wavefunction (r, t) satisfying the Schrodinger equation (12. 1 -1) If we wish simply to determine the allowed energy levels E of the particle in the absence of time-varying interactions, the technique of separation of variables may be used in (12. 1 -1) to obtain (r, t)= (r)exp[j(E/ℏ}t], where (r) satisfies the time independent Schrodinger equation (12. 1 -3)
Energy level • Vibrations of the N 2, CO 2 molecule: A CO 2 molecule may undergo independent vibrations of three kinds: asymmetric stretching (AS), symmetric stretching (SS), and bending (B). Each of these vibrational modes behaves like a harmonic oscillator, with its own spring constant and therefore its own value of ħw. The allowed energy levels are specified by (12. 1 -4) in terms of the three modal quantum numbers (q 1, q 2, q 3) corresponding to the SS, B, and AS modes, as illustrated in Fig. 12. 1 -1.
• Electron Energy Level of Atoms and Molecules Isolated Atoms. An isolated hydrogen atom has a potential energy that derives from the Coulomb law of attraction between the proton and the electron. The solution of the Schrodinger equation leads to an infinite number of discrete levels with energies where mr is the reduced mass of the atom, e is the electron charge, and Z is the number of protons in the nucleus (Z=1 for hydrogen). These levels are shown in Fig. 12. 1 -2 for Z=1 and Z=6. Some of the energy levels of He and Ne atoms are illustrated in Fig. 12. 1 -3.
• Dye Molecules Organic dye molecules are large and complex. They may undergo electronic, vibrational, and rotational transitions so that they typically have many energy levels. Levels exist in both singlet (S) and triplet (T) states. Singlet states have an excited electron whose spin is antiparallel to the spin of the remainder of the dye molecule; triplet states have parallel spins. The energy differences correspond to photons covering broad regions of the optical spectrum, as illustrated schematically in the following figure.
• Electron Energy Levels in Solids For solids, the atoms, ions, or molecules lie in close proximity to each other and cannot therefore be considered as simple collections of isolated atoms; rather, they must be treated as a many-body system. The energy levels of an isolated atom, and three generic solids with different electrical properties are illustrated in Fig. 12. 1 -5. The lower energy levels in the solids are similar to those of the isolated atom. In contrast, the energies of the higher-lying discrete atomic levels split into closely spaced discrete levels and form bands. The highest partially occupied band is called the conduction band; the valence band lies below it. They are separated by an energy Eg called the energy bandgap. The lowest-energy bands are filled first. Conducting solids such as metals have a partially filled conduction band at all temperatures. Insulators, which also have a filled valence band, have a larger energy gap (typically>3 e. V) than do semiconductors, so that fewer electrons can attain sufficient thermal energy to contribute to the conductivity. Typical values of the conductivity for metals, semiconductors, and insulators at room temperature are l 06 (W-cm)-l, 106 to l 03 (W-cm)-1, and l 0 -l 2 (W-cm)-1, espectively.
Ruby Crystal
Semiconductors have closely spaced allowed electron energy levels that take the form of bands as shown in Fig. 12. 1 -7. The bandgap energy Eg, which separates the valence and conduction bands, is 1. 11 e. V for Si and 1. 42 e. V for Ga. As at room temperature. The Ga and As (3 d) core levels, and the Si (2 p) core level are quite narrow, as seen in Fig. 12. 1 -7. The valence band of Si is formed from the 3 s and 3 p levels (as illustrated schematically in Fig. 12. 1 -5), whereas in Ga. As it is formed from the 4 s and 4 p levels.
Quantum Wells Crystal-growth techniques, such as molecular-beam epitaxy and vapor-phase epitaxy, can be used to grow materials with specially designed band structures. In semiconductor quantum-well structures, the energy bandgap is engineered to vary with position in a specified manner, leading to materials with unique electronic and optical properties. An example is the multiquantum-well structure illustrated in Fig. 12. 1 -8. It consists of ultrathin (2 to 15 nm) layers of Ga. As alternating with thin (20 nm) layers of Al. Ga. As. The bandgap of the Ga. As is smaller than that of the Al. Ga. As. For motion perpendicular to the layer, the allowed energy levels for electrons in the conduction band, and for holes in the valence band, are discrete and well separated, like those of the square-well potential in quantum mechanics; the lowest energies are shown schematically in each of the quantum wells. When the Al. Ga. As barrier regions are also made ultrathin, so that electrons in adjacent wells can readily couple to each other via quantum-mechanical tunneling, these discrete energy levels broaden into miniature bands. The material is then called a superlattice structure because these minibands arise from a lattice that is super to (i. e. , greater than) the spacing of the natural atomic lattice structure.
Occupation of Energy Levels in Thermal Equilibrium • Boltzmann Distribution Consider a collection of identical atoms (or molecules) in a medium such as a dilute gas. Each atom is in one of its allowed energy levels E 1, E 2 , • • If the system is in thermal equilibrium at temperature T (i. e. , the atoms are kept in contact with a large heat bath maintained at temperature T and their motion reaches a steady state in which the fluctuations are, on the average, invariant to time), the probability P(Em) that an arbitrary atom is in energy level Em is given by the Boltzmann distribution
• Fermi Dirac Distribution (For Electron in Semiconductor) Electrons in a semiconductor obey a different occupation law. Since the atoms are located in close proximity to each other, the material must be treated as a single system within which the electrons are shared. A very large number of energy levels exist, forming bands. Because of the Pauli exclusion principle, each state can be occupied by at most one electron. The probability that energy level E is occupied is given by the Fermi-Dirac distribution (12 -1 -10) where Ef is a constant known as the Fermi energy. This distribution has a maximum value of unity, which indicates that the energy level E is definitely occupied. f(E) decreases monotonically as E increases, assuming the value 1/2 at E= Ef. Although f(E) is a distribution (sequence) of probabilities rather than a probability density function, when E» Ef it behaves like the Boltzmann distribution
Interactions of photons with atoms • Spontaneous Emission: If the atom is initially in the upper energy level, it may drop spontaneously to the lower energy level and release its energy in the form of a photon in a cavity of volume V, the probability density (per second), or rate, of this spontaneous transition depends on v in a way that characterizes the atomic transition. E2 hn=E 2 -E 1 E1 The function (v) is known as the transition cross section (its dimensions area). (v) is usually determined experimentally rather than calculated. The above equation applies separately to every mode. The term "probability density" signifies that the probability of an emission taking place in an incremental time interval between t and t+ t is simply Psp t. Because it is a probability density, Psp can be greater than 1(s-1), although of course Psp t must always be smaller than 1. Thus, if there a large number N of such atoms, a fraction of approximately N=(Psp t)N atoms will undergo the transition within the time interval t. We can therefore write d. N/dt=-Psp. N, so that the number of atoms N(t)=N(0)exp(-Pspt) decays exponentially with time Fig. 12. 2 -2. constant 1/Psp, as illustrated in Fig. 12. 2 -2.
Absorption: E2 hn E1 The probability density for the absorption of a photon from a given mode of frequency v in a cavity of volume V is governed by the same law that governs spontaneous emission into that mode, (12. 2 -2) However, if there are n photons in the mode, the probability density that the atom absorbs one photon is n times greater (since the events are mutually exclusive), i. e. , (12. 2 -3)
Stimulated Emission: E2 hn hn E1 If the atom is in the upper energy level and the mode contains a photon, the atom may be stimulated to emit another photon into the same mode. The process is known as stimulated emission. It is the inverse of absorption. This photon amplification process is the phenomenon underlying the operation of laser amplifiers and lasers, as will be shown later chapters. The probability density Pst that this process occurs in a cavity of volume V is governed by the same transition cross section, (12. 2 -4)
The lineshape function: Where S is the , is called the transition strength and is satisfied. It is also useful to define the peak transition cross section, which occurs at the resonance frequency, o= (v 0). The function (v) is therefore characterized by its height 0, width v, area S , and profile g(v), as Fig. 12. 2 -5 illustrates.
B. The Spontaneous Emission • Total Spontaneous Emission into All Modes In the above, the probability density Psp for spontaneous emission into a specific mode of frequency v is provided. As matter of fact, the density of modes for a three-dimensional cavity is M(v) = 8 v 2/c 3. This quantity approximates the number of modes (per unit volume of the cavity per unit bandwidth) that have the frequency v. An atom may spontaneously emit one photon of frequency v into any of these modes, so that we have We define a time constant tsp, known as the spontaneous lifetime of the 2→ 1 transition, such that l/tsp=Psp=M(v 0)c. S. Thus Typical values of tsp are = 10 -8 s for atomic transitions (e. g. , the first excited state of atomic hydrogen); however, tsp can vary over a large range (from sub-picoseconds to minutes).
Stimulated Emission and absorption
Stimulated Emission and absorption
Laser amplifier • A coherent optical amplifier: a device that increases the amplitude of an optical field while the phase is unchanged or shifted by a fixed constant. • Incoherent optical amplifier: an amplifier that increases the intensity of an optical wave without preserving the phase
Characteristic parameters for an optical amplifier: • Gain • Bandwidth • Phase shift • Power source • Nonlinearity and gain saturation • Noise
Laser amplifier A monochromatic optical plane wave traveling in the z direction with frequency v , electric field Re{E(z)exp( j 2 vt)}, intensity I(z)=|E(z)|2/2 , and photon flux density (z)=I(z)/hv (photons per second per unit area) will interact with an atomic medium, provided that the atoms of the medium have two relevant energy levels whose energy difference nearly matches the photon energy hv. The numbers of atoms per unit volume in the lower and upper energy levels are N 1 and N 2, respectively. The wave is amplified with a gain coefficient (z) (per unit length) and undergoes a phase shift (z) (per unit length). A. Amplifier Gain The probability density (s 1) that an unexcited atom absorbs a single photon is, (13. 1 -1) where (v)=( 2/8 tsp)g(v) is the transition cross section at the frequency v , g(v) is the normalized lineshape function, tsp is the spontaneous lifetime, and is the wavelength of light in the medium. The probability density for stimulated emission is also given by (13. 1 1).
To demonstrate this process explicitly, consider an incremental cylinder of length dz and unit area as shown in Fig. 13. 1 -1. If (z) and (z)+d (z) are the photon-flux densities entering and exiting the cylinder, respectively, then d (z) must be the photon-flux density emitted from within the cylinder. (13. 1 -2) Where N=N 2 -N 1 is the population density difference. The above equation becomes (13. 1 -3) where (13. 1 -4)
The coefficient (v) represents the net gain in the photon-flux density per unit length of the medium. The solution of (13. 1 -3) is the exponentially increasing function (13. 1 -5) Since the optical intensity I(z)= hv (z), (13. 1 -5) can also be written in terms of I as (13. 1 -6) The amplifier gain coefficient (v) is seen to be proportional to the population difference N = N 2 - N 1. Although N was considered to be positive in the example provided above, the derivation is valid whatever the sign of N. For an interaction region of total length d (see Fig. 13. 1 -1), the overall gain of the laser amplifier G(v) is defined as the ratio of the photon-flux density at the output to the photon-flux density at the input, G(v) = (d)/ (0), so that (13. 1 -7)
B. Amplifier Bandwidth The dependence of the gain coefficient (v) on the frequency of the incident light v is contained in its proportionality to the lineshape function g(v), as given in (13. 1 -4). The latter is a function of width v centered about the atomic resonance frequency v 0=(E 2 - E 1)/ h, where E 2 and E 1 are the atomic energies. The laser amplifier is therefore a resonant device, with a resonance frequency and bandwidth determined by the lineshape function of the atomic transition. For example, if the lineshape function is Lorentzian, it provides (13. 1 -8) The gain coefficient is then also Lorentzian with the same width, i. e. , (13. 1 -9) as illustrated in Fig. 13. 1 -2, where (v 0) = N( 2/4 2 tsp∆v) is the gain coefficient at the central frequency v 0.
C. Amplifier Phase Shift We proceed with an alternative approach, in which the mathematical properties of a causal system are used to determine the phase shift. For homogeneously broadened media, the phase-shift coefficient (v) (phase shift per unit length of the amplifier medium) is related to the gain coefficient (v) by the Kramers Kronig (Hilbert transform) relations, so that knowledge of (v) at all frequencies uniquely determines (v). A simple example is provided by the Lorentzian atomic lineshape function with narrow width ∆v «v 0, for which the gain coefficient (v) is given by (13. 1 -9). The corresponding phase shift coefficient (v) is provided (13. 1 -14) The Lorentzian gain and phase-shift coefficients are plotted in Fig. 13. 1 -3 as functions of frequency. At resonance, the gain coefficient is maximum and the phase-shift coefficient is zero. The phase-shift coefficient is negative for frequencies below resonance and positive for frequencies above resonance. Fig. 13. 1 -3
Amplifier Power Source A. Rate Equations l In the absence of Amplifier Radiation Consider the schematic energy-level diagram. (13. 2 -1) Steady-state populations of levels 1 and 2 can be maintained, however, if energy levels above level 2 are continuously excited and leak downward into level 2, as shown in the more realistic energy level diagram of Fig. 13. 2 -2. Pumping can bring atoms from levels other than 1 and 2 out of level 1 and into level 2, at rates R 1 and R 2 , respectively. We now proceed to write the rate equations for this system both in the absence and in the presence of amplifier radiation.
Under steady-state conditions (d. N 1/dt=d. N 2/dt=0), (13. 2 -2) and (13. 2 -3) can be solved for N 1 and N 2, and the population difference N=N 2 -N 1 can be found. The result is (13. 2 -4) where the symbol N 0 represents the steady-state population difference N in the absence of amplifier radiation. A large gain coefficient clearly requires a large population difference, i. e. , a large positive value of N 0. Equation (13. 2 -4) shows that this may be achieved by: • Large R 1 and R 2. • Long 2 (but tsp which contributes to 2 through 21, must be sufficiently short so as to make the radiative transition rate large, as will be seen subsequently). • Short 1 if R 1 < ( 2/ 21 )R 2. The upper level should be pumped strongly and decay slowly so that it retains its population. The lower level should depump strongly so that it quickly disposes of its population. Ideally, it is desirable to have 21≈ tsp « 20 so that 2 = tsp. and 1 «tsp. Under these conditions we obtain a simplified result: (13. 2 -4 a) In the absence of depumping (R 1=0), or when R 1 « (tsp/ 1)R 2, this result further simplifies to (13. 2 -4 b)
l Rate Equations in the Presence of Amplifier Radiation The presence of radiation near the resonance frequency v 0 enables transitions between levels 1 and 2 to take place by the processes of stimulated emission and absorption as well. These are characterized by the probability density Wi= (v).
where N 0 is the steady-state population difference in the absence of amplifier radiation, given by (13. 2 -4). The characteristic time s is always positive since 2≦ 21. The quantity s plays the role of a saturation time constant, as is evident from Fig. 13. 2 -5.
B. Four and Three Level Pumping Schemes • Four Level Pumping Schemes In the absence of amplifier radiation (Wi= =0), the steady-state population difference is given by (13. 2 -4) with R 1=0, i. e. , (13. 2 -9) In most four-level systems, the nonradiative decay component in the transition between 2 and 1 is typically negligible (tsp « nr) and 20 » tsp » 1 (see Exercise 13. 2 -2), so that (13. 2 -10) (13. 2 -11) (13. 2 -12) Finally, the population difference can be written in the generic form of (13. 2 -7),
but where now N 0 and s are given by (13. 2 -16) (13. 2 -17) rather than by (13. 2 -10) and (13. 2 -11). Under conditions of weak pumping (W « 1/t. SP), N 0≈tsp. Na. W is proportional to W (the pumping transition probability density), and s ≈ tsp giving rise to the results obtained previously. However, as the pumping increases, N 0 saturates and s decreases. Here Na is the total atomic density in the system.
• Three Level Pumping Schemes It is not difficult to see that under rapid 3 -2 decay, the three-level system displayed in Fig. 13. 2 -7 is a special case of the system shown in Fig. 13. 2 -4 (provided that R is independent of N) with the parameters The dependence of the pumping rate R on the population difference N can be included in the analysis of the three-level system by writing R=(N 1 -N 3)W, N 3≈0, and N 1≈1/2(Na-N), from which R≈1/2(Na-N)W. Substituting in the principal equation N=(2 Rtsp-Na)/(1+2 tsp. Wi), and reorganizing terms, we again obtain where
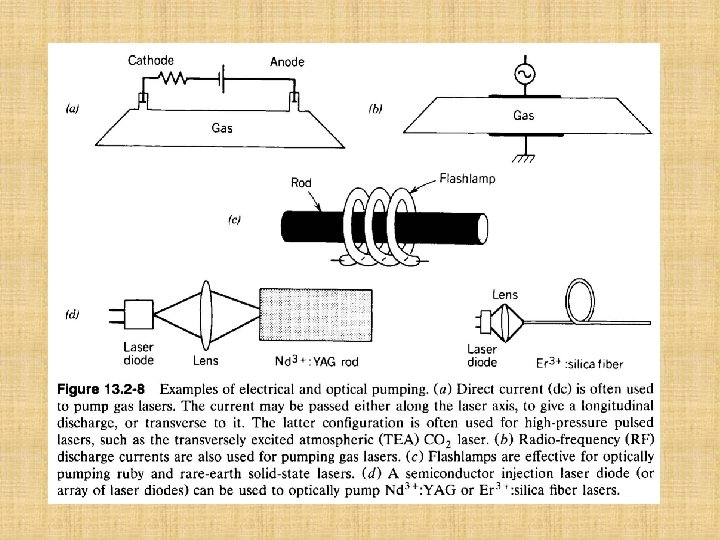
C. Examples of Laser Amplifiers Laser amplification can take place in a great variety of materials. This is illustrated by three solid state laser amplifiers which are discussed in turn below: the three-level ruby laser amplifier, the four-level neodymium-doped yttriumaluminum garnet laser amplifier, and the three-level erbium-doped silica fiber laser amplifier. Although most laser amplifiers and oscillators operate on the basis of a four-level pumping scheme, two notable exceptions are ruby and Er 3+-doped silica fiber. Laser amplification can also be achieved with gas lasers and liquid lasers, as indicated briefly near the end of this section
l Ruby Laser Ruby (Cr 3+: Al 203) is sapphire (Al 203), in which chromium ions (Cr 3+) replace a small percentage of the aluminum ions (see Sec. 12. l. A). As with most materials, laser action can take place on a variety of transitions. The energy levels pertinent to the well-known red ruby laser transition are shown in Fig. 13. 2 -9 (these are labeled in group-theory notation). Ruby is the first material in which laser action was observed. (a) Geometry used in the first laser oscillator built by Maiman in 1960 (see Chap. 14). (b) Cross section of a high -efficiency geometry using a rod-shaped flashlamp and a reflecting elliptical cylinder.
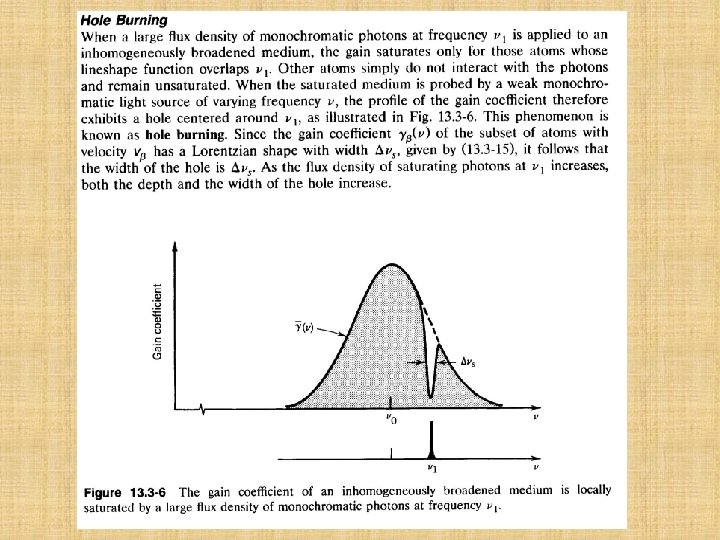
l Nd 3+: YAG and Nd 3+: Glass A useful near-infrared four-level laser amplifier makes use of neodymium in the form of impurity ions in a crystal of yttrium-aluminum garnet (Ndx. Y 3 -x. A 15 O 12, usually written as Nd 3+: YAG). The energy levels pertinent to the 0=1. 064 µm transition are shown in Fig. 13. 211; Level 1 has an energy ≈ 0. 2 e. V above the ground state. Level 3 is a collection of four ≈30 nm-wide absorption bands centered at about 810, 750, 585, and 525 nm. The 2 -1 transition is homogeneously broadened, with a room-temperature linewidth. ∆v ≈120 GHz. The excited ions rapidly decay from level 3 to level 2 ( 32≈ 100 ns), the spontaneous lifetime tsp is 1. 2 ms, and 1 is short (≈ 30 ns). The gain is substantially greater than that of ruby by virtue of it being a four-level system. Nd 3+: YAG can also be optically pumped directly to the upper laser level; The neodymium in glass laser amplifier (Nd 3+: glass) has characteristics that are quite similar to those of Nd 3+: YAG, with the notable exception that it is inhomogeneously broadened; Nd 3+: glass therefore has a far larger room-temperature linewidth, ∆v= 3000 GHz, which turns out to be desirable for mode-locked pulsed lasers.
• Er 3+: Silica Fiber Rare-earth-doped silica fibers can serve as useful laser amplifying media while offering the advantages of single-mode guided-wave optics. Fiber laser amplifiers can be made to operate over a broad range of wavelengths (e. g. , 1. 3 µm, 1. 55 µm, 2 to 3 µm). Er 3+ : silica fibers, in particular, have a broad laser transition ( =4000 GHz) near =1. 55 µm, which coincides with the wavelength of maximum transmission for silica fibers. Because of their high gain, erbium-doped silica fibers offer substantial promise for use as optical amplifiers and repeaters in fiber-optic communication systems. In one configuration, an 980 -nm semiconductor laser pump is used to drive a 1 -m-long Si 02: Ge 02 fiber (typical fiber lengths lie in the range between 0. 5 and 10 m) doped with 500 parts per million (ppm) erbium. This wavelength, is convenient because of the presence of strong pumping bands in Er 3+. The laser transition can instead be directly pumped at 1. 48 µm by light from an In. Ga. As. P semiconductor laser in which case excited-state absorption does not occur. Currently, gains 30 d. B are available by launching 5 m. W of pump power (from a diode laser pump operated at either 980 nm or 1. 48 µm) into a roughly 50 -m length of fiber containing 300 ppm Er 203.
Problems: 1. A commercially available ruby laser amplifier using a 15 -cmlong rod has a small-signal gain of 12. What is the smallsignal gain of a 20 -cm-long rod? Neglect gain saturation effects.