
LARISA SIDOROVA Pushkov Institute of Terrestrial Magnetism Ionosphere
- Slides: 46
Долготная статистика плазменных “пузырей”, видимых на высотах верхней ионосферы в концентрации Не+ LARISA SIDOROVA Pushkov Institute of Terrestrial Magnetism, Ionosphere and Radiowave Propagation (IZMIRAN) 142190 Troitsk Moscow region RUSSIA E-mail: lsid@izmiran. ru
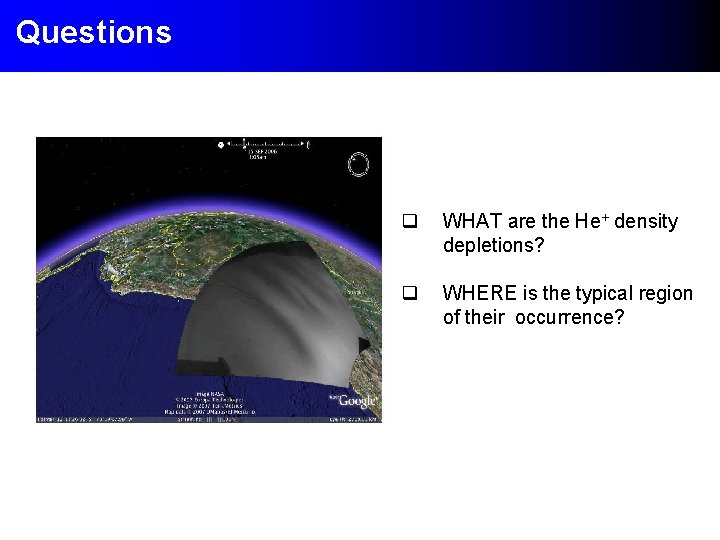
Questions q WHAT are the He+ density depletions? q WHERE is the typical region of their occurrence?
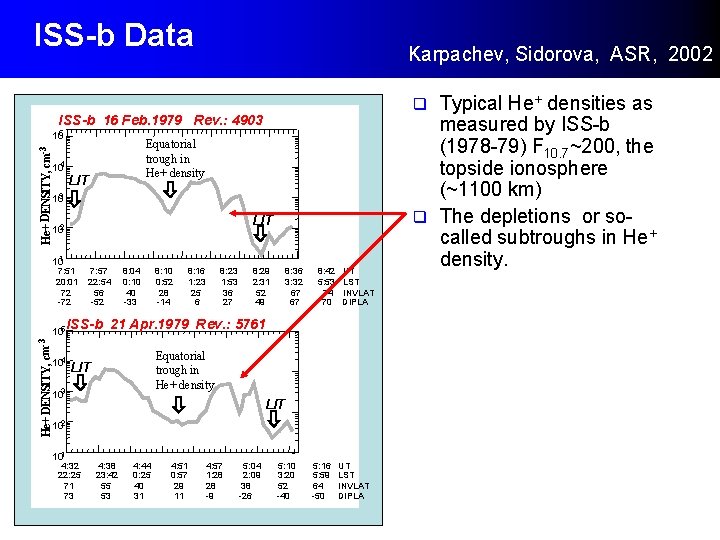
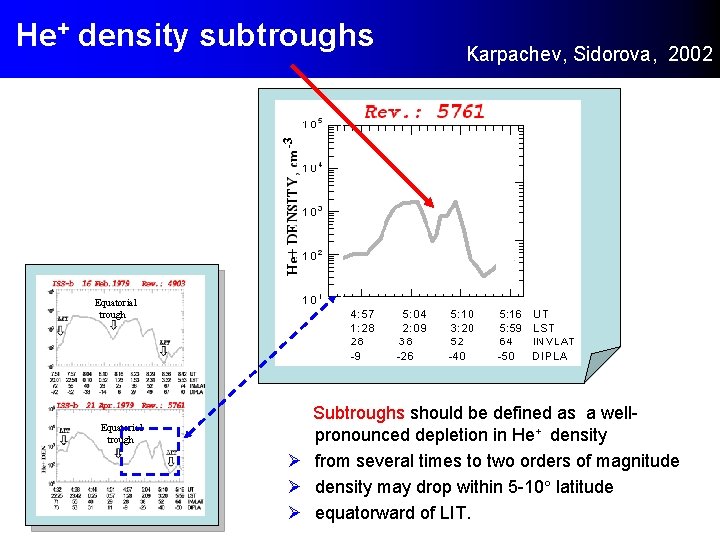
ISS-b Data Karpachev, Sidorova, ASR, 2002 ISS-b 16 Feb. 1979 Rev. : 4903 He+ DENSITY, cm-3 105 Equatorial trough in He+ density 104 LIT 103 LIT 102 101 7: 51 20: 01 72 -72 He+ DENSITY, cm-3 105 104 7: 57 22: 54 56 -52 8: 04 0: 10 40 -33 8: 10 0: 52 28 -14 8: 16 1: 23 25 6 8: 23 1: 53 36 27 8: 29 2: 31 52 49 8: 36 3: 32 67 67 8: 42 5: 53 74 70 UT LST INVLAT DIPLA ISS-b 21 Apr. 1979 Rev. : 5761 Equatorial trough in He+ density LIT 103 LIT 102 101 4: 32 22: 25 71 73 4: 38 23: 42 55 53 4: 44 0: 25 40 31 4: 51 0: 57 29 11 4: 57 1: 28 28 -9 5: 04 2: 09 38 -26 Typical He+ densities as measured by ISS-b (1978 -79) F 10. 7~200, the topside ionosphere (~1100 km) q The depletions or socalled subtroughs in He+ density. q 5: 10 3: 20 52 -40 5: 16 5: 59 64 -50 UT LST INVLAT DIPLA
He+ density subtroughs Karpachev, Sidorova, 2002 Equatorial trough Subtroughs should be defined as a wellpronounced depletion in He+ density Ø from several times to two orders of magnitude Ø density may drop within 5 -10 latitude Ø equatorward of LIT.
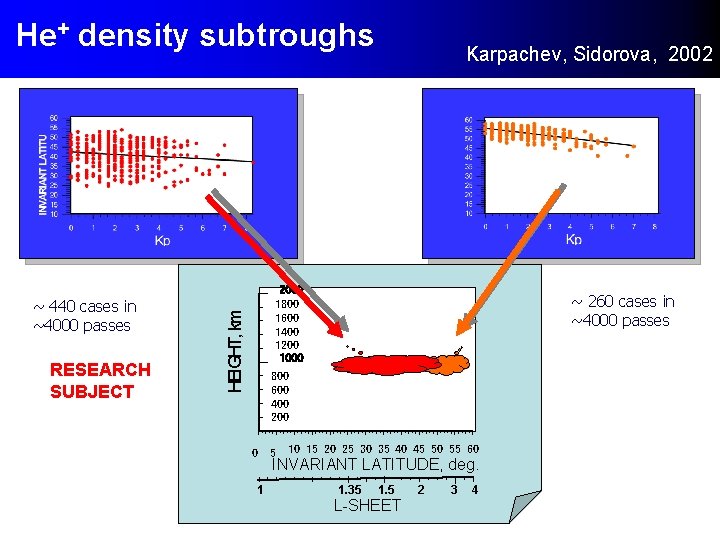
He+ density subtroughs RESEARCH SUBJECT 2000 1800 1600 1400 1200 1000 HEIGHT, km ~ 440 cases in ~4000 passes Karpachev, Sidorova, 2002 ~ 260 cases in ~4000 passes 800 600 400 200 0 5 10 15 20 25 30 35 40 45 50 55 60 INVARIANT LATITUDE, deg. 1 1. 35 1. 5 L-SHEET 2 3 4
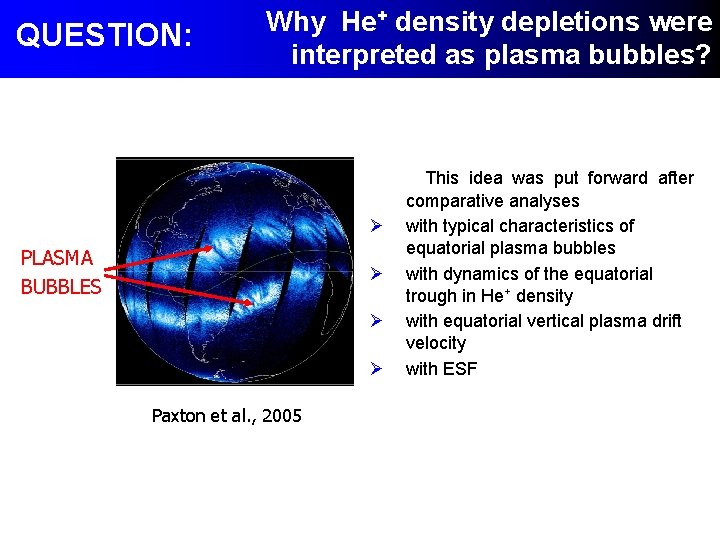
QUESTION: Why He+ density depletions were interpreted as plasma bubbles? Ø PLASMA BUBBLES Ø Ø Ø Paxton et al. , 2005 GUVI Å after This idea was put 1356 forward comparative analyses with typical characteristics of equatorial plasma bubbles with dynamics of the equatorial trough in He+ density with equatorial vertical plasma drift velocity with ESF
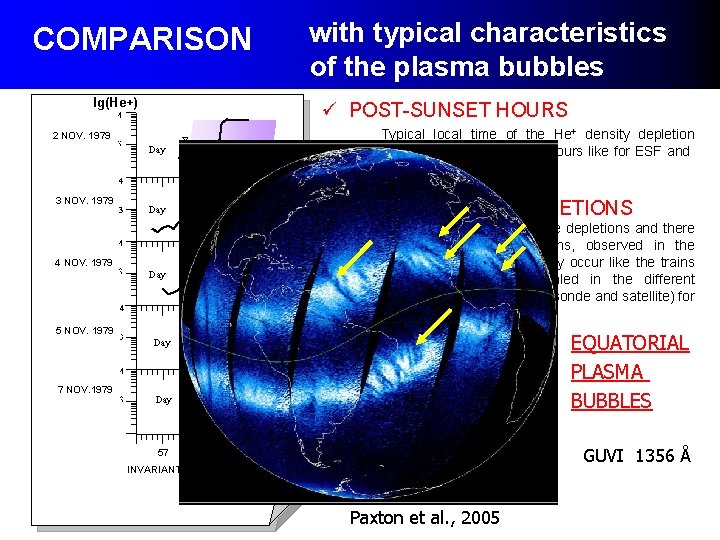
COMPARISON lg(He+) with typical characteristics of the plasma bubbles ü POST-SUNSET HOURS 2 NOV. 1979 Day Night Typical local time of the He+ density depletion occurrence is the post-sunset hours like for ESF and equatorial plasma bubbles. GUVI 1356 Å 4 3 NOV. 1979 3 Day Night 4 NOV. 1979 Day Night 5 NOV. 1979 Day 57 There are the single cases of the depletions and there are the trains of the depletions, observed in the consequent satellite passes. They occur like the trains of the plasma bubbles, revealed in the different observations (optical, radar, ionosonde and satellite) for example GUVI. EQUATORIAL PLASMA BUBBLES Night Day 7 NOV. 1979 ü TRAINS OF THE DEPLETIONS Night 48 40 GUVI 1356 Å 32 INVARIANT LATITUDE, degr. Paxton et al. , 2005
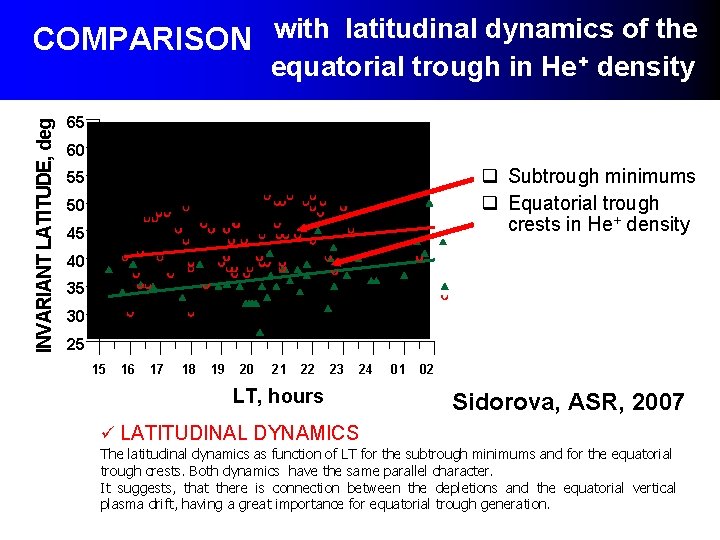
COMPARISON with latitudinal dynamics of the INVARIANT LATITUDE, deg. equatorial trough in He + density 65 Southern Hemisphere September-October 1979 60 q Subtrough minimums q Equatorial trough crests in He+ density 55 50 45 40 35 30 25 15 16 17 18 19 20 21 22 23 LT, hours 24 01 02 Sidorova, ASR, 2007 ü LATITUDINAL DYNAMICS The latitudinal dynamics as function of LT for the subtrough minimums and for the equatorial trough crests. Both dynamics have the same parallel character. It suggests, that there is connection between the depletions and the equatorial vertical plasma drift, having a great importance for equatorial trough generation.
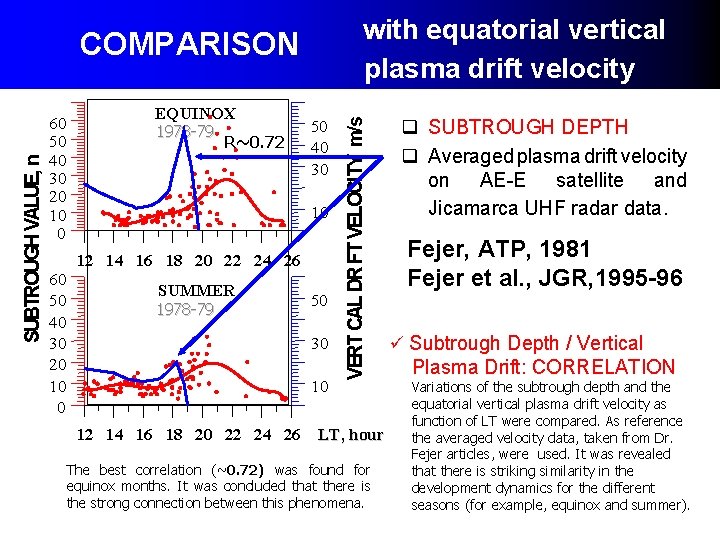
SUBTROUGH VALUE, n COMPARISON 70 60 50 40 30 20 10 0 EQUINOX 1978 -79 R~0. 72 60 50 40 30 20 10 0 12 14 16 18 20 22 24 26 60 50 40 30 20 10 0 SUMMER 1978 -79 60 50 40 30 20 10 0 VERTICAL DRIFT VELOCITY, m/s with equatorial vertical plasma drift velocity 12 14 16 18 20 22 24 26 LT, hour The best correlation (~0. 72) was found for equinox months. It was concluded that there is the strong connection between this phenomena. q SUBTROUGH DEPTH q Averaged plasma drift velocity on AE-E satellite and Jicamarca UHF radar data. Fejer, ATP, 1981 Fejer et al. , JGR, 1995 -96 ü Subtrough Depth / Vertical Plasma Drift: CORRELATION Variations of the subtrough depth and the equatorial vertical plasma drift velocity as function of LT were compared. As reference the averaged velocity data, taken from Dr. Fejer articles, were used. It was revealed that there is striking similarity in the development dynamics for the different seasons (for example, equinox and summer).
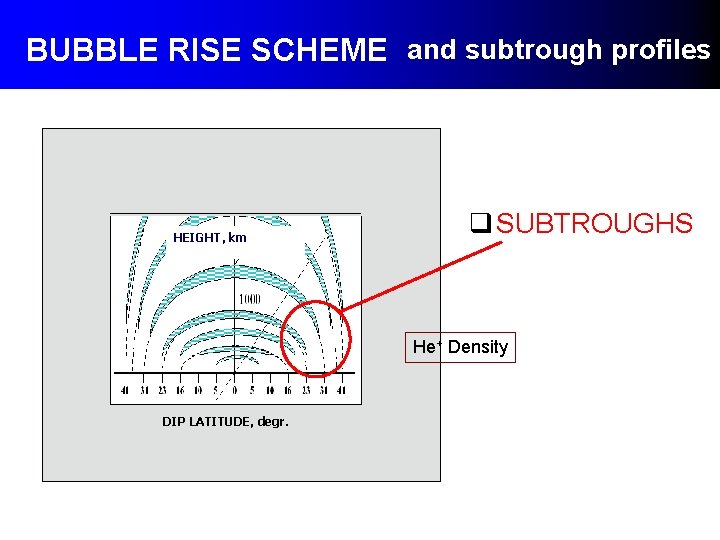
BUBBLE RISE SCHEME and subtrough profiles Equator Topside ionosphere HEIGHT, km q SUBTROUGHS Не+ Density DIP LATITUDE, degr.
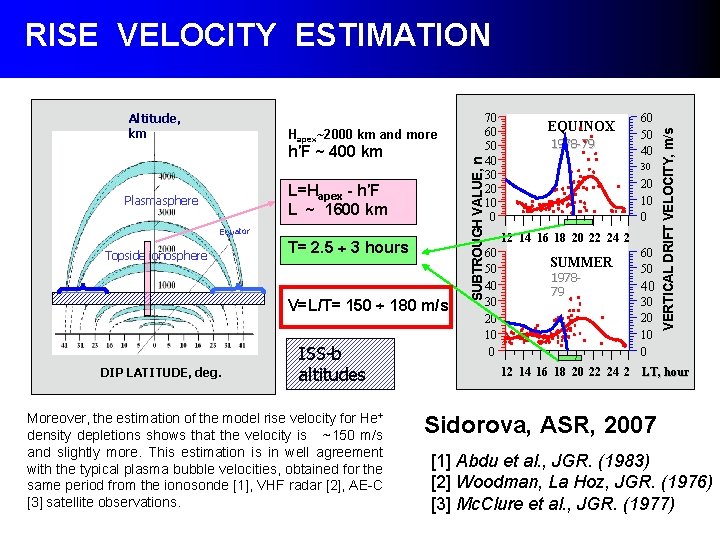
Altitude, km h′F ~ 400 km L=Hapex - h′F L ~ 1600 km Plasmasphere Equator Topside ionosphere T= 2. 5 3 hours V=L/T= 150 180 m/s DIP LATITUDE, deg. ISS-b altitudes Moreover, the estimation of the model rise velocity for He+ density depletions shows that the velocity is ~150 m/s and slightly more. This estimation is in well agreement with the typical plasma bubble velocities, obtained for the same period from the ionosonde [1], VHF radar [2], AE-C [3] satellite observations. SUBTROUGH VALUE, n Hapex~2000 km and more 70 60 50 40 30 20 10 0 EQUINOX 1978 -79 60 50 40 30 20 10 0 12 14 16 18 20 22 24 2 60 50 40 30 20 10 0 SUMMER 197879 12 14 16 18 20 22 24 2 60 50 40 30 20 10 0 VERTICAL DRIFT VELOCITY, m/s RISE VELOCITY ESTIMATION LT, hour Sidorova, ASR, 2007 [1] Abdu et al. , JGR. (1983) [2] Woodman, La Hoz, JGR. (1976) [3] Mc. Clure et al. , JGR. (1977)
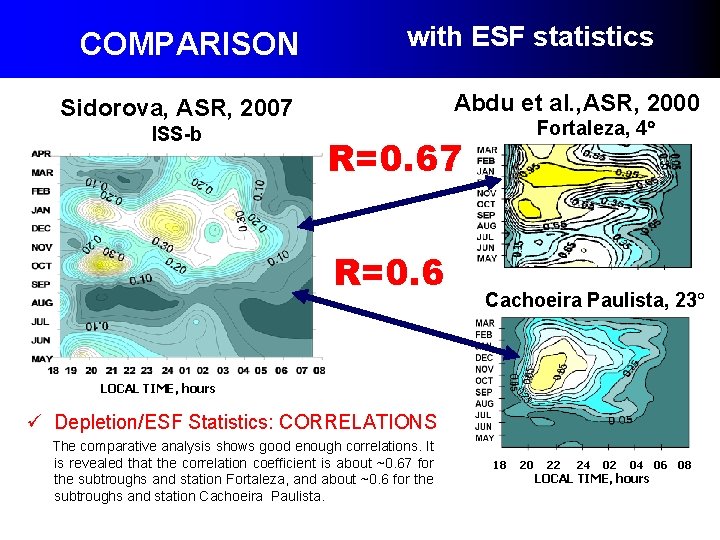
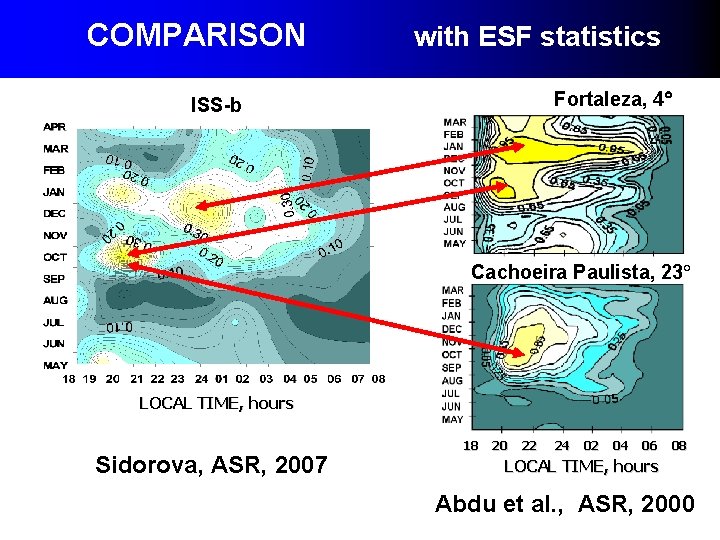
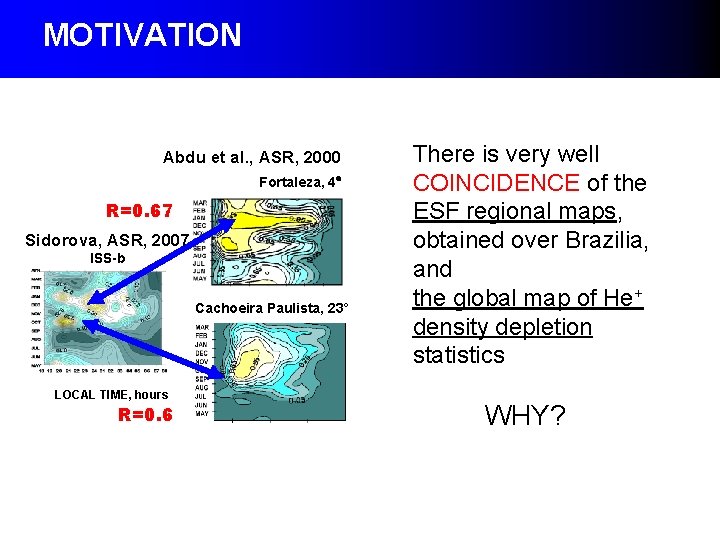
COMPARISON with ESF statistics Abdu et al. , ASR, 2000 Sidorova, ASR, 2007 ISS-b Fortaleza, 4 R=0. 67 R=0. 6 Cachoeira Paulista, 23 LOCAL TIME, hours ü Depletion/ESF Statistics: CORRELATIONS The comparative analysis shows good enough correlations. It is revealed that the correlation coefficient is about ~0. 67 for the subtroughs and station Fortaleza, and about ~0. 6 for the subtroughs and station Cachoeira Paulista. 18 20 22 24 02 04 06 08 LOCAL TIME, hours
COMPARISON with ESF statistics Fortaleza, 4 ISS-b Cachoeira Paulista, 23 LOCAL TIME, hours Sidorova, ASR, 2007 18 20 22 24 02 04 06 08 LOCAL TIME, hours Abdu et al. , ASR, 2000
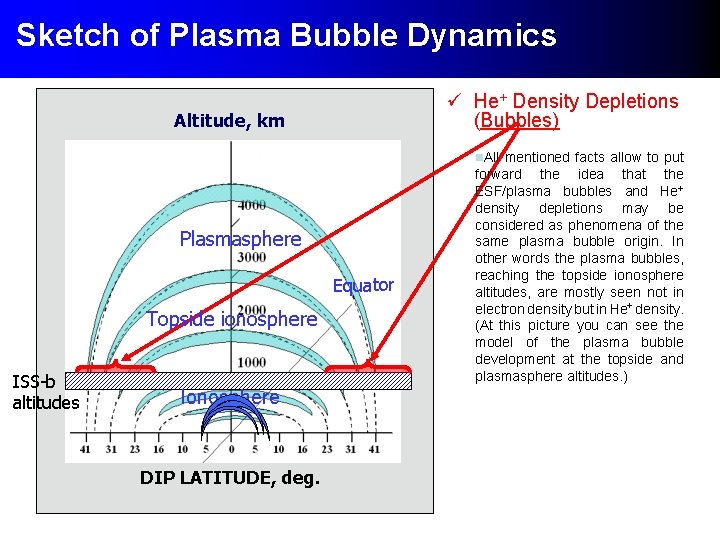
Sketch of Plasma Bubble Dynamics ü He+ Density Depletions (Bubbles) Altitude, km n. All mentioned facts allow to put Plasmasphere Equator Topside ionosphere ISS-b altitudes Ionosphere DIP LATITUDE, deg. forward the idea that the ESF/plasma bubbles and He+ density depletions may be considered as phenomena of the same plasma bubble origin. In other words the plasma bubbles, reaching the topside ionosphere altitudes, are mostly seen not in electron density but in He+ density. (At this picture you can see the model of the plasma bubble development at the topside and plasmasphere altitudes. )
PUBLICATIONS Article: Distinction and classification of the troughs and subtroughs in He+ density from ISS-b satellite data at 1000 -1200 km altitudes, A. Karpachev, L. Sidorova, J. Atm. Solar-Terr. Phys. , 65, 997 -1006, 2003. Article: He+ density topside modeling based on ISS-b satellite data, Sidorova, Advances in Space Research, 33, 850 -854, 2004. L. Article: Plasma bubble phenomenon in the topside ionosphere L. Sidorova, Advances in Space Research, 39 (2007), 1284 -1291, DOI: 10. 1016/j. asr. 2007. 03. 067 Article: Equatorial Plasma Bubbles at Altitudes of the Topside Ionosphere, L. Sidorova, Geomagnetism and Aeronomy, 49 (1), 56 -65, 2008. Book: Topside plasma bubbles, seen as He+ density depletions L. Sidorova, International Conference, Fundamental Space Research, Conference Proceedings, Sunny Beach, Bulgaria, 21 -28 Sept. , (2008), p. 238 -241
MOTIVATION Abdu et al. , ASR, 2000 Fortaleza, 4 R=0. 67 Sidorova, ASR, 2007 ISS-b Cachoeira Paulista, 23 LOCAL TIME, hours R=0. 6 There is very well COINCIDENCE of the ESF regional maps, obtained over Brazilia, and the global map of He+ density depletion statistics WHY?
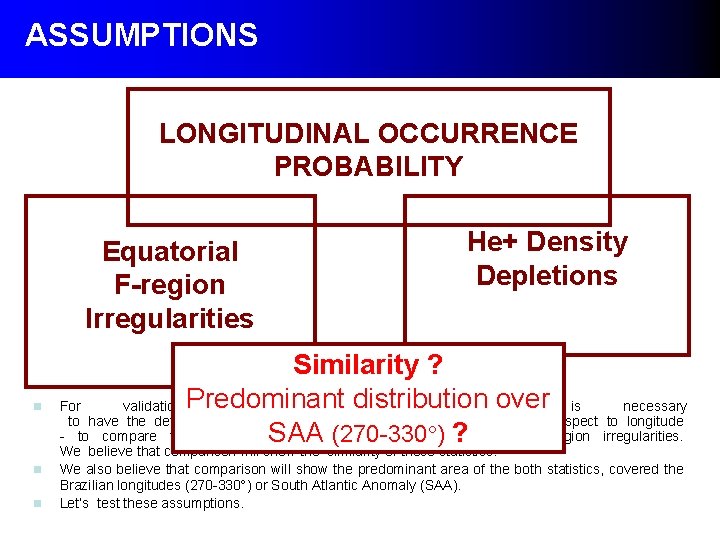
ASSUMPTIONS LONGITUDINAL OCCURRENCE PROBABILITY Equatorial F-region Irregularities n He+ Density Depletions Similarity ? distribution For validation Predominant of the obtained results over it is necessary to have the detailed He density depletion occurrence probability with respect to longitude - to compare them with same statistics of the equatorial F-region irregularities. SAA (270 -330 ) ? + n n We believe that comparison will show the similarity of these statistics. We also believe that comparison will show the predominant area of the both statistics, covered the Brazilian longitudes (270 -330 ) or South Atlantic Anomaly (SAA). Let’s test these assumptions.
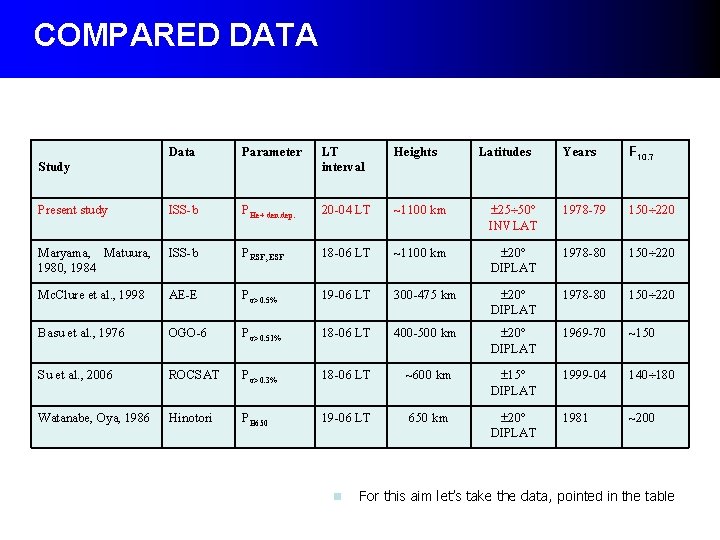
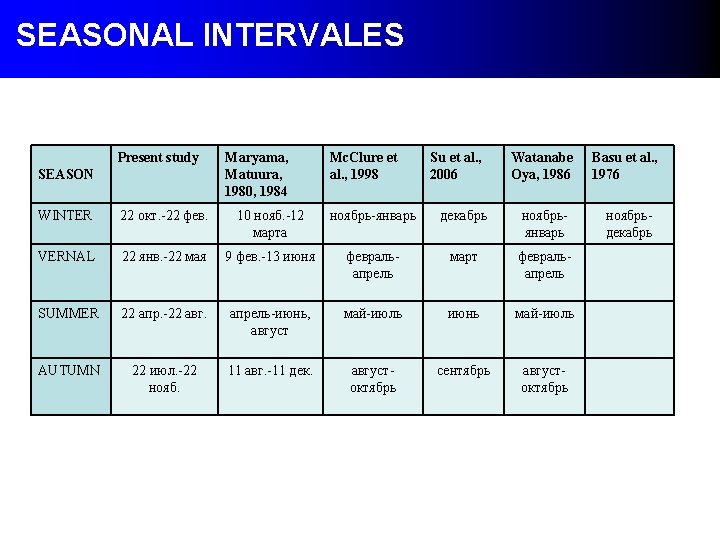
COMPARED DATA Years F 10. 7 25 50 INVLAT 1978 -79 150 220 ~1100 km 20 DIPLAT 1978 -80 150 220 19 -06 LT 300 -475 km 20 DIPLAT 1978 -80 150 220 P 1 18 -06 LT 400 -500 km 20 DIPLAT 1969 -70 ~150 ROCSAT P 3 18 -06 LT ~600 km 15 DIPLAT 1999 -04 140 180 Hinotori PB 650 19 -06 LT 650 km 20 DIPLAT 1981 ~200 Data Parameter LT interval Heights Present study ISS-b PHe+ den. dep. 20 -04 LT ~1100 km Maryama, Matuura, 1980, 1984 ISS-b PRSF, ESF 18 -06 LT Mc. Clure et al. , 1998 AE-E P Basu et al. , 1976 OGO-6 Su et al. , 2006 Watanabe, Oya, 1986 Study n Latitudes For this aim let’s take the data, pointed in the table
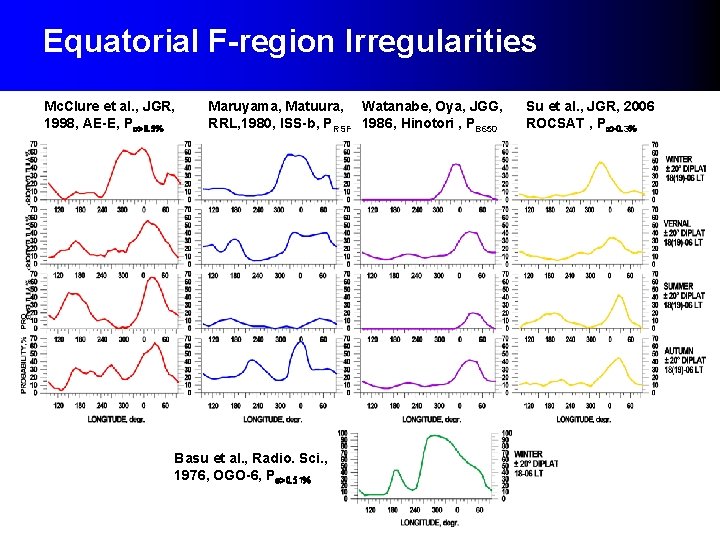
Equatorial F-region Irregularities Mc. Clure et al. , JGR, 1998, AE-E, P Maruyama, Matuura, Watanabe, Oya, JGG, RRL, 1980, ISS-b, PRSF 1986, Hinotori , PB 650 Basu et al. , Radio. Sci. , 1976, OGO-6, P 1 Su et al. , JGR, 2006 ROCSAT , P 3
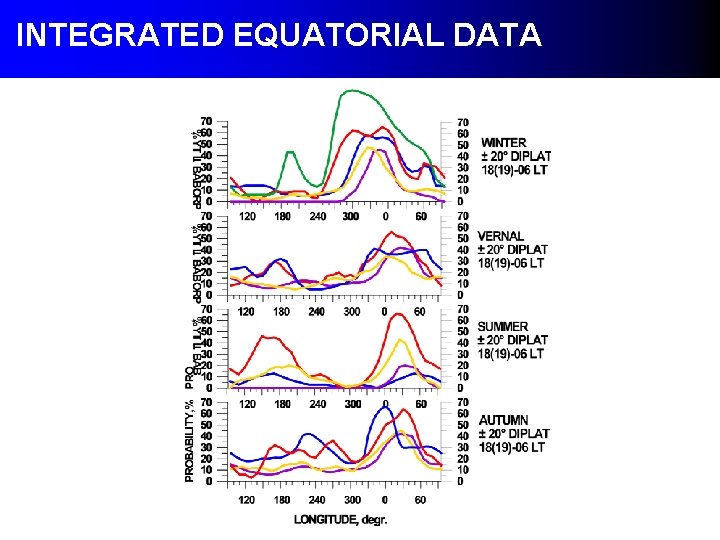
INTEGRATED EQUATORIAL DATA
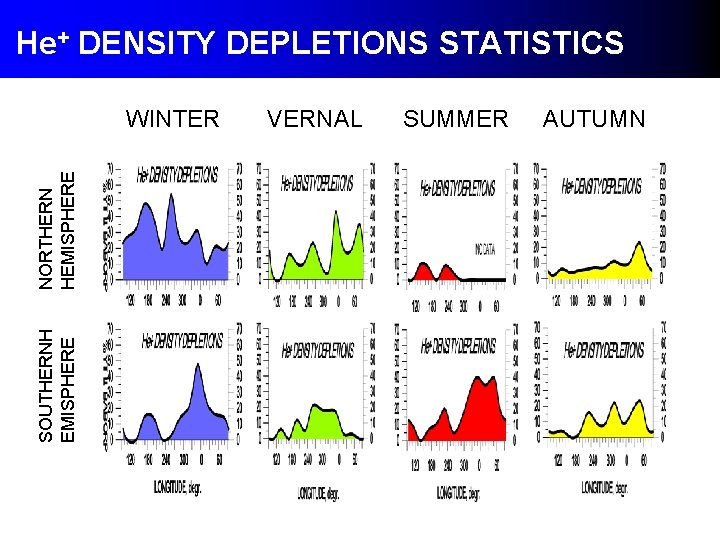
He+ DENSITY DEPLETIONS STATISTICS SOUTHERNH EMISPHERE NORTHERN HEMISPHERE WINTER VERNAL SUMMER AUTUMN
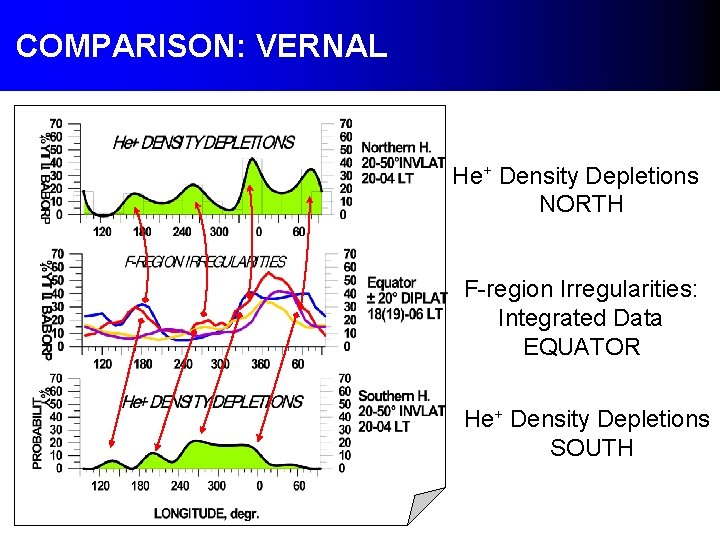
COMPARISON: VERNAL He+ Density Depletions NORTH F-region Irregularities: Integrated Data EQUATOR He+ Density Depletions SOUTH
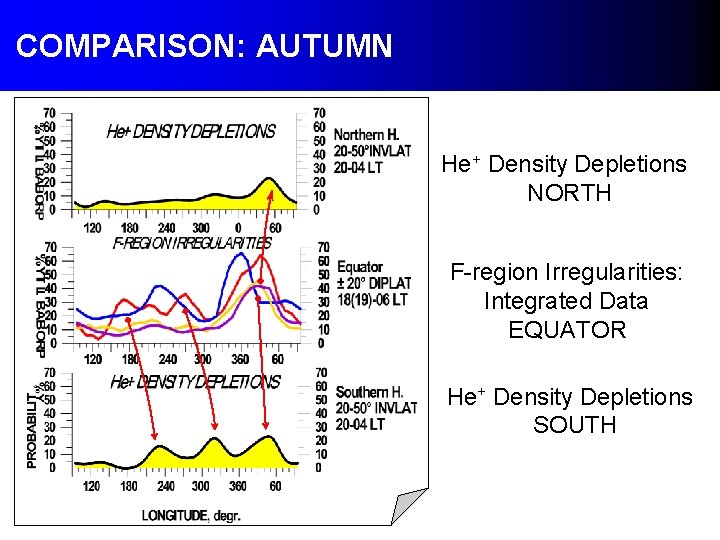
COMPARISON: AUTUMN He+ Density Depletions NORTH F-region Irregularities: Integrated Data EQUATOR He+ Density Depletions SOUTH
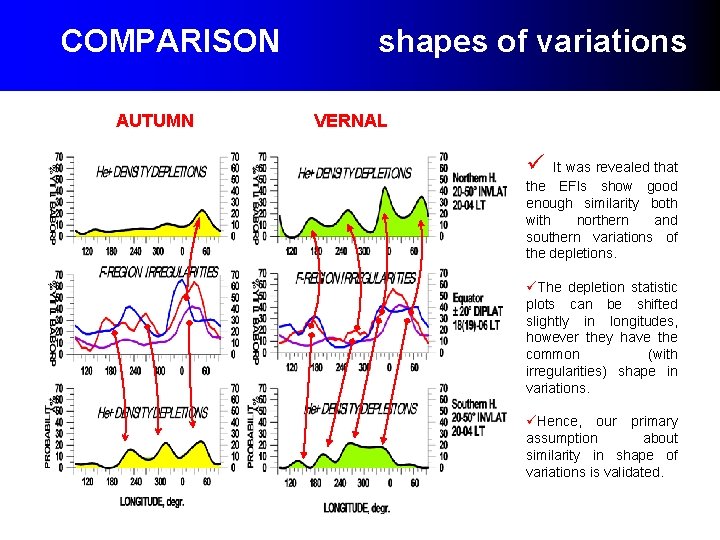
COMPARISON AUTUMN shapes of variations VERNAL ü It was revealed that the EFIs show good enough similarity both with northern and southern variations of the depletions. üThe depletion statistic plots can be shifted slightly in longitudes, however they have the common (with irregularities) shape in variations. üHence, our primary assumption about similarity in shape of variations is validated.
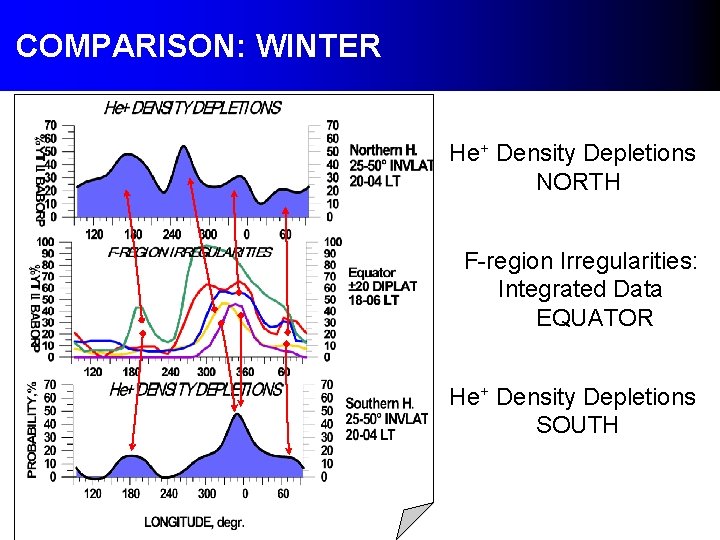
COMPARISON: WINTER He+ Density Depletions NORTH F-region Irregularities: Integrated Data EQUATOR He+ Density Depletions SOUTH
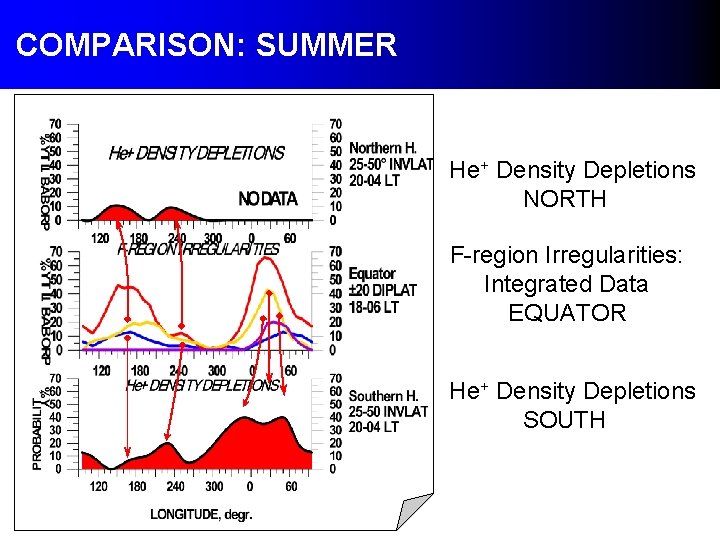
COMPARISON: SUMMER He+ Density Depletions NORTH F-region Irregularities: Integrated Data EQUATOR He+ Density Depletions SOUTH
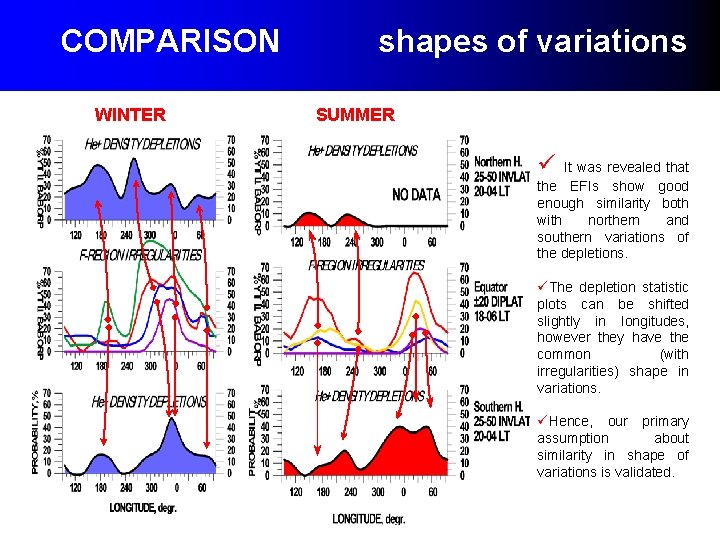
COMPARISON WINTER shapes of variations SUMMER ü It was revealed that the EFIs show good enough similarity both with northern and southern variations of the depletions. üThe depletion statistic plots can be shifted slightly in longitudes, however they have the common (with irregularities) shape in variations. üHence, our primary assumption about similarity in shape of variations is validated.
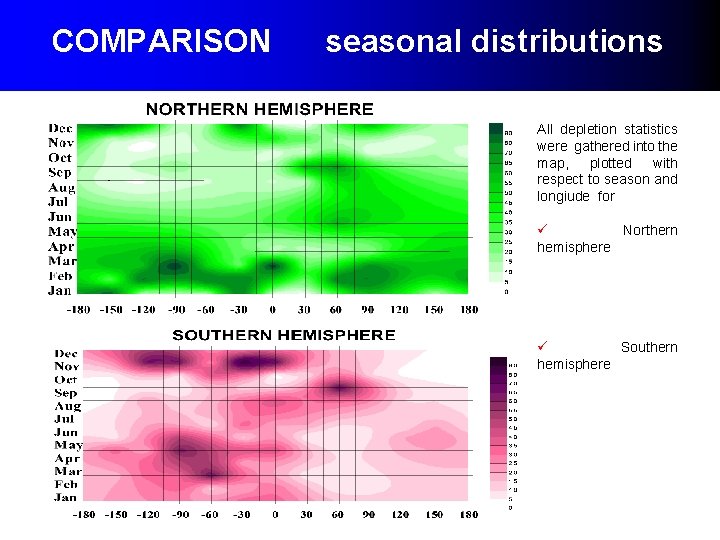
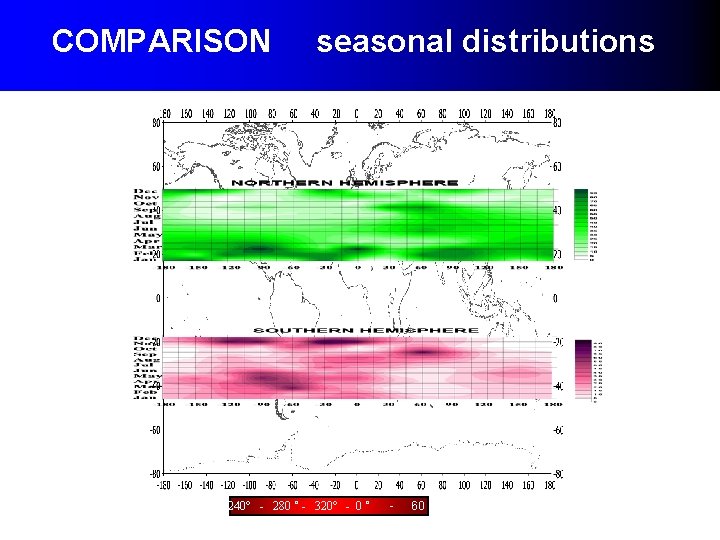
COMPARISON seasonal distributions All depletion statistics were gathered into the map, plotted with respect to season and longiude for ü Northern hemisphere ü Southern hemisphere
COMPARISON seasonal distributions 240° - 280 ° - 320° - 0 ° - 60 °
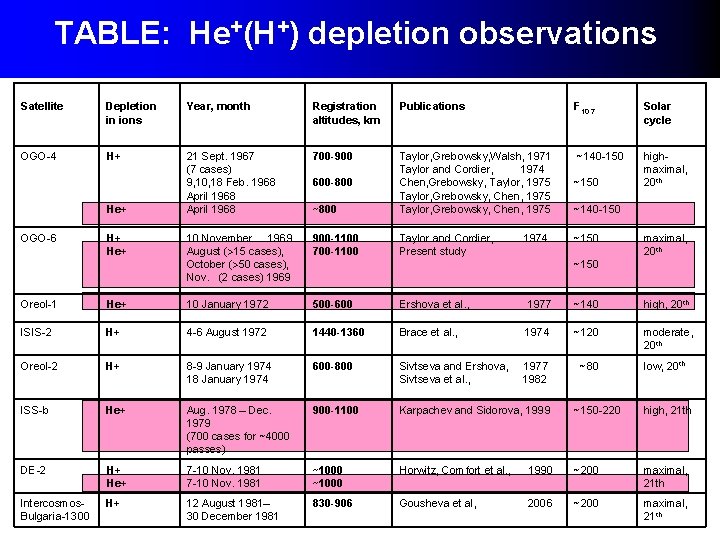
TABLE: He+(H+) depletion observations Satellite Depletion in ions Year, month Registration altitudes, km Publications F 10. 7 Solar cycle OGO-4 H+ 21 Sept. 1967 (7 cases) 9, 10, 18 Feb. 1968 April 1968 700 -900 ~140 -150 highmaximal, 20 th ~800 Taylor, Grebowsky, Walsh, 1971 Taylor and Cordier, 1974 Chen, Grebowsky, Taylor, 1975 Taylor, Grebowsky, Chen, 1975 10 November 1969 August ( 15 cases), October ( 50 cases), Nov. (2 cases) 1969 900 -1100 700 -1100 Taylor and Cordier, Present study He+ OGO-6 H+ He+ 600 -800 1974 ~150 ~140 -150 ~150 maximal, 20 th ~150 Oreol-1 He+ 10 January 1972 500 -600 Ershova et al. , 1977 ~140 high, 20 th ISIS-2 H+ 4 -6 August 1972 1440 -1360 Brace et al. , 1974 ~120 moderate, 20 th Oreol-2 H+ 8 -9 January 1974 18 January 1974 600 -800 Sivtseva and Ershova, Sivtseva et al. , 1977 1982 ~80 ISS-b He+ Aug. 1978 – Dec. 1979 (700 cases for ~4000 passes) 900 -1100 Karpachev and Sidorova, 1999 ~150 -220 high, 21 th DE-2 H+ He+ 7 -10 Nov. 1981 ~1000 Horwitz, Comfort et al. , 1990 ~200 maximal, 21 th Intercosmos. Bulgaria-1300 H+ 12 August 1981– 30 December 1981 830 -906 Gousheva et al, 2006 ~200 maximal, 21 th low, 20 th
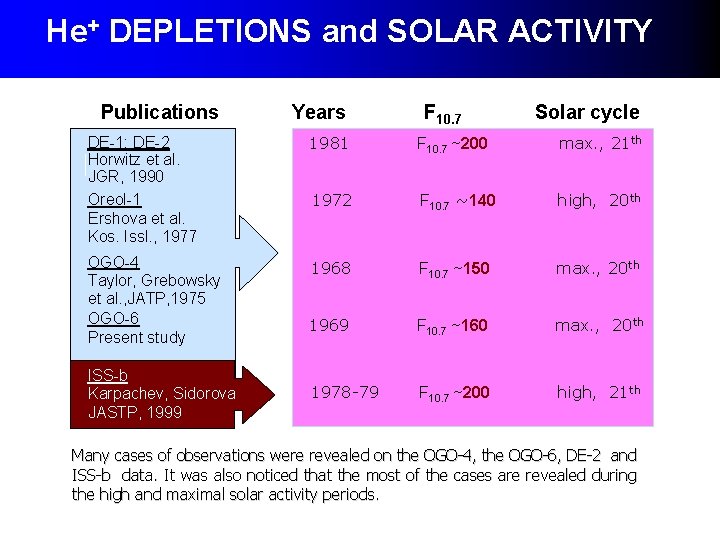
He+ DEPLETIONS and SOLAR ACTIVITY Publications Years F 10. 7 Solar cycle DE-1; DE-2 Horwitz et al. JGR, 1990 Oreol-1 Ershova et al. Kos. Issl. , 1977 1981 F 10. 7 ~200 max. , 21 th 1972 F 10. 7 ~140 high, 20 th OGO-4 Taylor, Grebowsky et al. , JATP, 1975 OGO-6 Present study 1968 F 10. 7 ~150 max. , 20 th 1969 F 10. 7 ~160 max. , 20 th 1978 -79 F 10. 7 ~200 high, 21 th ISS-b Karpachev, Sidorova JASTP, 1999 Many cases of observations were revealed on the OGO-4, the OGO-6, DE-2 and ISS-b data. It was also noticed that the most of the cases are revealed during the high and maximal solar activity periods.
QUESTION It is reasonable to ask. Ø Why the topside ionosphere plasma bubbles, seen as He+ density depletions, are more visible during high and maximal solar activity periods?
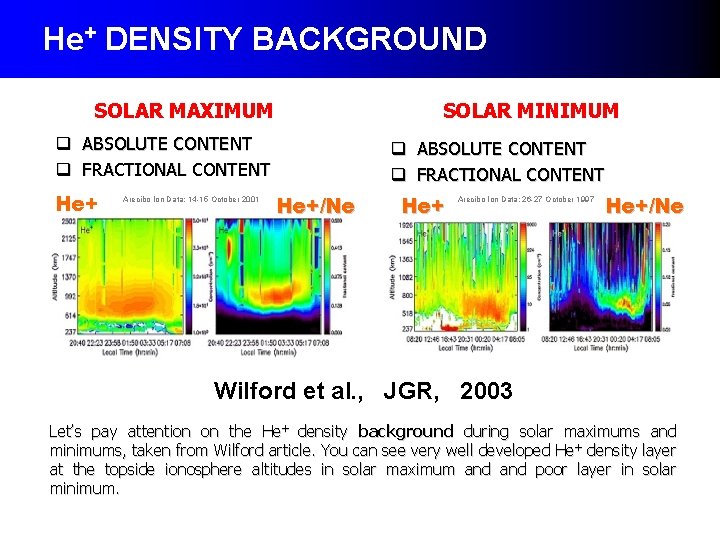
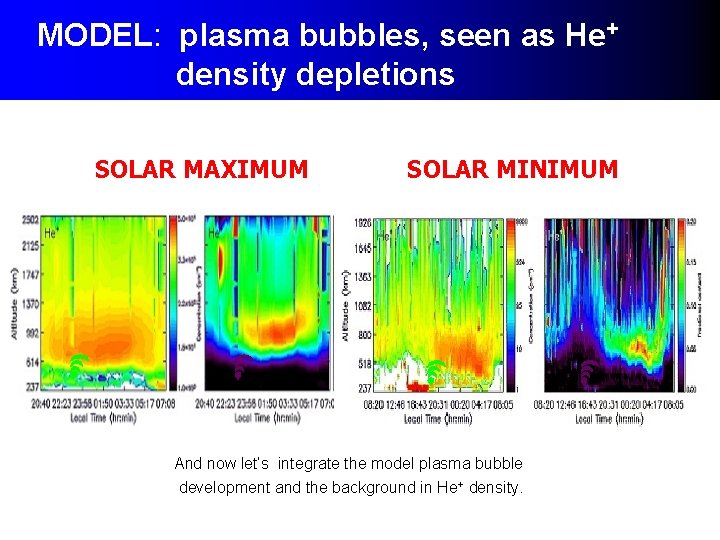
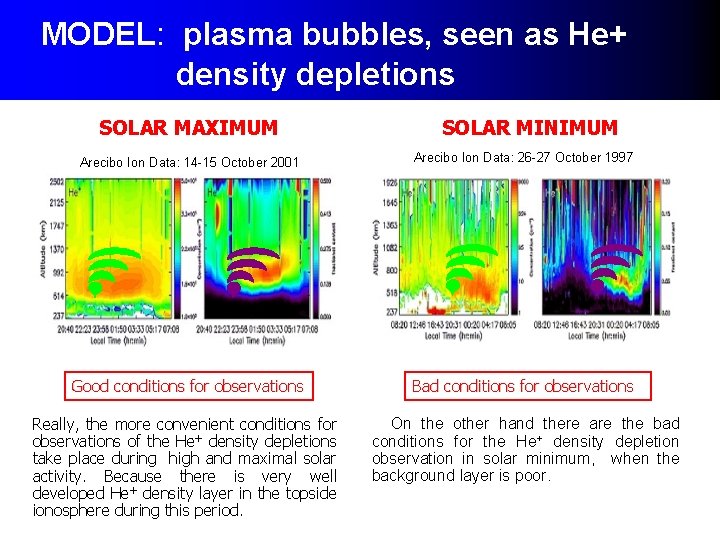
He+ DENSITY BACKGROUND SOLAR MAXIMUM SOLAR MINIMUM q ABSOLUTE CONTENT q FRACTIONAL CONTENT He+ Arecibo Ion Data: 14 -15 October 2001 q ABSOLUTE CONTENT q FRACTIONAL CONTENT He+/Ne He+ Arecibo Ion Data: 26 -27 October 1997 He+/Ne Wilford et al. , JGR, 2003 Let’s pay attention on the He+ density background during solar maximums and minimums, taken from Wilford article. You can see very well developed He+ density layer at the topside ionosphere altitudes in solar maximum and poor layer in solar minimum.
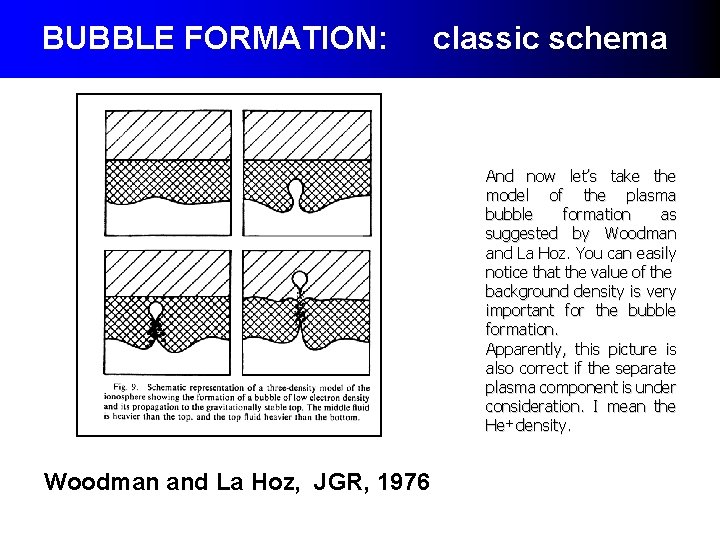
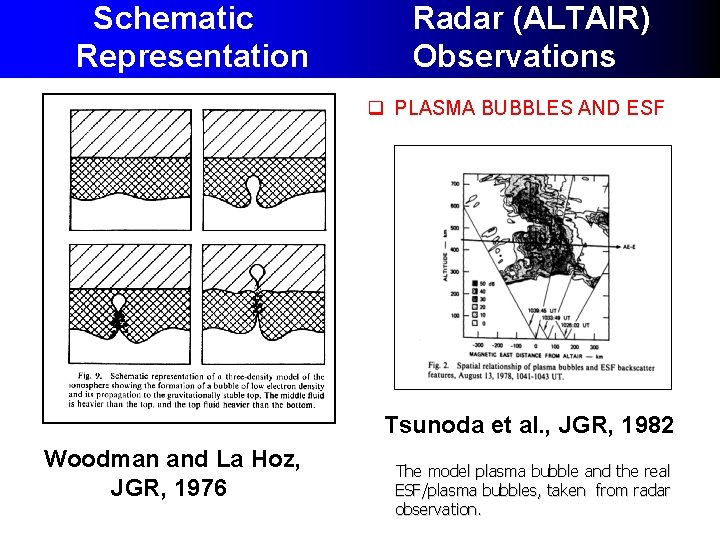
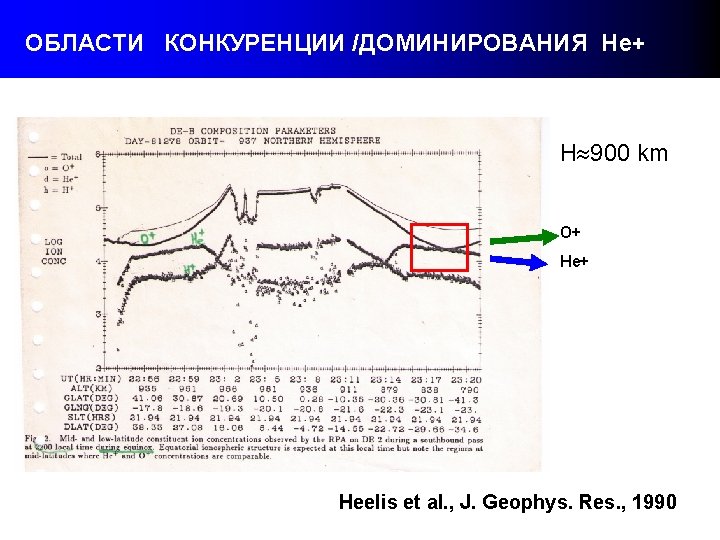
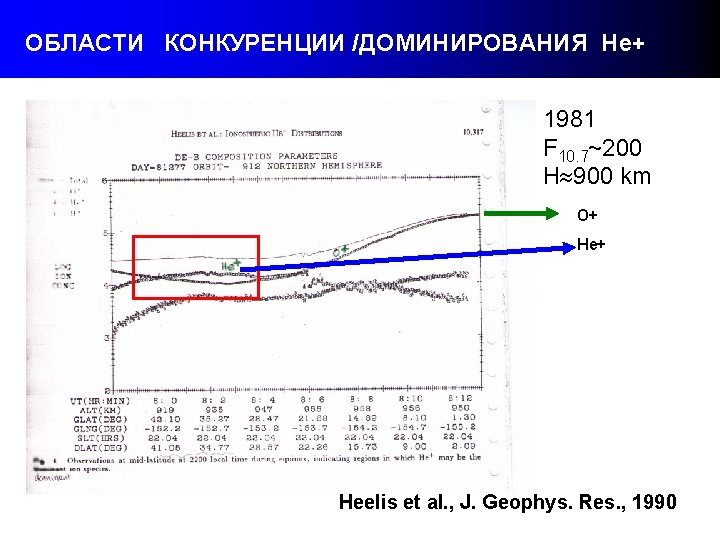
BUBBLE FORMATION: classic schema And now let’s take the model of the plasma bubble formation as suggested by Woodman and La Hoz. You can easily notice that the value of the background density is very important for the bubble formation. Apparently, this picture is also correct if the separate plasma component is under consideration. I mean the He+ density. Woodman and La Hoz, JGR, 1976
Schematic Representation Radar (ALTAIR) Observations q PLASMA BUBBLES AND ESF Tsunoda et al. , JGR, 1982 Woodman and La Hoz, JGR, 1976 The model plasma bubble and the real ESF/plasma bubbles, taken from radar observation.
MODEL: plasma bubbles, seen as He+ density depletions SOLAR MAXIMUM SOLAR MINIMUM And now let’s integrate the model plasma bubble development and the background in He+ density.
MODEL: plasma bubbles, seen as He+ density depletions SOLAR MAXIMUM SOLAR MINIMUM Arecibo Ion Data: 14 -15 October 2001 Arecibo Ion Data: 26 -27 October 1997 Good conditions for observations Bad conditions for observations Really, the more convenient conditions for observations of the He+ density depletions take place during high and maximal solar activity. Because there is very well developed He+ density layer in the topside ionosphere during this period. On the other hand there are the bad conditions for the He+ density depletion observation in solar minimum, when the background layer is poor.
СПАСИБО ! Acknowledgements • I express my gratitude to ISS Research and Operation Committee, Japan, for providing the opportunity to us the ISS-b data. • The author would like to express sincere thanks to • Dr. Yu. Ya. Ruzhin (Russia) • Dr. A. T. Karpachev (Russia) • Dr. M. A. Abdu (Brazil) • Dr. R. F. Woodman (Peru) • Dr. R. Tsunoda (USA) for the useful advices and discussions.
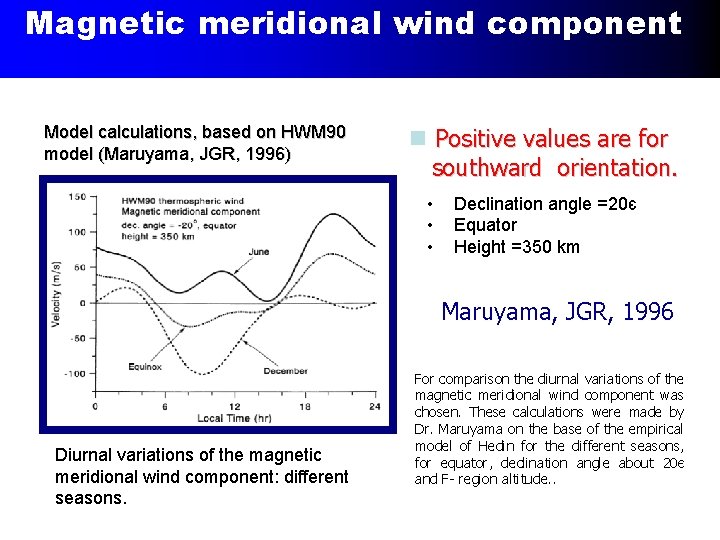
Magnetic meridional wind component Model calculations, based on HWM 90 model (Maruyama, JGR, 1996) n Positive values are for southward orientation. • • • Declination angle =20є Equator Height =350 km Maruyama, JGR, 1996 Diurnal variations of the magnetic meridional wind component: different seasons. For comparison the diurnal variations of the magnetic meridional wind component was chosen. These calculations were made by Dr. Maruyama on the base of the empirical model of Hedin for the different seasons, for equator, declination angle about 20є and F- region altitude. .
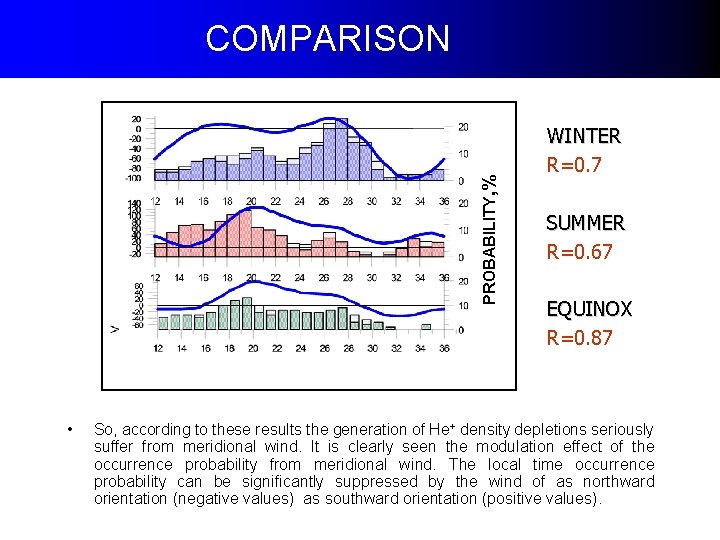
PROBABILITY, % COMPARISON • WINTER R=0. 7 SUMMER R=0. 67 EQUINOX R=0. 87 So, according to these results the generation of He+ density depletions seriously suffer from meridional wind. It is clearly seen the modulation effect of the occurrence probability from meridional wind. The local time occurrence probability can be significantly suppressed by the wind of as northward orientation (negative values) as southward orientation (positive values).