Largescale mutagenesis and interference Reverse genetics One of


 Generates mutants by homologous recombination")


")

 is targeted gene silencing via doublestranded RNA (ds. RNA); a gene")


- The")


- Slides: 56
Large-scale mutagenesis and interference
Reverse genetics • One of the best ways of studying the function of a gene is to mutate it and study the effects of the mutation on the organism. This is ‘reverse genetics’.
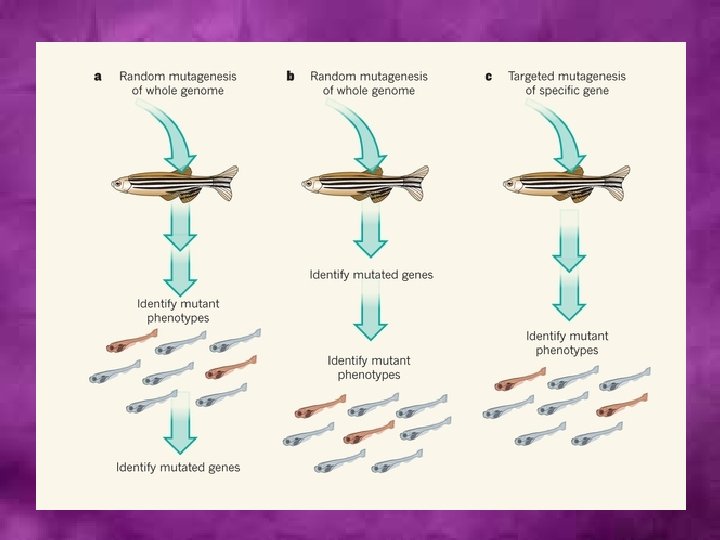
Approaches 1. Site-directed mutagenesis – mutating single genes at a time thereby covering the entire genome and studying their respective effects. Then banks of the individual mutant strains are generated. 2. Random mutagenesis – mutating a genome randomly and then picking out different mutant strains and studying the mutation associated changes in them. 3. Generate functional phenocopies of mutant alleles – the likeness of a mutation without actually alterring the DNA sequence mainly by RNA interference
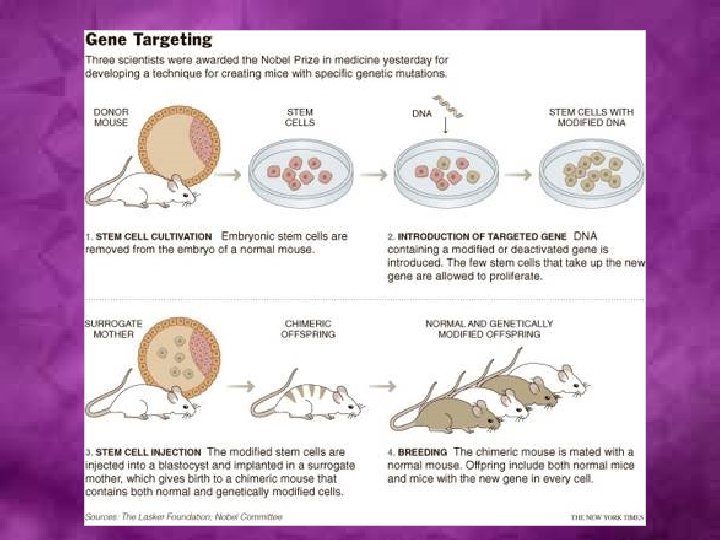
Genome-wide Gene Targeting (Site-directed mutagenesis) Generates mutants by homologous recombination
Gene knockouts
The only organism in which systematic genome-wide gene targeting has been achieved is the yeast Saccharomyces cerevisiae • The genome of S. cerevisiae contains about 6000 openreading frames, which by comparison to higher eukaryotes is a small number. • Since the yeast genome has been completely sequenced, several systematic gene knockout projects have been initiated, one by a consortium of European research organizations named the European Functional Analysis Network (EUROFAN) and another by a consortium of US and European laboratories named the Saccharomyces Gene Deletion Project consortium • It is unlikely that systematic gene targeting will be achieved in higher eukaryotes in the foreseeable future
Genome-wide random mutagenesis • It is a strategy applicable to all organisms • Mutations are induced by mutagens • Essentially, the idea behind such an experiment is to mutagenize a population of whatever species is under study and recover enough mutants to stand a reasonable chance that each gene in the genome has been “hit” at least once. • This population can then be screened to identify mutants in a particular function. • For example, large-scale screens have been carried out in the past to look for replication mutants in bacteria, cell-cycle mutants in yeast, and more recently, developmental mutants in Drosophila and the zebrafish.
Fukushima Radiation may have caused the mutated daisies A frog mutated by benzoate (herbicide)
Libraries of knock-down phenocopies can be created by RNA interference • A phenocopy has the same appearance as a mutant phenotype, but there are no changes to the DNA sequence. • While phenotypes are caused by mutations, phenocopies are generated by interfering with gene expression. • For example, antisense RNA can be used to inactivate the messenger RNA corresponding to a particular gene, or antibodies can be used to inactivate the protein. In each case, there is a loss of gene function while the gene itself remains intact. • Over the last five years, RNA interference has become the method of choice for large-scale functional studies because of its simplicity and the potency of its effects.
RNA interference (RNAi) is targeted gene silencing via doublestranded RNA (ds. RNA); a gene is inactivated by specific breakdown of the m. RNA. It is an ideal method for rapid identification of in vivo gene function.
RNA interference has been used to generate comprehensive knock-down libraries in Caenorhabditis elegans • ds. RNA corresponding to specific genes (m. RNA) were introduced into the worm to cause silencing of gene expression. • The functions of these genes were then derived from studies of the phenocopies. • Initial studies on RNAi used microinjection to deliver ds. RNA to germ line cells of C. elegans and subsequently identifying phenocopies in the progeny, but it was subsequently shown that ds. RNA can be introduced very easily by feeding the worms with bacteria that express ds. RNA.
• Using this technique on a global scale, an RNAi feeding library consisting of 16, 757 bacterial clones that correspond to 87% of the predicted genes in Caenorhabditis elegans was constructed. • Upon feeding to worms, these clones will give transient loss-of-function phenotypes for many genes by inactivating the target genes via RNAi. • By feeding the clones in this library to wild-type worms, loss-of-function phenotypes were assigned to about 10% of genes. • The fact that loss-of-function was seen only in 10% compared to 87% of targetted genes shows that RNAi may not be very efficient at whole genome-wide targetting.
Comparative genomics • In order to compare genome organization in different organisms it is necessary to distinguish between orthologs and paralogs. • Orthologs are homologous genes in different organisms that encode proteins with the same function and which have evolved by direct vertical descent. • Paralogs are homologous genes within an organism encoding proteins with related but non-identical functions. • Implicit in these definitions is that orthologs evolve simply by the gradual accumulation of mutations, whereas paralogs arise by gene duplication followed by mutation accumulation.
Protein evolution by exon shuffling
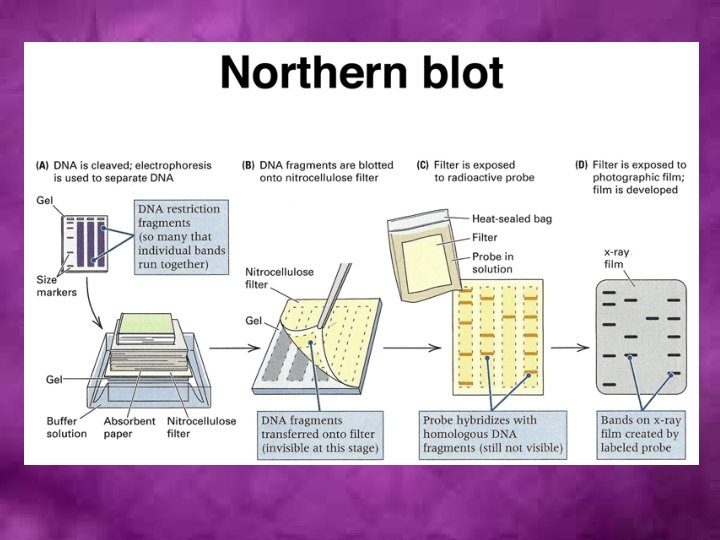
Transcriptome analysis • RT-PCR
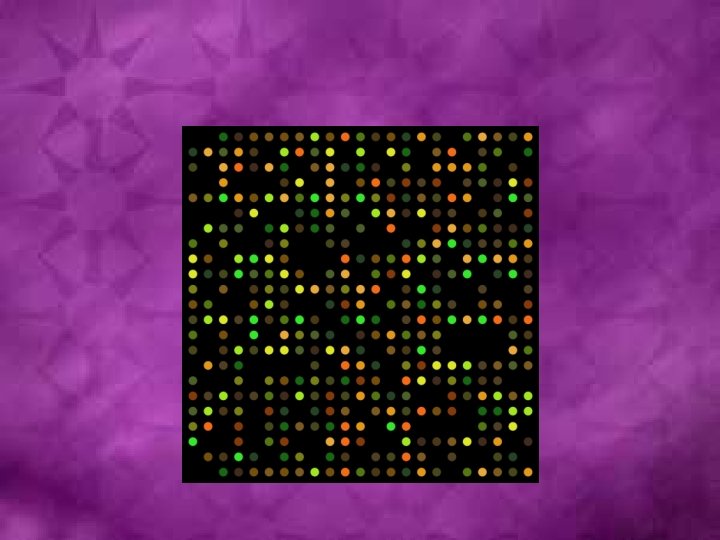
Microarray analysis
Software such as Softel are used for analysis
The software uses the spot’s shape and area as specified in the GAL file to calculate the spot’s intensity value.
The scatter plot depicts the features on a two-dimensional chart according to their quantified values. In addition, you can conveniently examine and select features of interest with the following tools.
Microarray explorer data mining tool
Protein expression • Two –dimensional electrophoresis
Mass spectrometry
• All mass spectrometers have an ion source, a mass analyzer and an ion detector, although the nature of these components varies based on the type of mass spectrometer, the type of data required and the physical properties of the sample. Samples are loaded into the mass spectrometer in liquid or dried form and then vaporized and ionized by the ion source (e. g. , ESI, MALDI).
• The charge that these molecules receive allows the mass spectrometer to accelerate the ions throughout the remainder of the system. The ions encounter electrical and/or magnetic fields from mass analyzers, which deflect the paths of individual ions based on their mass and charge (m/z). Commonly used mass analyzers include time-of-flight [TOF], quadrupoles and ion traps, and each type has specific characteristics. Mass analyzers can be used to separate all analytes in a sample for global analyses, or they can be used essentially like a filter to properly deflect only specific ions towards the detector.
Microarrays
Protein structure analysis Most protein structures are determined using X-ray crystallography
Nuclear magnetic Resonance spectroscopy
Electron microscopy
Protein structure databases • Four member sites - same data, but different presentation and tools: • • RCSB PDB (www. rcsb. org/pdb/home. do) • PDBe (http: //www. ebi. ac. uk/pdbe/) • PDBj (www. pdbj. org/) • BMRB (Biological Magnetic Resonance Data Bank, www. bmrb. wisc. edu)
Protein-protein interaction Biochemical methods - affinity chromatography, coprecipitation Databases of protein interactions: • Database of Interacting Proteins Database of Ligand Receptor Partners • Biomolecular Interaction Network Database • Protein-Protein Interaction Complex Viewer Hybrigenics • General Repository for Interaction Datasets • Molecular Interactions Database • Curagen Drosophila Interactions Database
MOLECULAR MODELLING • Several computer programs are now available for molecular modelling and graphics: • Ras. Mol is a computer program written for molecular graphics visualization intended and used primarily for the depiction and exploration of biological macromolecule structures, such as those found in the Protein Data Bank.
Abalone: • Abalone software for simulations: If you put water in a nanotube under different pressures and freeze, then it can take an interesting shapes. • Chain builder is the main tool in Abalone to generate molecular models. It allows chain molecules to be constructed from predefined residues. • Merging models from several files: Many molecular models can be merged or superimposed to study various aspects
Datasets are collections of data of a particular type or obtained by a focussed study on a particular area Eg. Expression of GFP in soyabean plants from TNAU • Analyses in bioinformatics predominantly focus on three types of large datasets available in molecular biology: macromolecular structures, genome sequences, and the results of functional genomics experiments (e. g. expression data).
Sequence analysis based on alignment
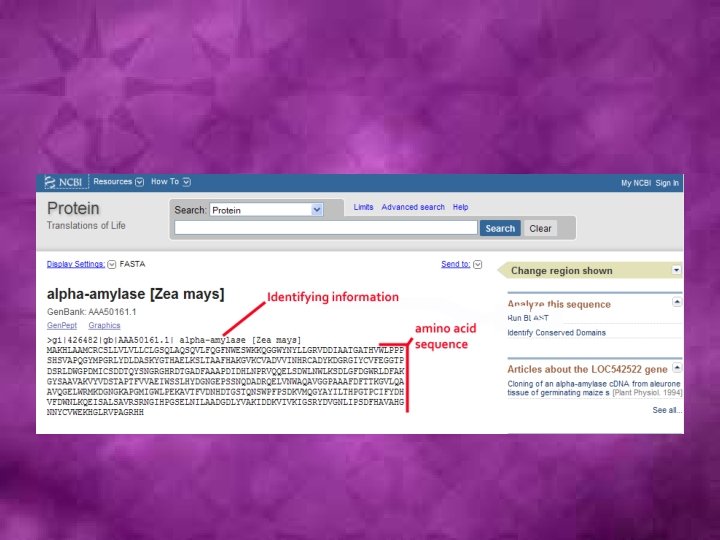
• Initial characterization of any new DNA or protein sequence starts with a database search aimed at finding out whether homologs of this gene (protein) are already available, and if they are, what is known about them. • Clearly, looking for exactly the same sequence is quite straightforward.
• Such search quickly becomes time-consuming, and we are still dealing only with identical sequences. • Finding close relatives would introduce additional conceptual and technical problems. • Let us assume that sequences that are 99% identical are definitely homologous. • What should one select as the threshold to consider sequences not to be homologous: 50% identity, 33%, or perhaps 25%? These are legitimate questions that need to be answered before one goes any further. • The example of two lysozymes shows that sequences with as low as 8% identity may belong to orthologous proteins and perform the same function.
• As a matter of fact, when comparing nucleic acid sequences, there is very little one could do. • All the four nucleotides, A, T, C, and G, are found in the database with approximately the same frequencies and have roughly the same probability of mutating one into another. • As a result, DNA-DNA comparisons are largely based on straightforward text matching, which makes them fairly slow and not particularly sensitive, although a variety of heuristics have been developed to overcome this.
• Amino acid sequence comparisons have several distinct advantages over nucleotide sequence comparisons, which, at least potentially, lead to a much greater sensitivity. • Firstly, because there are 20 amino acids but only four bases, an amino acid match carries with it >4 bits of information as opposed to only two bits for a nucleotide match. Thus, statistical significance can be ascertained for much shorter sequences in protein comparisons than in nucleotide comparisons. • Secondly, because of the redundancy of the genetic code, nearly one-third of the bases in coding regions are under a weak (if any) selective pressure and represent noise, which adversely affects the sensitivity of the searches. • Thirdly, nucleotide sequence databases are much larger than protein databases because of the vast amounts of non-coding sequences coming out of eukaryotic genome projects, and this further lowers the search sensitivity. • Finally, and probably most importantly, unlike in nucleotide sequence, the likelihoods of different amino acid substitutions occurring during evolution are substantially different, and taking this into account greatly improves the performance of database search methods as described below.
• Given all these advantages, comparisons of any coding sequences are typically carried out at the level of protein sequences; even when the goal is to produce a DNA-DNA alignment (e. g. for analysis of substitutions in silent codon positions), it is usually first done with protein sequences, which are then replaced by the corresponding coding sequences. • Direct nucleotide sequence comparison is indispensable only when non-coding regions are analyzed.
• Similarity searches aim at identifying the homologs of the given query protein (or nucleotide) sequence among all the protein (or nucleotide) sequences in the database. • An alignment of homologous protein sequences reveals their common features that are ostensibly important for the structure and function of each of these proteins; it also reveals poorly conserved regions that are less important for the common function but might define the specificity of each of the homologs. • In principle, the only way to identify homologs is by aligning the query sequence against all the sequences in the database , sorting these hits based on the degree of similarity, and assessing their statistical significance that is likely to be indicative of homology.
Alignment methods • It is important to make a distinction between a global (i. e. fulllength) alignment and a local alignment , which includes only parts of the analyzed sequences (subsequences). • Although, in theory, a global alignment is best for describing relationships between sequences, in practice, local alignments are of more general use for two reasons: • Firstly, it is common that only parts of compared proteins are homologous (e. g. they share one conserved domain, whereas other domains are unique). • Secondly, on many occasions, only a portion of the sequence is conserved enough to carry a detectable signal, whereas the rest have diverged beyond recognition. • Optimal global alignment of two sequences was first realized in the Needleman-Wunsch algorithm.
• I forgive my enemies staring at my face • Stella forgot to bring her bag • Mother will tell stories • forgive my enemies • Stella forgot • Stella • Mother will tell stories • my enemies
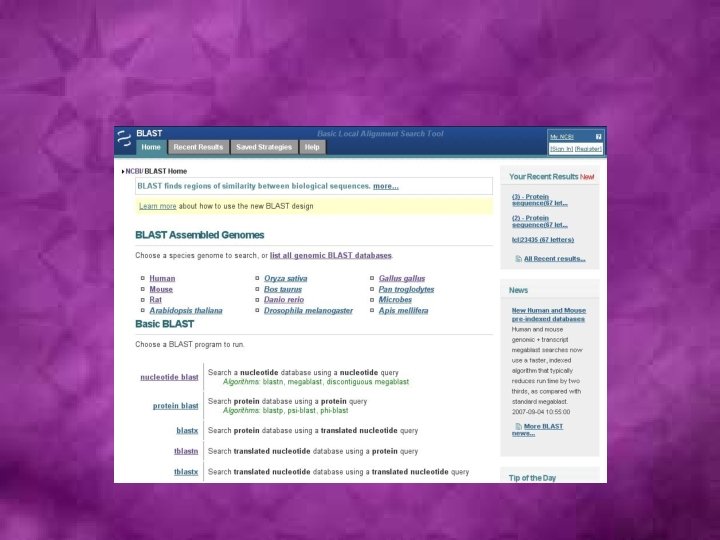
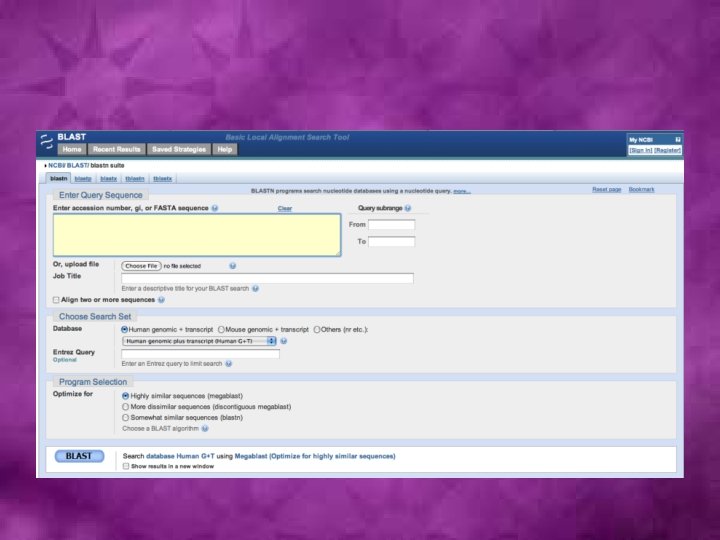
Sequence database search algorithms • Smith-Waterman: First developed algorithm • FASTA (Fast Alignment)- The first fast and sensitive method for sequence database search: A useful FASTA-based tool for comparing two sequences, LALIGN, is available at http: //fasta. bioch. virginia. edu/fasta/lalign 2. htm. • BLAST (Basic Local Alignment Search Tool): The most commonly used suite of programs for fast similarity searches in nucleotide or protein sequence databases.
Use of BLAST programs for database searches Query sequence Query type used for the database search Database used for the search BLASTN DNA DNA BLASTP Protein BLASTX DNA Translated DNA Protein TBLASTN Protein Translated DNA TBLASTX DNA Translated DNA Program
Software tools for in silico gene prediction Program Author Program versions available for: Gene. Mark, Gen. Mark. hmm Mark Borodovsky, http: //opal. biology. gatech. edu/Gene. Mark Human, mouse, rat, chicken, C. elegans, Drosophila, rice, Arabidopsis, yeast, many bacteria and archaea Glimmer, Glimmer. M Steven Salzberg, Many bacteria and archaea, http: //www. tigr. org/softlab Plasmodium, Aspergillus, rice, Arabidopsis Grail, Grail. EXP Edward Uberbacher, http: //compbio. ornl. gov Human, mouse, Drosophila, Arabidopsis, E. coli
Software tools for homology-based gene prediction Program Authors, WWW site Comment INFO Michael Laub Compares the given DNA http: //elcapitan. ucsd. edu/~ sequence against Gen. Bank info ORFGene Rogozin and Milanesi http: //www. itba. mi. cnr. it/ webgene/ Compares translated DNA against SWISS-PROT Pip. Maker Webb Miller http: //bio. cse. psu. edu Aligns similar regions in two DNA sequences