LANDSCAPE PATTERN ANALYSIS FOR ASSESSING ECOSYSTEM CONDITION Glen


 • marginal (non-spatial) measurement of land cover")


? Condition Assessment/State Evaluate Performance Diagnose Stressors/Pressure Communication w/")
 e a b")


- Slides: 26
LANDSCAPE PATTERN ANALYSIS FOR ASSESSING ECOSYSTEM CONDITION Glen D. Johnson New York State Department of Health and University at Albany, School of Public Health, Ganapati P. Patil Center for Statistical Ecology and Environmental Statistics Department of Statistics The Pennsylvania State University
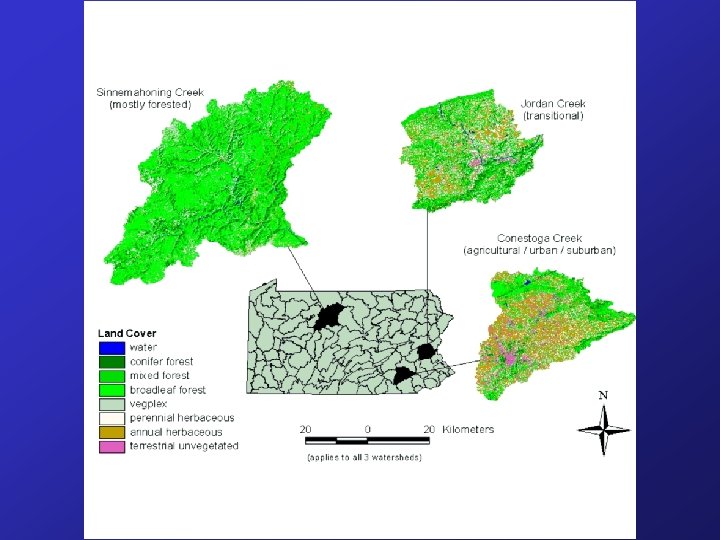
Question: Can Remotely-Sensed Imagery Provide Information about Ecosystem Condition ? Cross-Disciplinary Team: • Remote Sensing Specialists to convert raw satellite data to land cover maps • Geographic Information System Specialists to manage and map spatial data • Mathematicians and Statisticians to conceptualize and develop quantitative methods for extracting informative patterns from spatial data • Wildlife Biologists to provide field observations, define habitat requirements • Aquatic Chemists / Civil Engineers to provide field observations, define water quality
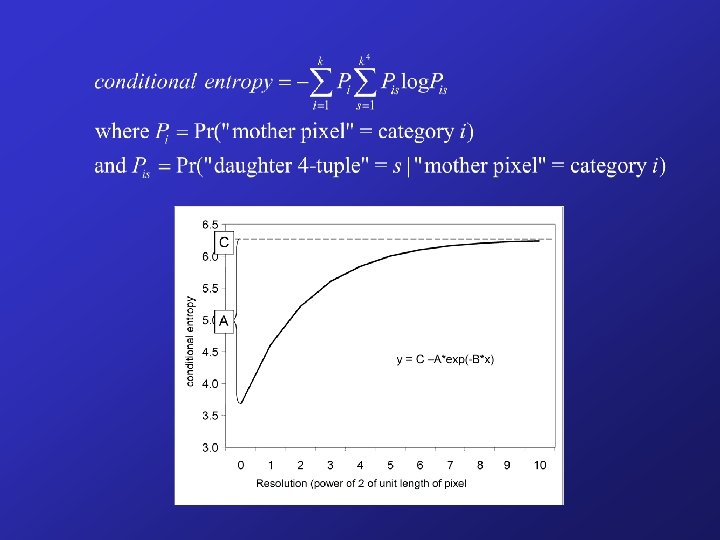
Measurements of Spatial Pattern Single-resolution (more conventional) • marginal (non-spatial) measurement of land cover proportions • roughness, edge complexity, etc. • entropy based measurements that are related to degree of contagion Multi-resolution (based on fractal concepts) • Conditional entropy profile • Hierarchical Markov Transition Matrices i
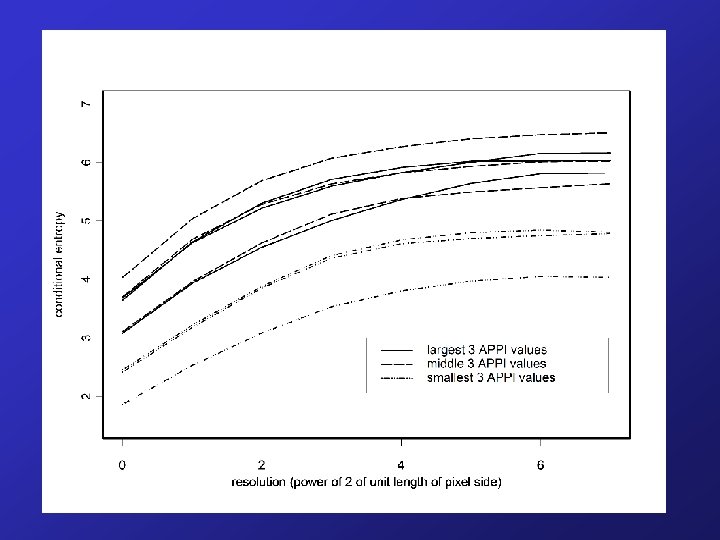
Agricultural Pollution Potential Index
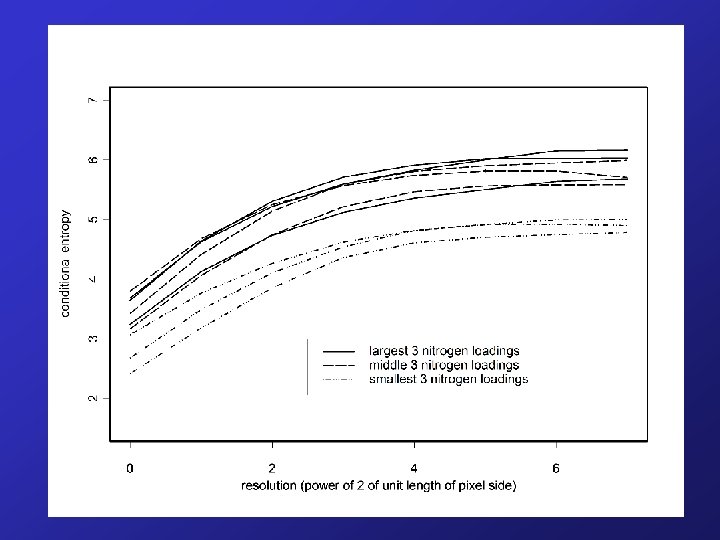
Nitrogen Loading
Predicting an Agricultural Pollution Potential Index R 2 = 0. 76
Predicting Nitrogen Loading R 2 = 0. 74
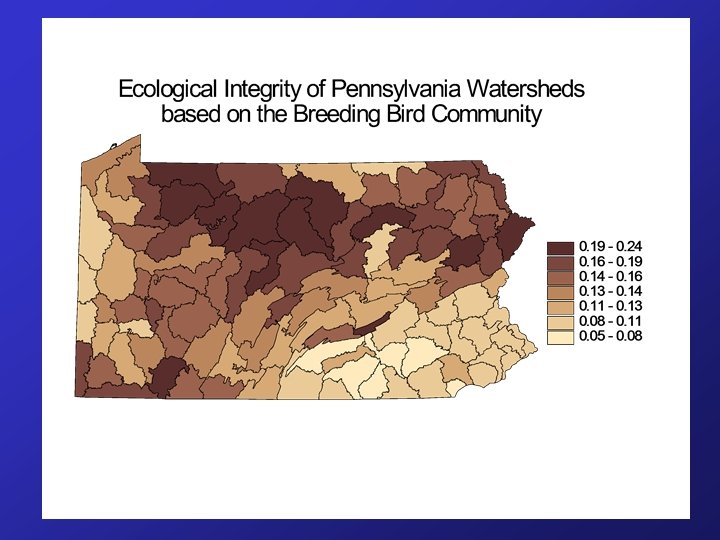
Predicting Ecological Integrity based on the Breeding Bird Community R 2 = 0. 78
So … • Remotely-sensed imagery appears to have strong predictive power for assessing ecosystem condition • After adjusting for the simple (non-spatial) proportion of forest cover and the physiographic region, land cover spatial pattern adds significantly towards explaining variability of ecosystem variables.
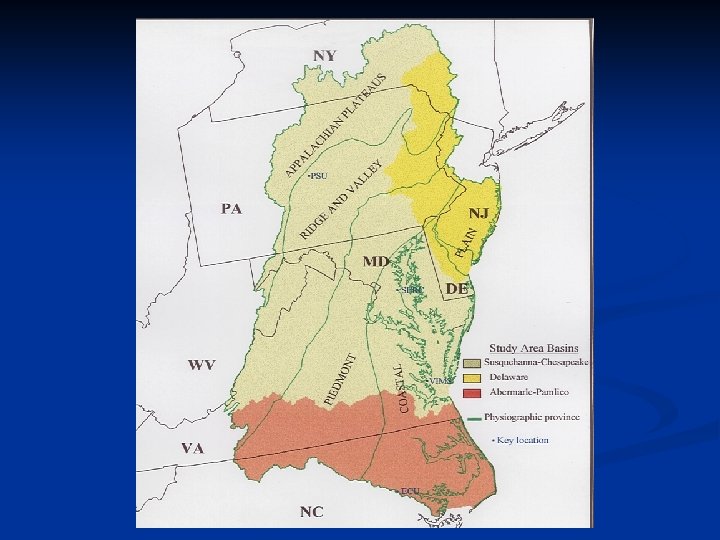
Atlantic Slope Consortium n n n Penn State University Smithsonian Environmental Research Center Virginia Institute of Marine Science East Carolina University Environmental Law Institute FTN Associates
The Proposal’s Stated Goal n The Atlantic Slope Consortium will develop and test a set of indicators in coastal systems that are ecologically appropriate, economically reasonable, and relevant to society. Our suite of indicators will produce integrated assessments of the condition, health and sustainability of aquatic ecosystems based on ecological and socioeconomic information compiled at the scale of estuarine segments and small watersheds and, with clear connections to smaller and larger scales
Observations n n n Aquatic ecosystems have been seriously degraded and are at continuing risk from various stressors. Improving and protecting the status of ecosystems will require decision makers ranging from local land use planning boards, to state, regional, and national environmental protection and resource management agencies to develop and implement integrated strategies that address the diverse stresses Multi-disciplinary research (of the kind we will provide) is needed to fill critical informational gaps.
What’s your type of question (indicator)? Condition Assessment/State Evaluate Performance Diagnose Stressors/Pressure Communication w/ Public Futures Forecast/Restore What’s your spatial/temporal scale of interest? Site Small Watershed/ 14 -digit HUC Reach Days Months County Seasons Large River Years Decades What’s the context (i. e. , social choice)? High Slope Forested Low Slope Forested Agricultural Urban Mixed/High Variance Mixed/Low Variance
Ranking Partially Ordered Sets – 2 An Example Poset (Hasse Diagram) e a b c d f Jump Size: 3 Some linear extensions a a a b b c c b a a b e c c c e b d d e e d f f f 1 5 4 2 Jump or Imputed Link (-------) is a link in the ranking that is not implied by the partial order
Ranking Partially Ordered Sets – 3 a Rank-Frequency Distributions Element a Element b Element c Element d Element e Element f Rank
Cumulative Rank Frequency Operator – 6 An Example of the Procedure 16 The curves are stacked one above the other and the result is a linear ordering of the elements: a > b > c > d > e > f