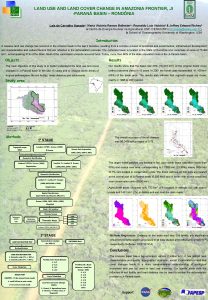
Land Use and Land Cover Change in the


- Slides: 14

Land Use and Land Cover Change in the San Antonio and Guadalupe River Basins Rachel Mills Department of Marine Science November 20, 2008

Objectives • Identify San Antonio and Guadalupe River Basins • Analyze Discharge and Stream Flow Data • Analyze Land Use/Land Cover Data • Analyze Observations vs. Discharge

San Antonio and Guadalupe River Basin Length =230 mi Avg Disch = 1200 cfs Basin Area = 2023 mi^2 Length = 240 mi Avg Disch = 400 cfs Basin Area = 934 mi^2

Guadalupe Basin

San Antonio Basin

Weekly River Discharge Guadalupe River San Antonio River

19 36 19 38 19 40 19 42 19 44 19 46 19 48 19 50 19 52 19 54 19 56 19 58 19 60 19 62 19 64 19 66 19 68 19 70 19 72 19 74 19 76 19 78 19 80 19 82 19 84 19 86 19 88 19 90 19 92 19 94 19 96 19 98 20 00 20 02 20 04 20 06 Discharge (cfs) Annual Discharge Guadalupe Annual Dishcharge 7000 6000 5000 4000 3000 2000 1000 0 Year

19 25 19 27 19 40 19 42 19 44 19 46 19 48 19 50 19 52 19 54 19 56 19 58 19 60 19 62 19 64 19 66 19 68 19 70 19 72 19 74 19 76 19 78 19 80 19 82 19 84 19 86 19 88 19 90 19 92 19 94 19 96 19 98 20 00 20 02 20 04 20 06 Discharge (cfs) Annual Discharge San Antonio Annual Discharge 3500 3000 2500 2000 1500 1000 500 0 Year

Streamflow

Land Use

Land Cover Change

Land Cover Change Category Open water Urban Barren Forest Grassland/Shrub Agriculture Wetlands 1992 183865 2322486 37931 7819649 10828073 7296467 826000 % Land Cover Change = 6. 445 2001 204403 2568680 52851 6933025 11292678 7300536 962298

Still to come… • Storm events and Land Use Land Cover Change *To be finished • Calculate number of Observations for levels of Discharge (High and low flow events) *To be finished

Questions? ? Thank you!
 Cover uncover test vs alternating cover test
 Alternate prism cover test
 De 4 kundetyper
 Hmda land use certificate charges
 The vegetation and manufactured structures that cover land
 Glcf data and products
 St mary's county land use and growth management
 Characteristics of a well-prepared upland field
 Examples of physical change
 Absolute change and relative change formula
 Whats the difference between chemical and physical change
 Supply and demand curve shifts
 What is example of physical change
 Rocks change due to temperature and pressure change
 Whats chemical change


