Laminar turbulent Flow Shear stress on fluid Newtons

Laminar & turbulent Flow • Shear stress on fluid • Newton’s law of viscosity • Shear stress, , in fluid is proportional to the velocity gradient - the rate of change of velocity across the fluid path. • Viscosity, µ is the constant of proportionality

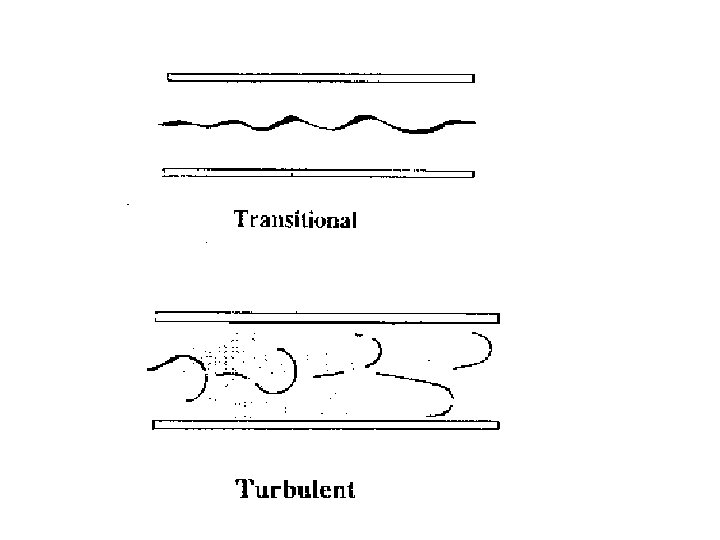
Laminar and turbulent flow in pipes • Flow can be either Ø Laminar - low velocity Ø Turbulent – high velocity Ø A small transitional zone between

Phenomenon was first investigated in the 1880 s by • Osbourne Reynolds in an experiment which has become a classic in fluid mechanics.

Unitless, or non-dimensional number Newton’s 2 nd law shear stress over fluid surface

; is different for different Conduits, Non-circular x-sections, open channels etc. The flow in round pipes is Laminar flow: Re < 2000 Transitional flow: 2000 < Re < 4000 Turbulent flow: Re > 4000 • Pipe flow nearly always turbulent

Example Given the following: Water flowing, Find the flow regime. Soln. Implies Laminar

Example Given that: • Pipe diameter: 0. 5 m • Crude oil: Kinematic viscosity = 0. 0000232 m²/s • Water: Dynamic viscosity μ = 8. 90 × 10 -4 Ns/m 2 What are the velocities when Turbulent flow would be expected to start?

• Crude oil: • Water:

Pressure loss due to friction in a pipe Consider fluid flowing in a pipe L 1 p 2 The pressure at 1 (upstream) is higher than the pressure at 2. If a manometer is attached the pressure (head) difference due to the energy lost by the fluid overcoming the shear stress is seen

• Consider a cylindrical element of incompressible fluid flowing in a pipe 1 2 Area A Direction of flow Pressure p 1 2 Pressure (p- p) The driving force (due to pressure) (F = Pressure x Area) Driving force = Pressure force at 1 - pressure force at 2

1 2 Area A Direction of flow Pressure § p 1 2 Pressure (p- p) Retarding force (due to shear stress at wall) Retarding force = shear stress x area over which it acts
")
1 2 Area A Direction of flow Pressure p § 1 Pressure (p- p) 2 Flow is in equilibrium Driving force = Retarding force Pressure loss in terms of Shear Stress at wall

log p. L

log p. L

Pressure loss in laminar flow • In laminar flow it is possible to do theoretical analysis Ø Fluid particles move in straight lines Consider a cylinder of fluid element, length L, radius r, flowing steadily in the centre of a pipe. L

• In equilibrium, the shear stress on the cylinder equal the pressure force. Remember this • By Newton’s law of viscosity we have Where y is the distance from the wall y

Measuring from the pipe centre, we change the sign and replace y with r distance from the centre, giving Hence or

In an integral form we have Integrating gives the velocity at a point distance r from the centre At r = R (the pipe wall) u. R = 0 Hence

Hence an expression for velocity at a point r from the pipe centre when the flow is laminar This is a parabolic profile (of the form y = ax 2 + b ) Velocity profile in a pipe

Hence Integrating for the limits Equation for laminar flow in a pipe

This expresses the discharge gradient in term of the pressure , diameter of the pipe and the viscosity of the fluid. • The mean velocity is determined as

, But Writing pressure loss in terms of head loss Hagan–Poiseuille equation

Example

Pressure loss in Turbulent Flow § Consider the forces on the element of fluid flowing down the slope (open channel)

Pressure loss in Turbulent Flow § The first pressure loss term is the piezometric head, p*, loss per unit length, § Hydraulic mean depth (Hydraulic radius), m • Gives shear stress in terms of head loss

Introduction of Friction factor § To make use of this equation we introduce the friction factor, f § Equating and rearranging gives § For a circular pipe, § Giving

Darcy-Weisbach Equation and the Friction factor § This is the Darcy-Weisbach equation § Gives head loss due to friction in a circular pipe § Often referred to as the Darcy equation § In terms of Q

Darcy-Weisbach Equation and the Friction factor In metric terms, g = 9. 81 m 2/s, so or

Darcy-Weisbach Equation and the Friction factor This equation describes Ø Head-loss due to friction § In terms of velocity u § In terms of Discharge Q Ø And friction factor, f § The value of f is crucial to calculation of hf

§ How do we find f? v The f described here is that common in UK (in text books and practice) v In US (and some text book) famerican = 4 f, § To try and avoid confusion this is sometime written as , § BE CAREFULL !!! Ø When using any book, look at the equation for hf

Example § Two reservoirs have a height difference 15 m. § They are connected by a pipeline 350 mm in diameter and 1000 m long with a friction factor f of 0. 005. § What is the flow in the pipe? (ignore all local losses) 1 2 Z 1 Z 2 Datum

Soln. § Write the general energy equation for the system ignoring all minor losses

Whatis isf fdependent on?

What is the value of f ? • The friction factor depends on many physical things • For laminar flow theoretical expression can be derived • For Turbulent flow, it is complex

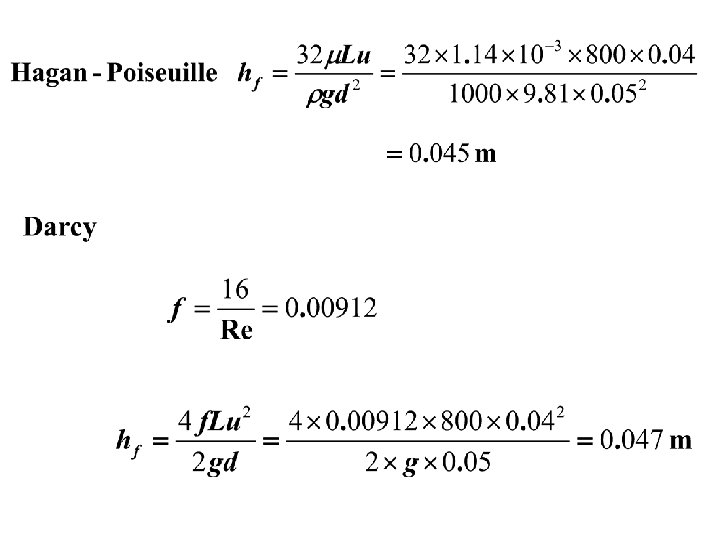
f in Laminar Flow • We have the Hagen-Poiseuille equation Ø Head loss in laminar flow • We also have the Darcy equation • Equate the two equations

Laminar flow example • Calculate the head loss due to friction in a circular pipe of 50 mm diameter, length 800 m, carrying water (μ = 1. 14 × 10 -3 Ns/m 2) at a rate of 5 litres/min. • Use both Hagen-Poiseuille and Darcy equations. Check Re

Smooth / Rough pipes in Turbulent Flow y r k Smooth Pipe Wall u y r Wall k Rough Pipe u

Smooth / Rough pipes in Turbulent Flow • Let k be the average height of projection from the surface of a boundary. • Classification based on boundary characteristics Ø If the value of k is large, then the boundary is called rough boundary Ø If the value of k is less, then boundary is known as smooth boundary.

• Classification based flow and fluid characteristics v Turbulent flow along a boundary is divided into two zones Ø First zone. Thin layer of fluid in the immediate neighbourhood of the boundary where viscous shear stress predominates, and shear stress due to turbulence is negligible. This zone is known as laminar sub-layer. Height of this layer denoted by . Ø The second zone of flow, where shear stress due to turbulence are large as compared to viscous stress is known as Turbulent zone.
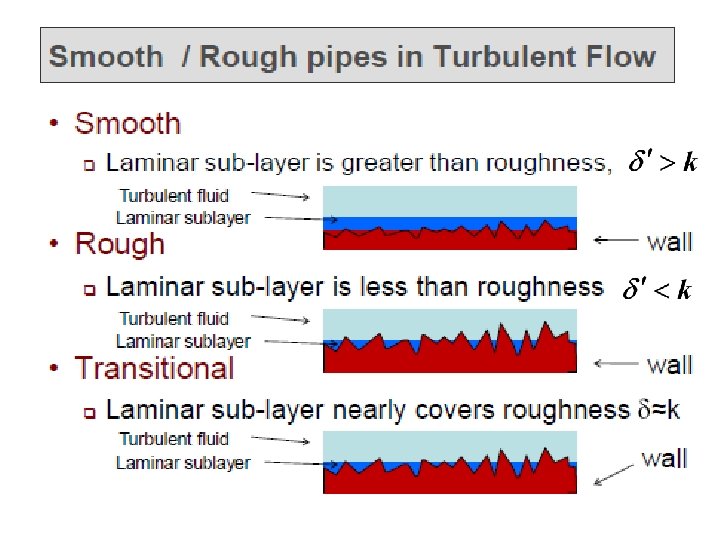

• Outside the laminar sub-layer the flow is turbulent. • Eddies of various size present in turbulent flow try to penetrate the laminar sub-layer and reach the roughness projection of the boundary. • Due to the thickness of the laminar sub-layer, the eddies are unable to reach the roughness projection of the boundary • Hence the boundary behaves as a smooth boundary. • This type of boundary is called hydrodynamically smooth boundary

§ If the Re of flow is increased the will decrease. § If the becomes much smaller than the average height k, the boundary will act as rough boundary. § Because the roughness projection are above the laminar sub-layer and the eddies present in the turbulent zone come in contact with the roughness projection a lot of energy will be lost. § Such boundary is called hydrodynamically rough boundary

From Nikuradse’s experiment the boundary is called a smooth boundary the boundary is rough the boundary is in transition

Blasius equation § In 1913 Blasius examined a lot of experimental measurements § Found 2 distinct friction effects Ø Smooth pipes and Rough pipes Blasius equation Valid for Re < 100 000

Nikuradse’s Experiment § Nikuradse made great progress in 1930’s § Artificially roughened pipes with sand of known size, k Transition turbulence A r ina Lam B C E Blasius equation Rough turbulence 15 30. 5 F G 60 Sm tur ooth bu len ce 120 252 507 D Increasing grain size Relative roughness

The following points must be noted from the curve • The line AB is common to all the pipes having different relative roughness. This line indicates laminar flow. The friction factor in this range is given as Valid for • As the value Re increases beyond 2000, the flow passes through a transition stage represented by the curve BC. Ø The flow becomes turbulent at point C. Ø Transition stage occurs in the range of Re between 2000 to 4000.

• • The curve CD represents smooth turbulent flow For turbulent flow, it is observed that the higher the ratio ro/k (the smoother the pipe), the greater is the tendency of the pipe to follow the line CD. Ø Meaning the pipe with the roughness surface causes the earliest breakaway from the line CD. • There is a Transition stage between the smooth turbulent flow to the rough turbulent flow. Ø For example, the relative roughness ro/k = 60, the transition stage is represented by the curve EF. Ø In the transition stage, f depends on both Re and ro/k.

• After the flow is completely established as rough turbulent, the curves become horizontal. Ø For example, the relative roughness ro/k = 60, it is represented by FG. Ø In this stage, f depends only on the relative roughness and is independent of Re.

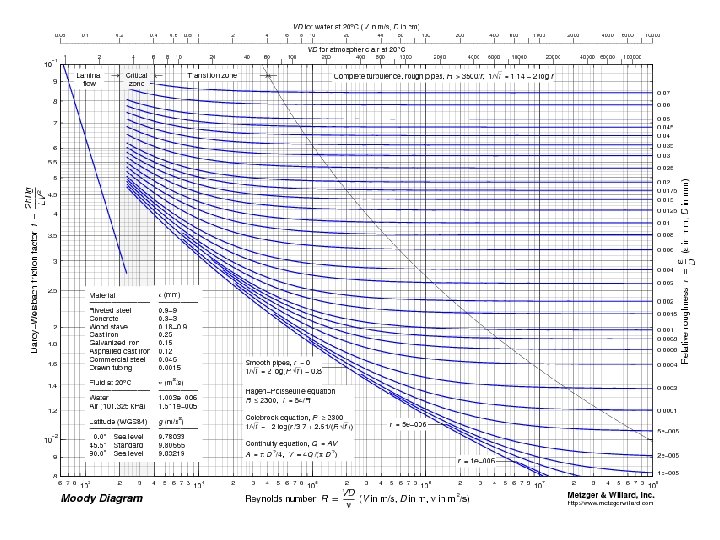
Moody Diagram
 Ignore all")
Example B + + A Given Benzene (S. G. = 0. 86) Ignore all minor losses

Solution

First find Re Implies turbulent Hence use Darcy equation: We need for Moody

Re

Velocity of Flow Ø Chezy’s Formula C - Chezy’s coefficient • Chezy from Darcy-Weisbach equation For a circular pipe Hence Hydraulic Radius

- Hydraulic radius A - Area of flow Slope The value of C = 55 – 75 P - Wetted perimeter
 Ø Manning proposed that, n - Manning’s coefficient. It depends")
Manning’s Formula (Manning’s Velocity) Ø Manning proposed that, n - Manning’s coefficient. It depends on the type of material. Relation between Manning and Chezy Ø From Chezy and Mannings equations

Ø Hazen Williams’ formula Valid for diameter 5 cm 1. 9 m, V 3 m/s, T = 16 o. C Hazen Williams As pipe smoothness increases ( ) also increases ( )
- Slides: 60