Lake Trout habitat trends Insights from 40 years

Lake Trout habitat trends: Insights from ~40 years of monitoring Clare Nelligan, Adam Jeziorski, Kathleen Rühland, Andrew Paterson and John Smol SCL/CCFFR 2019

Lake Trout • Widely distributed cold-water taxon • Found in cold, deep, well-oxygenated lakes (Martin and Olver 1976) • Valuable natural resource that is important to Ontario’s recreational fisheries (OMNRF 2014) • Specific habitat requirements for temperatures and dissolved oxygen (DO; Gibson and Fry 1953) Ontario (OMNRF 2006) (Photo http: //www. hookhack. com/html/fom 020113_laketrout. html)
 Usable Habitat: <")
Lake Trout Habitat “Squeeze” (Figure modified from Guzzo and Blanchfield 2016) Usable Habitat: < 15 °C, > 4 mg/L DO (Evans et al. 1991) Optimal Habitat: < 10 °C, > 6 mg/L DO (Evans et al. 1991) Lethal limits: > 23. 5 °C, < 3 mg/L DO (Gibson and Fry 1953, Evans 2007)
 > 7 mg/L")
Volume-weighted hypolimnetic oxygen Provincial criterion for end-of-summer volume-weighted hypolimnetic oxygen (VWHO) > 7 mg/L (Evans 2007) Incorporates the influence of both hypolimnetic VOLUME and DO CONCENTRATION VWHO = ∑ (Oxygen x Volume of Water at each 1 m strata) Total Volume of (Photo: https: //cdn. cloud 1. cemah. net/wp-content/uploads/sites/63/2018/04/CLMP-2018 -DOTemp. pdf) Hypolimnion

Shoreline Development Management in Ontario • The Lakeshore Capacity Assessment Municipalities are encouraged to restrict development within 300 m of the shoreline if: The lake has a TP concentration of 50% over modeled baseline, or if end-of-summer VWHO is < 7 mg/L *End-of-summer VWHO is sampled between August 15 th and September 15 th (OMOE et al. 2010) In most Ontario Lake Trout lakes, limited long-term data limits our ability to understand if (and how) VWHO conditions have changed

Dorset A Lakes sampled bi-weekly since the late-1970 s • Water chemistry • Temperature-oxygen profile Small (< 100 ha), mostly headwater lakes Two of the lakes, Harp and Red Chalk, support Lake Trout populations (Molot and Dillon 2008, CJFAS)

Research Questions In the two Dorset A lakes that support Lake Trout: 1. How has oxythermal habitat and end-of-summer VWHO changed over the past 40 years? 2. Is September 15 th still a good date to assess endof-summer VWHO? In the other dimictic Dorset A lakes: 3. How has VWHO changed over the past 40 years (i. e. , are trends common to all lakes)? 4. And if so, what component of the VWHO calculation (concentration and/or volume) contributed to VWHO trends?

Methods The volume of optimal habitat was determined using: • Deepest point in the water column where temperatures were ≥ 10 °C • Shallowest point in the water column where the DO concentration was ≤ 6 mg/L Habitat volumes were expressed as proportions to allow comparisons to be made between the two lakes

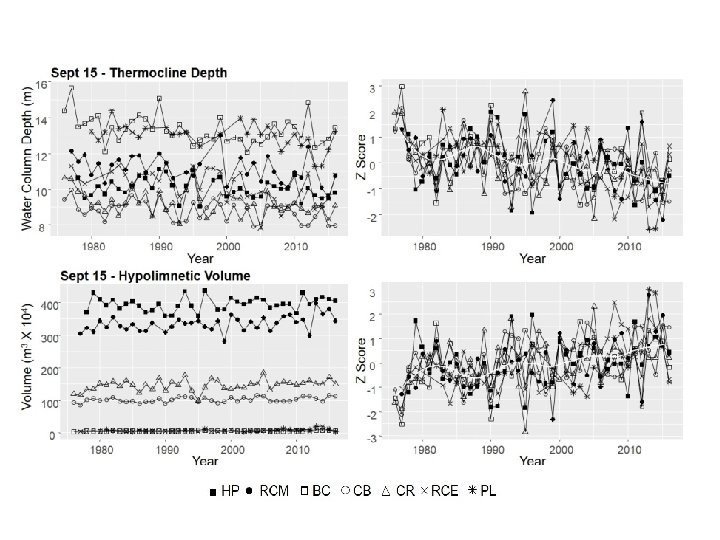
Methods For all dimictic lakes: 1. Thermocline depth 2. Hypolimnetic Volume 3. Mean hypolimnetic DO concentration 4. VWHO were calculated and values were standardized to September 15 th Mann-Kendall trend tests were performed to detect monotonic changes in each variable

1990 -1995 1978 -1989 150 200 250 300 2010 -2016 2001 -2009 150 200 300 150 200 250 300 Day of Year (DOY) Guide: 250: September 7 th, 259: September 15 th, 300: October 27 th

1990 -1999 1980 -1988 150 200 250 300 2010 -2016 2000 -2009 150 200 300 150 200 250 300 Day of Year (DOY) Guide: 250: September 7 th, 259: September 15 th, 300: October 27 th

Harp Lake Year Day of Year

Harp Lake Year Day of Year High proportions of optimal Lake Trout habitat are present for longer into the year before decreasing to seasonal minimum

Red Chalk Lake Year Day of Year
 consistently occurred")
HARP: The lowest proportion of optimal habitat (“worst-case” conditions for Lake Trout) consistently occurred after September 15 th since 2010 RED CHALK: “worst-case” condition generally occurred after September 15 th throughout the entire monitoring period

Volume-weighted hypolimnetic oxygen Are changes in VWHO driven by changes in hypolimnetic VOLUME or hypolimnetic DO CONCENTRATION, or both?

Significant breakpoint detected at 2010
![Mann-Kendall Trend Tests Sept-15 VWHO Sept-15 Mean Sept-15 Hypolimnetic Sept-15 Thermocline hypolimnetic [DO] Volume](http://slidetodoc.com/presentation_image_h2/9b0134a01952142d635640a0ee1f6d70/image-19.jpg "Mann-Kendall Trend Tests Sept-15 VWHO Sept-15 Mean Sept-15 Hypolimnetic Sept-15 Thermocline hypolimnetic [DO] Volume")
Mann-Kendall Trend Tests Sept-15 VWHO Sept-15 Mean Sept-15 Hypolimnetic Sept-15 Thermocline hypolimnetic [DO] Volume Depth Blue Chalk T = -0. 049, p = 0. 66 T = -0. 14, p = 0. 20 T = 0. 30, p = 0. 0059 T = -0. 29 p = 0. 0083 Chub T = 0. 28, p = 0. 01 T = 0. 25, p = 0. 024 T = 0. 30, p = 0. 0059 T = -0. 30, p = 0. 0063 Crosson T = 0. 24, p = 0. 027 T = 0. 21, p = 0. 060 T = 0. 26, p = 0. 018 T = -0. 28, p = 0. 0095 Harp Τ = 0. 29, p = 0. 016 T = 0. 31, p = 0. 010 T = 0. 15, p = 0. 18 T = -0. 16, p = 0. 17 Plastic T = 0. 32, p = 0. 0083 T = 0. 35, p = 0. 0041 T = 0. 29, p = 0. 028 T = -0. 36, p = 0. 006 Red Chalk (E) T = 0. 098, p = 0. 40 T = 0. 20, p = 0. 094 T = 0. 39, p = 0. 00078 T = -0. 41, p = 0. 00039 Red Chalk (M) T = 0. 22, p = 0. 047 T = 0. 19, p = 0. 10 T = 0. 33, p = 0. 0032 T = -0. 33, p = 0. 0029 Positive trends detected in both hypolimnetic volume and mean hypolimnetic [DO]
![Mann-Kendall Trend Tests Sept-15 VWHO Sept-15 Mean Sept-15 Hypolimnetic Sept-15 Thermocline hypolimnetic [DO] Volume](http://slidetodoc.com/presentation_image_h2/9b0134a01952142d635640a0ee1f6d70/image-20.jpg "Mann-Kendall Trend Tests Sept-15 VWHO Sept-15 Mean Sept-15 Hypolimnetic Sept-15 Thermocline hypolimnetic [DO] Volume")
Mann-Kendall Trend Tests Sept-15 VWHO Sept-15 Mean Sept-15 Hypolimnetic Sept-15 Thermocline hypolimnetic [DO] Volume Depth Increases post-2010 still observed in both Blue Chalk and the east basin of Red Chalk Blue Chalk T = -0. 049, p = 0. 66 T = -0. 14, p = 0. 20 T = 0. 30, p = 0. 0059 T = -0. 29 p = 0. 0083 Chub T = 0. 28, p = 0. 01 T = 0. 25, p = 0. 024 T = 0. 30, p = 0. 0059 T = -0. 30, p = 0. 0063 Crosson T = 0. 24, p = 0. 027 T = 0. 21, p = 0. 060 T = 0. 26, p = 0. 018 T = -0. 28, p = 0. 0095 Harp Τ = 0. 29, p = 0. 016 T = 0. 31, p = 0. 010 T = 0. 15, p = 0. 18 T = -0. 16, p = 0. 17 Plastic T = 0. 32, p = 0. 0083 T = 0. 35, p = 0. 0041 T = 0. 29, p = 0. 028 T = -0. 36, p = 0. 006 Red Chalk (E) T = 0. 098, p = 0. 40 T = 0. 20, p = 0. 094 T = 0. 39, p = 0. 00078 T = -0. 41, p = 0. 00039 Red Chalk (M) T = 0. 22, p = 0. 047 T = 0. 19, p = 0. 10 T = 0. 33, p = 0. 0032 T = -0. 33, p = 0. 0029 Positive trends detected in both hypolimnetic volume and mean hypolimnetic [DO]

Conclusions In the two Dorset A lakes that support Lake Trout: How has oxythermal habitat and end-of-summer VWHO changed over the past 40 years? The proportion of optimal oxythermal habitat and Sept-15 VWHO increased post-2010 Is September 15 th still a good date to assess end-of-summer VWHO? Although high proportions of optimal habitat persisted for longer into the year, the seasonal habitat minimum often occurred after Sept-15 In the other dimictic Dorset A lakes: How has VWHO changed over the past 40 years (i. e. , are trends common to all lakes)? Are trends driven by changes in hypolimnetic oxygen concentration or volume? Increases in VWHO post-2010 were observed at all sites and were driven by increases in hypolimnetic oxygen concentration, hypolimnetic volume, or both variables

Thank You for Listening! Key Literature Evans DO, Casselman JM, Wilox CC. 1991. Effects of exploitation, loss of nursery habitat, and stocking on the dynamics and productivity of Lake Trout populations in Ontario lakes. Ontario Ministry of Natural Resources p. 103. Evans DO. 2007. Effects of hypoxia on scope-for-activity and power capacity of Lake Trout (Salvelinus namaycush). Can J Fish Aquat Sci. 64: 345– 361. Guzzo MM. , Blanchfield PJ. 2016. Climate change alters the quantity and phenology of habitat for Lake Trout (Salvelinus namaycush) in small Boreal Shield lakes. Can J Fish Aquat Sci. 74: 871884. [OMOE] Ontario Ministry of the Environment, Ontario Ministry of Natural Resources, and Ontario Ministry of Municipal Affairs and Housing. 2010. Lakeshore Capacity Assessment Handbook: Protecting Water Quality in Inland Lakes. Ontario. p. 106.

Blue Chalk Latitude Longitude 45° 11' 55. 47" N 78° 56' 26. 30" W Chub 45° 12' 50. 77" N 78° 58' 56. 78" W Red Chalk East Main 45° 10' 48. 55" 45° 11' 25. 00" 45° 11' 24. 93" N N 79° 2' 79° 7' 57. 40" 78° 49' 23. 64" 78° 56' 26. 00" 78° 56' 51. 33" 5. 57" W W W Crosson Harp Plastic 45° 5' 45° 22' 45. 70" 1. 75" N Lake Area (ha) 52. 4 34. 4 56. 7 71. 4 32. 1 13. 1 44. 1 Zmean (m) 8. 5 8. 9 9. 2 13. 3 7. 9 5. 7 16. 7 Zmax (m) 23 27 25 37. 5 16. 3 19 38 446. 8 304. 2 521. 6 950. 8 252. 4 74. 8 735. 2 1. 583 3. 06 5. 79 5. 42 1. 28 1610 701 548 1131 1204 912 DOC Range (mg∙L-1) 1. 63 - 2. 50 4. 25 - 6. 07 3. 76 - 5. 53 3. 50 - 5. 66 1. 81 - 2. 99 2. 55 - 3. 95 2. 29 - 4. 40 TP Range (μg∙L-1) 5. 17 - 8. 00 7. 33 - 12. 57 7. 38 - 12. 52 5. 02 - 9. 02 3. 54 - 8. 15 5. 18 - 8. 58 3. 95 - 5. 94 p. H Range 6. 44 - 6. 92 5. 48 - 6. 05 5. 33 - 5. 98 6. 14 - 6. 62 5. 51 - 6. 04 6. 27 - 6. 66 6. 12 - 6. 60 15 25 0 90 0 Lake Volume (m 3 x 10⁴) Watershed Area (km 2) Mean Residence Time (days) Number of cottages/ dwellings 5. 89 10
, DOC (r= -0. 39), and average")
Regression Tree Analysis TP (r = -0. 49), DOC (r= -0. 39), and average winter temperature (r= 0. 31) were the most correlated with VWHO Tree R 2 = 0. 33 , root node error = 0. 82 Lowest VWHO was observed when TP >= 5. 2 μg/L Highest VWHO was observed when TP < 5. 2 μg/L and when winter temperatures were warmer than -8. 4 °C Volume Tree: R 2 = 0. 73, included DOC , [DO] Tree: R 2 = 0. 22, included TP
![Coherency Analysis Sept-15 VWHO Sept-15 Mean Sept-15 Hypolimnetic Sept-15 Thermocline hypolimnetic [DO] Volume Depth](http://slidetodoc.com/presentation_image_h2/9b0134a01952142d635640a0ee1f6d70/image-25.jpg "Coherency Analysis Sept-15 VWHO Sept-15 Mean Sept-15 Hypolimnetic Sept-15 Thermocline hypolimnetic [DO] Volume Depth")
Coherency Analysis Sept-15 VWHO Sept-15 Mean Sept-15 Hypolimnetic Sept-15 Thermocline hypolimnetic [DO] Volume Depth ri 0. 58 (p < 0. 01) 0. 54 (p < 0. 01) 0. 35 (p < 0. 01) 0. 40 (p < 0. 01) Notes Excluding Plastic Excluding Chub Higher temporal coherence for oxygen trends compared to volume trends shallowest lake (16. 3 m) highest DOC concentration
- Slides: 25