LAEDC Economic Forecast Industry Outlook Office of the


 Kyser")


 Kyser Center for Economic Research")


- Slides: 51
LAEDC Economic Forecast & Industry Outlook Office of the City Controller, Los Angeles February 10, 2015 Robert A. Kleinhenz, Ph. D. Chief Economist, Kyser Center for Economic Research, LAEDC
Outline • U. S. Economy • California Economy • Los Angeles County • City of Los Angeles • Conclusion/Outlook Kyser Center for Economic Research
U. S. Economy Kyser Center for Economic Research
National Highlights • U. S. Economy - accelerating • Labor market – expansion • Oil - gift • World economy - struggling • Stock market - volatility Kyser Center for Economic Research
U. S. Unemployment Rate 15, 0% Seasonally Adjusted, Jan 2015: 5. 7% U. S. Average 1990 -Now 10, 0% 5, 0% 0, 0% ян ян ян ян ян ян ян в- в- в- в- в- в- в- в 90 91 92 93 94 95 96 97 98 99 00 01 02 03 04 05 06 07 08 09 10 11 12 13 14 15 Source: US Bureau of Labor Statistics Kyser Center for Economic Research
U. S. Nonfarm Job Growth 600 MTM changes in thousands, Seasonally Adjusted MTM Job Changes 3 per. Mov. Avg. (MTM Job Changes) 400 200 0 -200 -400 -600 янв-08 апр-08 июл-08 окт-08 янв-09 апр-09 июл-09 окт-09 янв-10 апр-10 июл-10 окт-10 янв-11 апр-11 июл-11 окт-11 янв-12 апр-12 июл-12 окт-12 янв-13 апр-13 июл-13 окт-13 янв-14 апр-14 июл-14 окт-14 янв-15 -800 Source: US Bureau of Labor Statistics Kyser Center for Economic Research
Link Between GDP and Employment 2014 2012 2010 2008 2004 2002 2000 1998 1996 1994 1992 1990 2006 GDP 2014: +2. 4 Nonfarm Employment 1988 1986 1982 1980 1978 1976 1974 1972 1970 8% 7% 6% 5% 4% 3% 2% 1% 0% -1% -2% -3% -4% -5% 1984 GDP Source: US Bureau of Economic Analysis Kyser Center for Economic Research
Sectors of Macroeconomy • Consumer Spending • Business Spending • Net Exports • Government Purchases Kyser Center for Economic Research
U. S. Total New Vehicle Sales 20 Millions of Vehicles 17. 2 18 16 14 12 10 2008 8 2009 6 2011 4 2013 2 2014 0 Jan Feb Mar Apr May Jun Jul Aug Sep Oct Nov Dec Source: BEA Kyser Center for Economic Research
янв-14 янв-13 янв-12 янв-11 янв-10 янв-09 янв-08 янв-07 Fixed Rate Mort янв-06 янв-05 янв-04 янв-03 янв-02 янв-01 янв-00 Fed Funds янв-99 янв-98 янв-97 янв-96 янв-95 янв-94 янв-93 янв-92 янв-91 Key Interest Rates 10 -Year T-Bond 12, 0% 10, 0% 8, 0% 6, 0% 4, 0% 2, 0% 0, 0% Source: Federal Reserve Kyser Center for Economic Research
Crude Oil Prices 2005 -2014 150 Dollars/barrel West TX Intermediate 125 100 75 50 25 июл-14 янв-14 июл-13 янв-13 июл-12 янв-12 июл-11 янв-11 июл-10 янв-10 июл-09 янв-09 июл-08 янв-08 июл-07 янв-07 июл-06 янв-06 июл-05 янв-05 0 Source: US Energy Information Administration Kyser Center for Economic Research
U. S. Economy to Accelerate in 2015 Forecast Source: LAEDC (Feb 6, 2015) Kyser Center for Economic Research
California Economy Kyser Center for Economic Research
California Highlights • State - faster • Tech – leading • Housing – potential • Drought - constraint Kyser Center for Economic Research
California Adding Jobs Faster than U. S. 4, 0% YTY % change in nonfarm jobs, seasonally adjusted 3, 0% US CA 2, 0% 1, 0% 0, 0% -1, 0% -2, 0% -3, 0% -4, 0% -5, 0% -6, 0% янв-15 янв-14 янв-13 янв-12 янв-11 янв-10 янв-09 янв-08 янв-07 -7, 0% Source: US BLS, CA EDD Kyser Center for Economic Research
CA Unemployment Rate Falling Quickly 15, 0% Unemployment Rate U. S. CA 10, 0% 5, 0% 0, 0% ян ян ян ян ян ян ян в- в- в- в- в- в- в- в 90 91 92 93 94 95 96 97 98 99 00 01 02 03 04 05 06 07 08 09 10 11 12 13 14 15 Source: US BLS, CA EDD Kyser Center for Economic Research
Job Trends by California Metro Area Annual percent change in nonfarm jobs, seasonally adjusted CALIFORNIA – Dec 2014: +320, 300 +2. 1% YTY 4, 0% 3, 8% San Jose San Francisco San Diego Oakland Orange County Stockton MSA Sacramento Ventura Riverside-San Bernardino LA Bakersfield Modesto Fresno MSA 3, 3% 2, 4% 2, 3% 2, 2% 2, 0% 1, 9% 1, 7% 1, 6% 1, 5% 0, 4% 0% 1% 2% 3% 4% 5% Source: CA EDD, Labor Market Information Division Kyser Center for Economic Research
California Economic Forecast Source: LAEDC (Preliminary Forecast 1/26/15) Kyser Center for Economic Research
Los Angeles County Kyser Center for Economic Research
So Cal Highlights • So Cal Economic Activity – broad • Port Activity 2014 – 3 rd best • Motion Picture & Sound Recording – stronger • Housing - potential Kyser Center for Economic Research
Local Unemployment Rates 20% Dec 2014 LA - 7. 5% OC - 4. 4% IE - 7. 2% 20% 18% 16% 14% 12% 10% 8% 8% 6% 6% 4% 4% 2% 2% 0% 0% ян ма се ян ма се в- й- н- в- й- н- в- й- н 07 07 07 08 08 08 09 09 09 10 10 10 11 11 11 12 12 12 13 13 13 14 14 14 Source: CA EDD, Labor Market Information Division Kyser Center for Economic Research
Job Trends by Industry – Los Angeles YTY % change in nonfarm employment Dec 2014: +70, 600 jobs, +1. 7% YTY Construction Administrative & Support & Waste Services Health Care & Social Assistance Educational Services Information Leisure & Hospitality Transportation, Warehousing & Utilities Professional, Scientific & Technical Services Retail Trade Financial Activities Wholesale Trade Government Manufacturing -4% 4, 1% 3, 6% 2, 9% 2, 6% 1, 8% 1, 7% 0, 7% -0, 1% -0, 7% -1, 9% -2% 0% 2% 4% 6% Source: CA EDD, Labor Market Information Division Kyser Center for Economic Research
Los Angeles County Nonfarm Jobs YTY % change in nonfarm jobs Dec 2014: +70, 600; +1. 7% янв-08 апр-08 июл-08 окт-08 янв-09 апр-09 июл-09 окт-09 янв-10 апр-10 июл-10 окт-10 янв-11 апр-11 июл-11 окт-11 янв-12 апр-12 июл-12 окт-12 янв-13 апр-13 июл-13 окт-13 янв-14 апр-14 июл-14 окт-14 4, 0% 3, 0% 2, 0% 1, 0% 0, 0% -1, 0% -2, 0% -3, 0% -4, 0% -5, 0% -6, 0% -7, 0% -8, 0% Source: CA EDD, Labor Market Information Division Kyser Center for Economic Research
Container Throughput San Pedro Bay Ports Dec 2014 YTD: +3. 8% 14, 3 14, 1 14, 0 14, 1 2012 14, 6 15, 2 2014 2013 2009 2008 2007 2006 11, 8 2005 2004 2003 11, 8 13, 1 15, 7 2011 15, 8 2010 Millions of TEUs Sources: Ports of Los Angeles and Long Beach; forecast by LAEDC Kyser Center for Economic Research
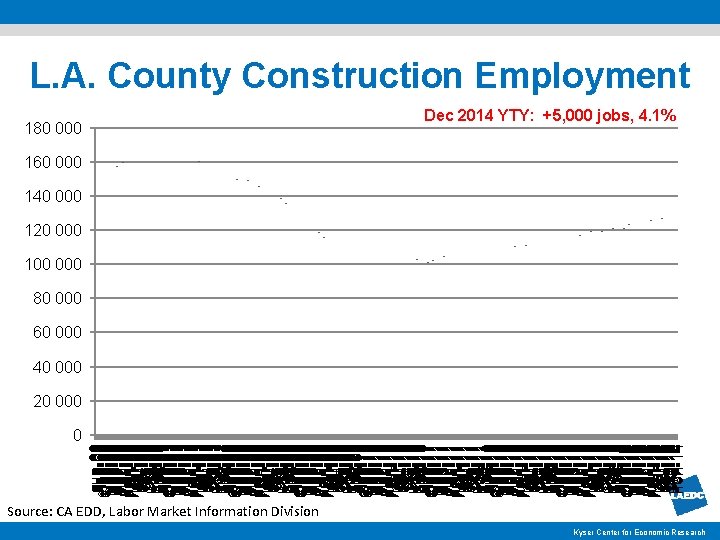
L. A. County Transportation & Warehousing Employment Dec 2014 YTY: +4, 100 jobs, +2. 6% 180 000 160 000 140 000 120 000 100 000 80 000 60 000 40 000 янв-08 янв-09 янв-10 янв-11 янв-12 янв-13 янв-14 Source: CA EDD, Labor Market Information Division Kyser Center for Economic Research
L. A. County Motion Picture & Sound Recording Employment 160 000 Shoot Days: +9. 6% YTY 140 000 120 000 100 000 80 000 Dec 2014 YTY: +5. 0% +6, 400 jobs YTD: +6. 5% 60 000 40 000 20 000 0 янв-08 янв-09 янв-10 янв-11 янв-12 янв-13 янв-14 Source: CA EDD, Labor Market Information Division Kyser Center for Economic Research
L. A. County Manufacturing Employment 500 000 Dec 2014 YTY – Durable: -2, 200, -1. 1% | Nondurable: -4, 500, -2. 8% Durable Goods 450 000 Nondurable Goods 400 000 350 000 300 000 250 000 200 000 150 000 100 000 50 000 0 янв-08 янв-09 янв-10 янв-11 янв-12 янв-13 янв-14 Source: CA EDD, Labor Market Information Division Kyser Center for Economic Research
Manufacturing Trends Adding Jobs: § Machinery Mfg § Furniture § Miscellaneous Durable Goods Losing Jobs: § Petro-Chemical § Food § Aerospace § Electronics § Apparel/Textiles Kyser Center for Economic Research
L. A. County Aerospace Products Manufacturing Employment Dec 2014 YTY: -900 jobs, -2. 3% 45 000 40 000 35 000 30 000 25 000 20 000 15 000 10 000 5 000 июл-14 янв-14 июл-13 янв-13 июл-12 янв-12 июл-11 янв-11 июл-10 янв-10 июл-09 янв-09 июл-08 янв-08 0 Source: CA EDD, Labor Market Information Division Kyser Center for Economic Research
Technology Employment Goods & Services Sectors Source: CA EDD, Labor Market Information Division Kyser Center for Economic Research
Value of Manufacturing Output – California 275 Billions of Inflation Adjusted Dollars (2009 Base Year) Durable Goods 250 Nondurable Goods 225 200 175 150 125 100 75 50 25 2014 2013 2012 2011 2010 2009 2008 2007 2006 2005 2004 2003 2002 2001 2000 0 Source: US Bureau of Economic Analysis; IHS Economics Kyser Center for Economic Research
L. A. Health Care and Social Assistance Employment Dec 2014 YTY: +22, 000 jobs, +3. 6% 700 000 600 000 500 000 400 000 300 000 200 000 100 0 фев-08 фев-09 фев-10 фев-11 фев-12 фев-13 фев-14 Source: CA EDD, Labor Market Information Division Kyser Center for Economic Research
L. A. County Professional & Business Services Employment Dec 2014 YTY: +19, 300 jobs, +3. 2% 650 000 600 000 550 000 500 000 450 000 400 000 350 000 300 000 250 000 июл-14 янв-14 июл-13 янв-13 июл-12 янв-12 июл-11 янв-11 июл-10 янв-10 июл-09 янв-09 июл-08 янв-08 200 000 Source: CA EDD, Labor Market Information Division Kyser Center for Economic Research
L. A. County Leisure & Hospitality Employment Dec 2014 YTY: +11, 300 jobs, +2. 6% 500 000 450 000 400 000 350 000 300 000 250 000 200 000 150 000 100 000 50 000 июл-14 янв-14 июл-13 янв-13 июл-12 янв-12 июл-11 янв-11 июл-10 янв-10 июл-09 янв-09 июл-08 янв-08 0 Source: CA EDD, Labor Market Information Division Kyser Center for Economic Research
L. A. County Retail Employment Dec 2014 YTY: +7, 200 jobs, +1. 7% 500 000 450 000 400 000 350 000 300 000 250 000 200 000 150 000 100 000 50 000 0 фев-08 фев-09 фев-10 фев-11 фев-12 фев-13 фев-14 Source: CA EDD, Labor Market Information Division Kyser Center for Economic Research
Real Estate Kyser. Centerforfor. Economic. Research
Home Sales & Median Prices Los Angeles County New and existing, single-family homes and condos 12 000 Sales $ Thousands Dec 2014: $460, 000, +7. 0% YTY, Sales: +3. 5% YTY $600 10 000 $500 8 000 $400 6 000 $300 4 000 $200 2 000 Home Sales Median Home Price 0 янв-06 янв-07 янв-08 янв-09 янв-10 янв-11 янв-12 янв-13 янв-14 $100 $0 Source: CA Real Estate Research Council; Data. Quick Kyser Center for Economic Research
Residential Building Permits Issued in Los Angeles County 30 Permits issued, thousands Multi-Family Single-Family 25 20 15 15 14 16 11 13 10 5 0 10 10 '03 12 '04 12 '05 10 '06 8 '07 3 '08 3 5 8 9 13 14 16 2 2 2 4 4 4 5 '09 '10 '11 '12 '13 '14 f '15 f Source: CIRB, California Home Building Foundation, Preliminary Forecast LAEDC (1/27/15) Kyser Center for Economic Research
Apartment Vacancy Rates – Southern California 12, 0 Percent vacancy, quarterly averages 8, 0 4, 0 Los Angeles Orange Riverside 1 q 14 1 q 13 1 q 12 1 q 11 1 q 10 1 q 09 1 q 08 1 q 07 1 q 06 0, 0 San Bernardino Source: CA Real Estate Research Council Kyser Center for Economic Research
Apartment Rents – Southern California Los Angeles Orange Riverside San Bernardino Ventura 2 000 1 800 1 600 1 400 1 200 1 000 800 14 Q 1 13 Q 1 12 Q 1 11 Q 1 10 Q 1 09 Q 1 08 Q 1 07 Q 1 06 Q 1 05 Q 1 600 Source: CA Real Estate Research Council Kyser Center for Economic Research
Industrial Vacancy Rates – Southern California 16, 0 Percent vacant, quarterly averages 14, 0 12, 0 10, 0 8, 0 6, 0 4, 0 2, 0 Los Angeles Orange Inland Empire 1 q 14 1 q 13 1 q 12 1 q 11 1 q 10 1 q 09 0, 0 Ventura Source: Cushman and Wakefield Kyser Center for Economic Research
Office Vacancy Rates – Southern California 30, 0 Percent vacancy, quarterly averages 26, 0 22, 0 18, 0 14, 0 10, 0 6, 0 Los Angeles Orange Inland Empire 1 q 14 1 q 13 1 q 12 1 q 11 1 q 10 1 q 09 2, 0 Ventura Source: Cushman and Wakefield Kyser Center for Economic Research
City of Los Angeles Kyser Center for Economic Research
Labor Force & Employment City of Los Angeles Labor Force Employment 2 000 1 950 000 1 900 000 1 850 000 1 800 000 1 750 000 1 700 000 1 650 000 1 600 000 1 550 000 20 01 20 02 20 03 20 04 20 05 20 06 20 07 20 08 20 09 20 10 20 11 20 12 20 13 20 14 1 500 000 Source: EDD Kyser Center for Economic Research
Unemployment Rate City of Los Angeles 16 14 12, 8 12 6 12, 1 10, 9 10 8 13, 5 6, 0 6, 3 8, 3 7, 5 7, 7 7, 2 5, 9 9, 0 5, 3 5, 6 4 2 20 00 20 01 20 02 20 03 20 04 20 05 20 06 20 07 20 08 20 09 20 10 20 11 20 12 20 13 20 14 0 Source: CA EDD Kyser Center for Economic Research
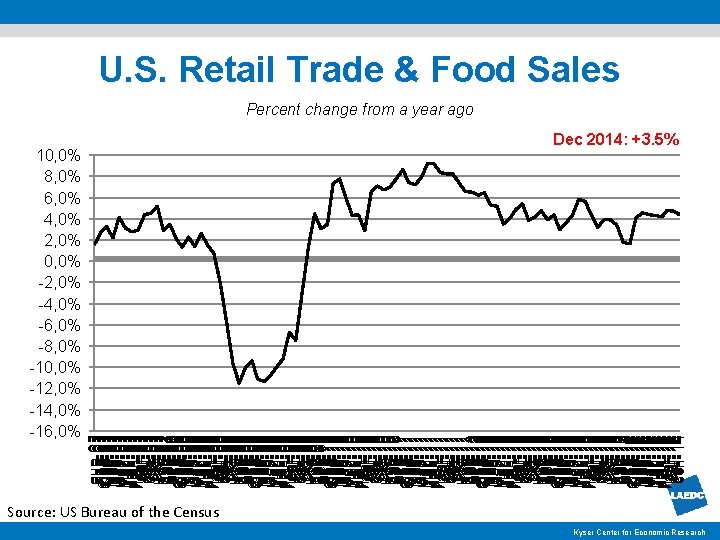
Total Taxable Sales in City of Los Angeles Taxable Retail Sales $ in Billions % Change 60 Yr-to-Yr % Change 10% 4, 8% 5, 2% 5% 5, 6% 5, 2% 8, 7% 50 2016 2015 2014 2013 2012 2011 2010 2009 2008 -20% 2007 0 2006 -15% 2005 10 2004 -10% 2003 20 2002 -5% 2001 30 2000 0% 1999 40 Source: CA BOE/LAEDC estimates/forecasts 2013 -16 Kyser Center for Economic Research
2015 Southern California Forecast Kyser Center for Economic Research
Southern California Outlook 2014 -15 Annual percent change in nonfarm jobs 2013 4, 5% 2014 2015 4, 0% 3, 5% 3, 0% 2, 5% 2, 0% 1, 5% 2, 6% 2, 5% 2, 4% 2, 6% 2, 4% 2, 0% 1, 9% 2, 3% 1, 9% 1, 5% 1, 7% 1, 0% 0, 5% 0, 0% Los Angeles County Orange County Inland Empire Ventura County Source: CA EDD, Labor Market Information Division; forecast by LAEDC Kyser Center for Economic Research
THANK YOU! Kyser. Centerforfor. Economic. Research