LABRADORSUBPOLAR GYRE CIRCULATION CONTINUES TO WEAKEN Sirpa Hakkinen

LABRADOR/SUBPOLAR GYRE CIRCULATION CONTINUES TO WEAKEN Sirpa Hakkinen, Ocean Sciences Branch, Hydrospheric & Biospheric Sciences Laboratory • Altimeter data show that subpolar sea surface height increased during the 1990 s which trend has continued up to present; i. e. continued warming and lack of widespread deep convection prevail • Analysis of geostrophic velocity shows that the subpolar North Atlantic circulation is weaker now than anytime before during the years of altimeter observations • Since the southern rim of the subpolar gyre, i. e. the North Atlantic Current, is part of the meridional overturning circulation, the weakening gyre strength may reflect weakening overturning of the Atlantic Ocean Terms: Altimeter-an instrument for determining elevation, especially a barometer used in aircraft that senses pressure changes accompanying changes in altitude. Geostrophic-of or relating to the pseudo force caused by the earth's rotation. Gyre-a circular or spiral motion, especially a circular ocean current.
 AND GEOSTROPHIC VELOCITY FIELD EOF 1’S (update using")
UPDATED ALTIMETRIC SEA SURFACE HEIGHT (SSH) AND GEOSTROPHIC VELOCITY FIELD EOF 1’S (update using only TOPEX/Poseidon and Jason-1 data, time period covered: October 1992 to March 2005; altimetric data will undergo further refinement: new GRACE based orbits etc) To get SSH /VELOCITY in any individual point one needs to multiply the value of the spatial pattern (left) by the time series value on the right) SSH HAS UNITS OF CM VELOCITIES ARE NORMALIZED SO THEY ARE DIMENSIOLESS Seasat Geosat ERS-1/2, TOPEX/Poseidon Jason-1

1 Precipitating Snow Signatures over the Polar Region Min-Jeong Kim, James Wang, Gail Jackson, and Benjamin Johnson, Code 614. 6 Instrumentation Sciences Branch, Hydrospheric & Biospheric Sciences Laboratory 89 GHz 300 150 GHz surface signature 300 250 260 200 Precipitating snow signature 220 180 150 183± 7 GHz 280 260 183± 3 GHz 280 260 240 220 • Recently, there is a great interest in measuring the snowfall with millimeter-wave radiometry. The figure above shows the AMSU-B observed brightness temperatures at 89 GHz, 150 GHz, 183. 3± 3, and ± 7 GHz over Greenland on April 15, 2003. Observations from weather station indicate a large single event with accumulation of about 65 cm in 7 hours over the southeastern Greenland. • It is noted from the figure that even 183. 3± 3 and 183. 3± 7 GHz channel can be affected by surface emission in drier atmospheres over the polar region. This suggests that land surface emissivity needs to be provided to retrieve precipitation over polar region using AMSU-B observations Terms: Radiometry- measuring the intensity of radiant (energy transferred by radiation, especially by an electromagnetic wave) energy Emissivity-the ratio of the radiation emitted by a surface to the radiation emitted by a blackbody (a theoretically perfect absorber of all incident radiation) at the same temperature.

2 Scattering Database for Atmospheric Snow Particles Min-Jeong Kim, Benjamin Johnson, Gail Jackson, and James Wang, Code 614. 6 220 GHz 183. 3± 7 GHz 150 GHz 183. 3± 3 GHz 89 GHz From Heymsfield et al. (2001) • As shown in the left side of figure above, the snow particles have various nonspherical shapes. Microwave remote sensing community generally treats snowflakes as spherical particles in the precipitation retrieval algorithms. • As shown in the right side of figure above, brightness temperature (Tb) errors caused by assuming equal mass spherical particles instead of the more realistic nonspherical snow crystals (e. g. spatial rosettes) are significant. • These errors can be minimized by applying the accurate method such as the Discrete Dipole Approximation (DDA) for calculations of the scattering parameters for various idealized shapes of snow crystals. • These DDA calculations are currently undergoing and results will be archived in a database open to scientific community for related remote sensing studies. • Current research is to develop models to describe the electromagnetic characteristics of melting snow particles, because it is common for snow particles to melt over ocean, and over land if the atmospheric temperature is > 0°C. Terms: Algorithm- a step-by-step problem-solving procedure, especially an established, computational procedure for solving a problem in a finite number of steps Spatial Rosettes- snow crystals having a circular arrangement of parts radiating out from the center and suggesting the petals of a rose

UPPER AIR INSTRUMENTATION: RESEARCH and PROJECTS MISSION Earth Science Atmospheric Studies for - atmospheric change - satellite validation Improve and Refine Upper Air Meteorological Instruments, Processing Methods, and Accuracy to Meet Today’s Climate Change Research - develop radiation corrections for present day radiosondes - develop improved ozone measuring ability - interact with other Agencies to bring about the improvements Terms: Radiosonde-An instrument carried aloft, chiefly by balloon, to gather and transmit meteorological data. Please address questions to: F. J. SCHMIDLIN/614. 6/GSFC/Wallops Flight Facility; E-mail fjs@osb. wff. nasa. gov

INVESTMENT IN INSTRUMENTATION IMPROVEMENT IS HAVING POSITIVE IMPACT ON UNDERSTANDING ATMOSPHERIC BEHAVIOR BETTER! Accurate Temperature Measuring (ATM) radiosonde technology previously utilized by the World Meteorological Organization (WMO) for improving radiosonde data is being adapted by the NWS allowing development of more accurate radiosondes for national use. By removing the radiation error, shown in the figure to be 1. 5 K, numerical analysis can be improved leading to better weather forecasts for aviation, commerce, and the American public. Development and use of NASA’s digital ozonesonde calibration system is an improvement over manual calibrations currently used at many ozonesonde observing sites. Comprehensive evaluation of sensor performance over a large range of ozone values is possible. This tool will reduce measurement variability currently affecting our understanding of long-term ozone dynamics. Please address questions to: F. J. SCHMIDLIN/614. 6/GSFC/Wallops Flight Facility; E-mail fjs@osb. wff. nasa. gov

Enhanced Arctic Warming Signal Joey Comiso/Cryospheric Sciences Branch, Hydrospheric & Biospheric Sciences Laboratory Among the most remarkable signals of a warming Arctic derived from satellite observations is the rapid retreat of the perennial sea ice cover. The perennial ice cover is that which survives the summer melt and consists mainly of thick multiyear ice floes that are the mainstay of the ice cover and had kept the Arctic from being navigable. They also reflects the Sun’s radiation efficiently and is the key component of the ice-albedo feedback that causes a warming signal to be amplified in the Arctic. The average area of the perennial ice cover from 1978 to 2005 is 5. 7 x 10⁶ km 2 while the corresponding area from 2002 to 2005 is 4. 9 x 10⁶ km 2. The ice area during the last 4 years is 0. 8 x 10⁶ km 2 or 14% lower than the average. The decline rate in the area is now 9. 8 % per decade, a significant increase to the 8. 9 % per decade previously cited and indicating an enhanced signal. The extent, which is the region that has at least 15% ice concentration, has also been declining at the rate of 8. 2% per decade. A recovery of the perennial ice cover would require a sustained cooling, especially during the spring and summer. Observed trends in the Arctic surface temperature from satellite data, however, indicate significant warming and with the ice-albedo feedback, a recovery may not happen in the near future. The effect is also out of phase with that expected from the Arctic Oscillation (AO) which has been used to describe the state of the Arctic climate. A blue Arctic Ocean in the summer may come about within this century if the trend continues and would mean a profound change in the environment, ecosystem and climate of the region. Terms: Ice floes-A flat expanse of floating ice smaller than an ice field. Albedo-The fraction of incident (falling upon or striking a surface) electromagnetic radiation reflected by a surface, especially of a celestial body

Enhanced Arctic Warming Signal • The area of the Arctic perennial ice cover in 2005 is the lowest on record since the satellite era. Yellow line in image represents the average extent from 1978 to 2004. • The average area of the perennial ice cover during the last 4 years (in green, see plot) is 4. 9 106 km 2 which is 14% lower than the average value of 5. 7 x 10⁶ km 2 from 1978 to 2005. • The area of the perennial ice cover is now declining at -9. 8% per decade, a significant increase from the previous report of -8. 9% per decade. References: Comiso, J. C. , A rapidly declining Arctic perennial ice cover, Geophys Res. Letts. , 29(20), 1956, doi: 10. 1029/2002 GL 015650, 2002. Comiso, J. C. , Arctic warming signals from satellite observations, Weather (submitted, 2005) extent Actual area
 conducted an oceanographic expedition")
Researchers from the Ocean Sciences Branch at GSFC (614. 2) conducted an oceanographic expedition from 3/30 -4/1, 2005 along the Delmarva peninsula and southern Virginia coast as well as a one day cruise on 5/27/05 within the plume outflow waters of Chesapeake Bay (see Fig. 3). The research cruises represent a continuing collaboration between GSFC scientists and Old Dominion University to study coastal ocean carbon and ecosystems by linking in situ biological, chemical, optical and other physical measurements with ocean color remote sensing observations from MODIS. One of our objectives is to expand the product suite derived from ocean color satellite data to improve our understanding of the coastal carbon cycle and expand our capabilities to study potential impacts of climate change on coastal ecosystems. Our results to date were presented at a NASA interdisciplinary science team meeting in mid-September. Our results show that dissolved organic carbon (DOC) is significantly correlated to the absorption coefficient of colored dissolved organic matter (a. CDOM), regardless of wavelength (Fig. 1). Therefore, DOC can be retrieved using MODIS or other sensors once ocean color algorithms are derived for a. CDOM. The vertical distribution of DOC (Fig. 2) and a. CDOM coincide with the physical measurements that demonstrate a vertically well-mixed water column during winter-spring (except for stations 2, 3 & 4, which are influenced by Chesapeake Bay plume waters). With the capability to retrieve a. CDOM from ocean color sensors, we will be able to monitor the interannual variability of the DOC reservoir for this coastal ocean region. Terms: In situ- In the original position Plume-A space in air, water, or soil containing pollutants released from a point source Antonio Mannino (614. 2) and Mary Russ (UMBC-GEST) Funded by NASA New Investigator Program & NASA Interdisciplinary Science Program

Antonio Mannino, Ocean Sciences Branch, Hydrospheric & Biospheric Sciences Laboratory March 30 – April 1, 2005 Fig. 1. Relationship between dissolved organic carbon and colored dissolved organic matter during spring oceanographic cruises. a. CDOM(l) – absorption coefficient of CDOM. Fig. 2 Fig. 3 Plume May 27, 2005

Hurricane Rita Waves Edward. Walsh@nasa. gov 11/09/2021 Charles. W. Wright@nas a. gov Instrumentation Sciences Branch, Hydrospheric & Biospheric Sciences Laboratory The NASA Scanning Radar Altimeter, mounted onboard a NOAA hurricane research aircraft, transmitted wave information to the National Hurricane Center during Hurricane Rita flights. al (5) (2) on g- tra ck (2) di st an c e (k m ) (3) (4) (1) (1) Hurricane Rita track and intensity (http: //fermi. jhuapl. edu/hurr/). (2) SRA wave topography measured 150 km ahead of Rita on 9/22/05, (3) Can be transformed into a directional wave spectrum to determine the 310 m dominant wavelength and 7. 1 m significant wave height, (4) And then represented as an arrow extending from the observation point (circle) in the wave propagation direction with width proportional to wave height and length proportional to wavelength. (5) The wave height the same distance ahead of Rita on 9/23/05 was only 2. 7 m and the wavelength 150 m because much wave energy was lost crossing 150 km of shoaling water on the continental shelf whose boundary is indicated by the dashed line.

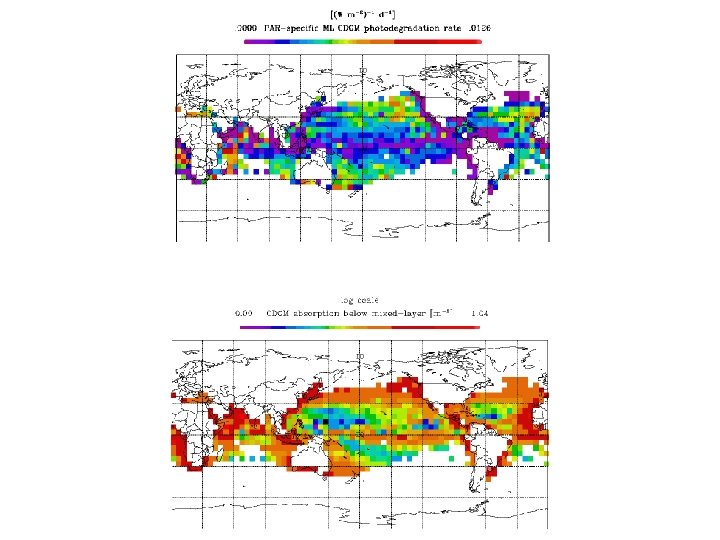
Observing the Ocean’s mixed layer depth using ocean color observations John Moisan/Ocean Sciences Branch, Hydrospheric & Biospheric Sciences Laboratory • Open ocean Chromophoric Dissolved Organic Matter (CDOM) is primarily derived from sub-mixed layer sources. • We have developed a simple model that uses the variability in mixed layer depths to predict the variability of CDOM. • The model is easily inverted so that observations of CDOM can be used to observe variability in mixed layer depths from space using present satellite observations. • One additional feature of the model is that it also yields information on the rate at which CDOM is photooxidized (top figure in next slide) as well as information on the concentration of CDOM below the ocean’s mixed-layer (bottom figure in next slide). • The value of these can play a critical role in carbon cycling and if CDOM is found to co-vary with dissolved organic material in the deep open ocean (a present on-going NSF project), could be used to map ocean DOM concentrations. • The result demonstrate that subpolar gyres, divergent ocean regions, have slower rates than that observed in equatorial regions, another ocean divergent zone, where CDOM seems to photodegrade at faster rates. • This project has recently received funding under a NASA HQ NRA. • Work is underway to invert the model to use the ocean color CDOM observations to predict the ocean’s mixed layer depths. Terms: Chromophoric- being of a chemical group capable of selective light absorption resulting in the coloration of certain organic compounds. Divergent Zone -zone where the Earth’s plates split and is pulled apart
- Slides: 13