Laboratory 2 Introduction to f MRI Data and

Laboratory 2: Introduction to f. MRI Data and Analysis September 18, 2006 HST. 583 Divya Bolar

What is functional MRI? n n Broad sense: f. MRI refers to any MR technique that goes beyond anatomy to measure aspects of local physiology. Specific sense: f. MRI refers to MR techniques that investigate changes in brain function over time. Brain function/ information processing results from the activity of ensembles of neurons. Primary goal of f. MRI is to detect signal changes corresponding to neuronal activity. Buxton RB. Introduction to Functional Magnetic Resonance Imaging, 2002. Huettel S, Song AW, Mc. Carthy G. Funcitonal Magnetic Resonance Imaging, 2004.

How do we measure neuronal activity with MRI? n n Currently not possible to directly measure neural activity (i. e. firing of action potentials) with MRI Can visualize downstream correlates of neural activity Simplified Flowchart Neural Activity Cellular Metabolism Blood Flow Venous [deoxy. Hb] Blood oxygen level dependence (BOLD)

BOLD Imaging n n Deoxyhemoglobin is paramagnetic; changes susceptibility of blood As blood becomes more deoxygenated (i. e. ↑ [d. Hb]), MRI signal decreases Increased neural activity results in decreased [d. Hb] in venous blood MRI signal thus increases with increased brain activity*

BOLD Imaging: Timing n n n BOLD effect is dependent on so-called “hemodynamic response” Hemodynamic response describes how blood flow changes over time, in response to neural activation Hemodynamic response does not instantaneously follow neural activity; it occurs with delay and dispersion
 Impulse Delay Dispersion")
Example Hemodynamic Response (impulse response) Impulse Delay Dispersion
 1 min")
Sample f. MRI paradigm: Simple visual task; flashing circle checkerboard (8 Hz) 1 min OFF ON OFF Total task/ scan time: 6 minutes • Time series f. MRI data of visual cortex voxel matches paradigm • Indicates a positive BOLD effect; i. e. decreased [d. Hb] as a result of neural activation • This is f. MRI! ON

Goals of laboratory 2: n n Goal 1: Get familiar with sample f. MRI data set from visual hemifield stimulation task (Neurolens 1 tutorial, exercises 1 and 2) Goal 2: Successfully analyze data set and show appropriate activations (Neurolens tutorial, exercises 3 and 4) n n Goal 3: Answer laboratory questions and do exercises on handout (graded) Bonus: Neurolens tutorial, exercises 5 and 6 1. Hoge RD, www. neurolens. org, 2006.
 Visual")
Visual Task: Interleaved left and right visual field stimulation (8 Hz flashing checkerboard) Visual stimulus seen by subject Left hemifield Right hemifield 32 sec

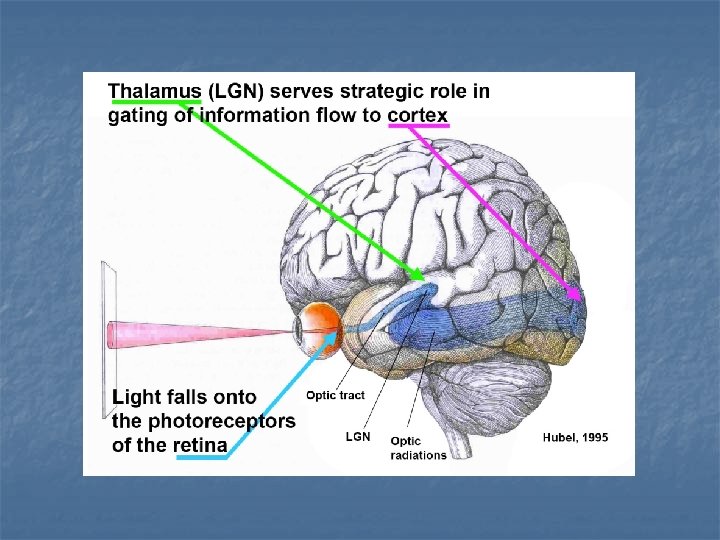
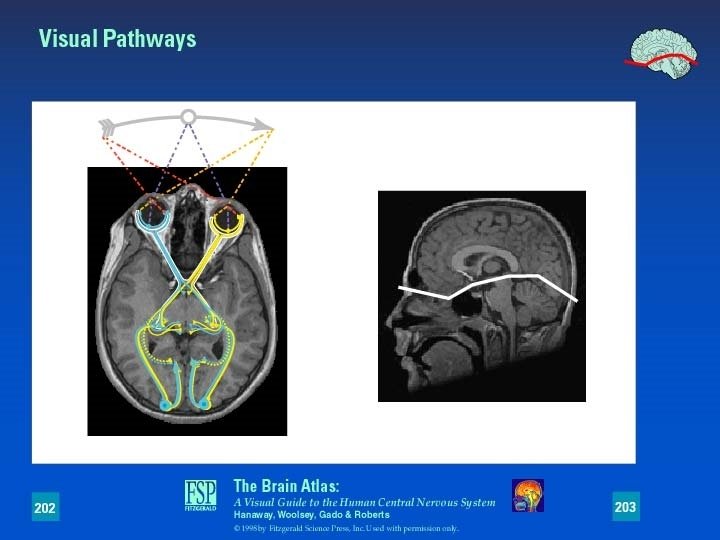
So where should we expect activation? ?

So where should we expect activation? n n Primary activation should be in contralateral visual cortex Will be slight activation in ipsilateral visual cortex, due to some crosstalk. In other words, the flashing checkerboard stiumulus does not completely isolate L/R visual fields
- Slides: 13