
LABORATORI NAZIONALI DI FRASCATI Report on research activities

LABORATORI NAZIONALI DI FRASCATI Report on research activities for the Ph. D in “Accelerator Physics” (32 nd cycle) Studies and Measurements on Cavity Beam Position Monitors for Novel Electron Linacs Student: Giovanni Franzini Advisor: Prof. Luigi Palumbo Co-Advisor: Prof. Andrea Mostacci Referee: Fabio Marcellini (PSI), Ubaldo Iriso (ALBA) 12 November 2019
Agenda ELI-NP GBS review Cavity Beam Position Monitor basic concepts Test bench design and measurements at LNF-INFN Beam Measurements at DESY Test bench design at SPARC Conclusions Page 2
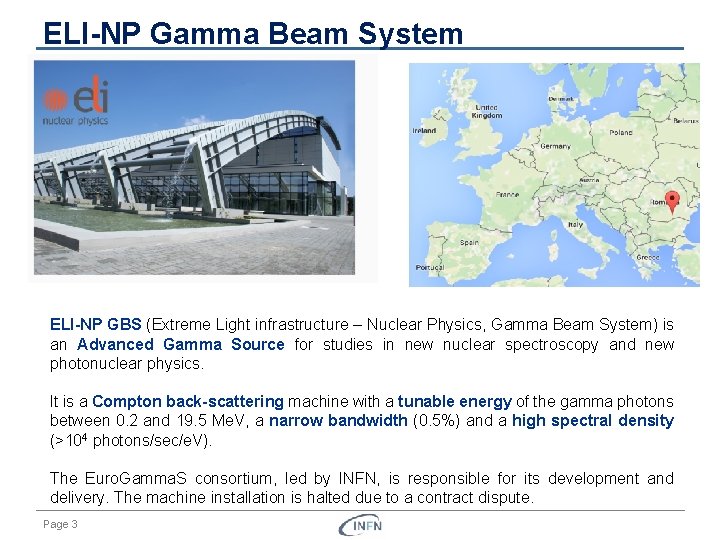
ELI-NP Gamma Beam System ELI-NP GBS (Extreme Light infrastructure – Nuclear Physics, Gamma Beam System) is an Advanced Gamma Source for studies in new nuclear spectroscopy and new photonuclear physics. It is a Compton back-scattering machine with a tunable energy of the gamma photons between 0. 2 and 19. 5 Me. V, a narrow bandwidth (0. 5%) and a high spectral density (>104 photons/sec/e. V). The Euro. Gamma. S consortium, led by INFN, is responsible for its development and delivery. The machine installation is halted due to a contract dispute. Page 3
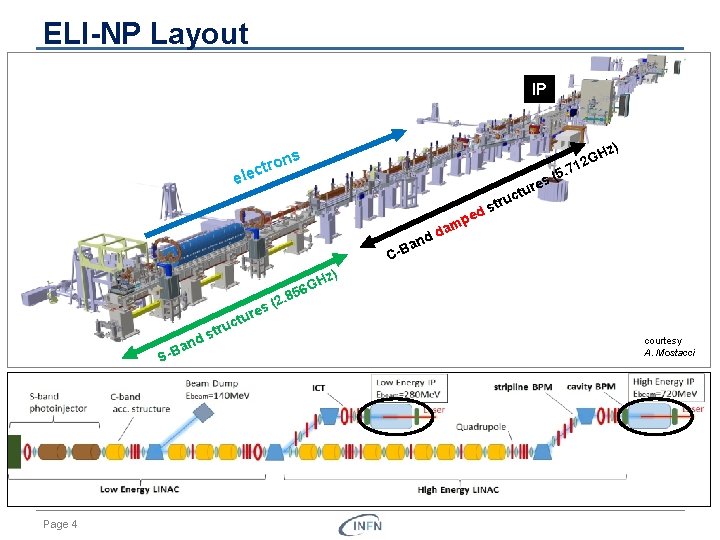
ELI-NP Layout IP z) ons tr c ele GH 2 1 7 5. ( res tu ed p am d d uc str n a C-B H 56 G nd -Ba S Page 4 uc str z) 8 (2. s re tu courtesy A. Mostacci
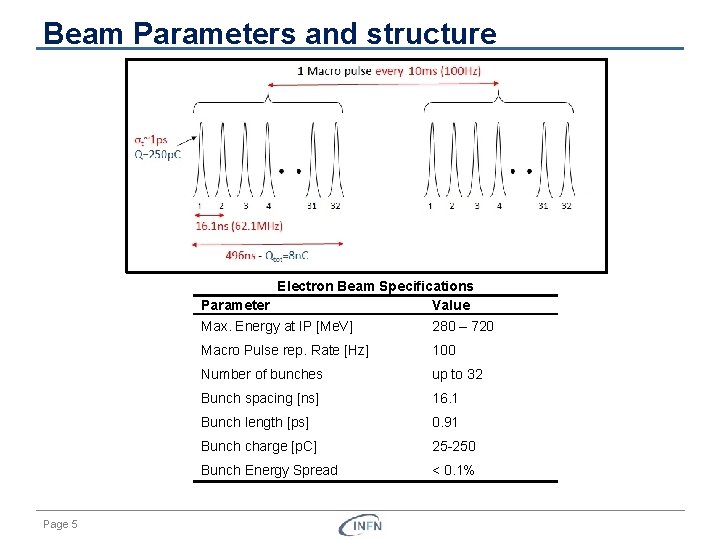
Beam Parameters and structure Electron Beam Specifications Parameter Value Page 5 Max. Energy at IP [Me. V] 280 – 720 Macro Pulse rep. Rate [Hz] 100 Number of bunches up to 32 Bunch spacing [ns] 16. 1 Bunch length [ps] 0. 91 Bunch charge [p. C] 25 250 Bunch Energy Spread < 0. 1%
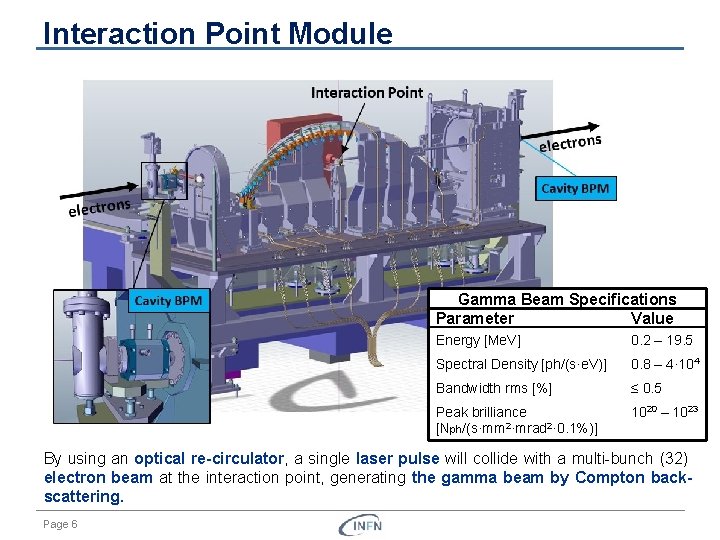
Interaction Point Module Gamma Beam Specifications Parameter Value Energy [Me. V] 0. 2 – 19. 5 Spectral Density [ph/(s·e. V)] 0. 8 – 4· 104 Bandwidth rms [%] ≤ 0. 5 Peak brilliance [Nph/(s·mm 2·mrad 2· 0. 1%)] 1020 – 1023 By using an optical re-circulator, a single laser pulse will collide with a multi bunch (32) electron beam at the interaction point, generating the gamma beam by Compton backscattering. Page 6
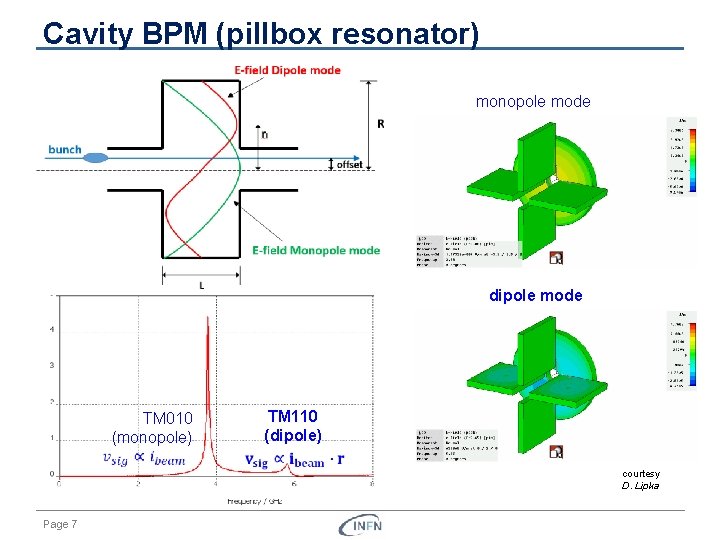
Cavity BPM (pillbox resonator) monopole mode dipole mode TM 110 (dipole) TM 010 (monopole) Page 7 courtesy D. Lipka
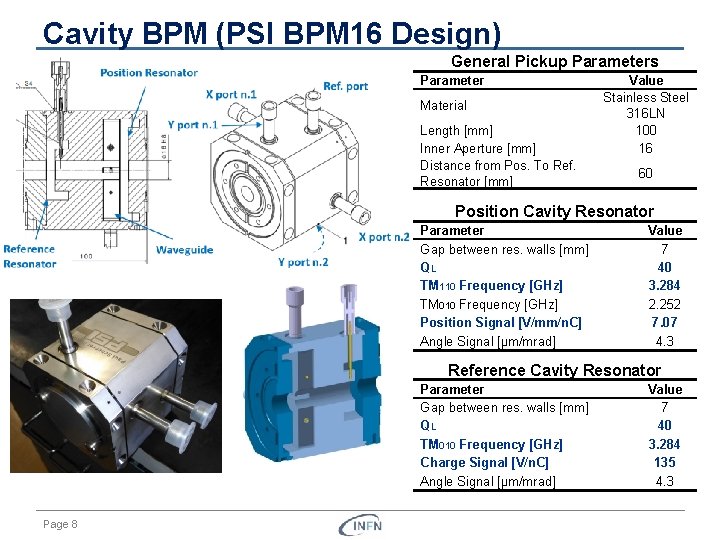
Cavity BPM (PSI BPM 16 Design) General Pickup Parameters Parameter Material Length [mm] Inner Aperture [mm] Distance from Pos. To Ref. Resonator [mm] Value Stainless Steel 316 LN 100 16 60 Position Cavity Resonator Parameter Gap between res. walls [mm] QL TM 110 Frequency [GHz] TM 010 Frequency [GHz] Position Signal [V/mm/n. C] Angle Signal [µm/mrad] Value 7 40 3. 284 2. 252 7. 07 4. 3 Reference Cavity Resonator Parameter Gap between res. walls [mm] QL TM 010 Frequency [GHz] Charge Signal [V/n. C] Angle Signal [µm/mrad] Page 8 Value 7 40 3. 284 135 4. 3
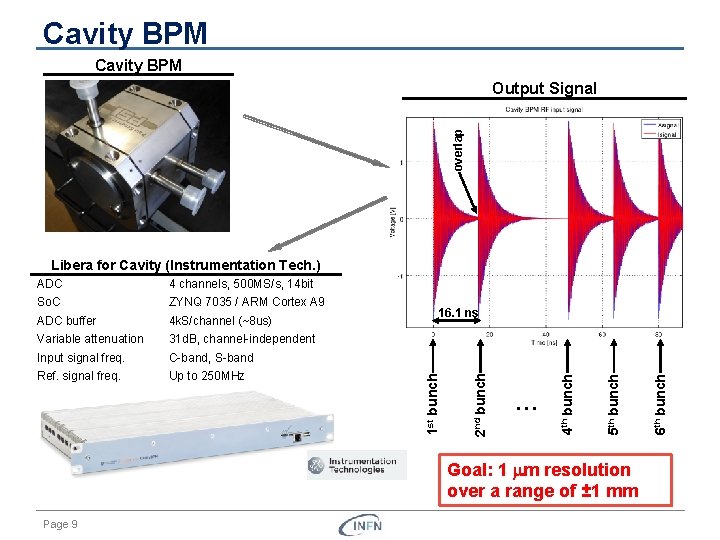
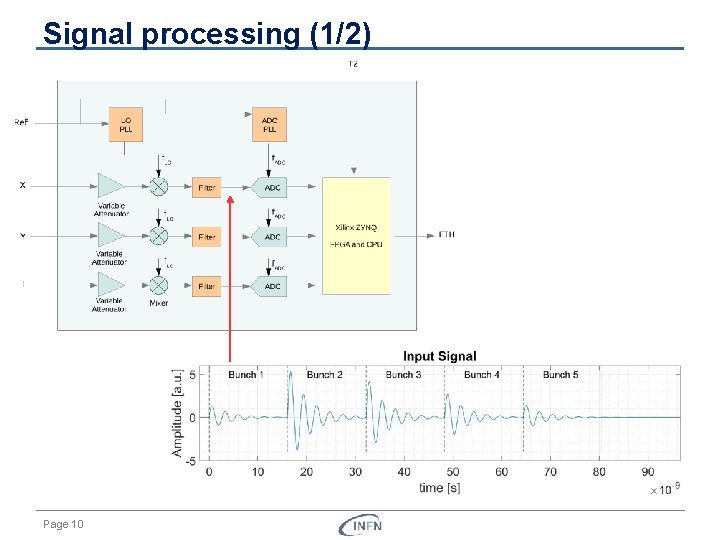
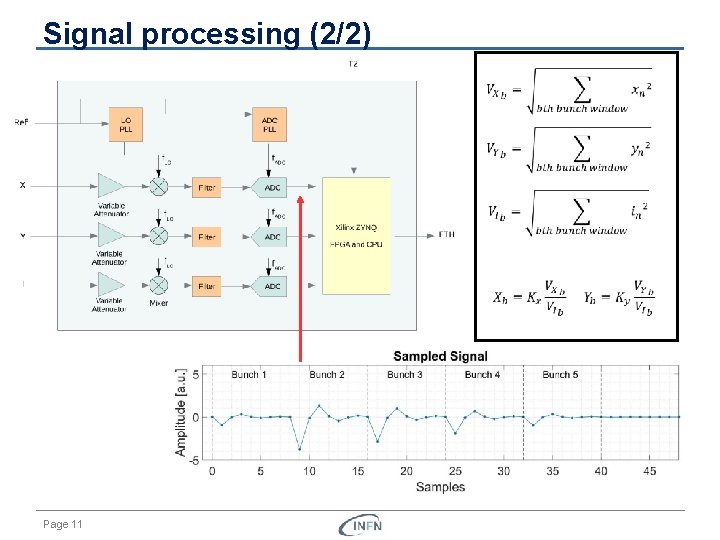
Cavity BPM overlap Output Signal Libera for Cavity (Instrumentation Tech. ) 4 k. S/channel (~8 us) Variable attenuation 31 d. B, channel independent Input signal freq. C band, S band Ref. signal freq. Up to 250 MHz 16. 1 ns … Goal: 1 mm resolution over a range of ± 1 mm Page 9 6 th bunch ADC buffer 5 th bunch ZYNQ 7035 / ARM Cortex A 9 4 th bunch So. C 2 nd bunch 4 channels, 500 MS/s, 14 bit 1 st bunch ADC
Signal processing (1/2) Page 10
Signal processing (2/2) Page 11
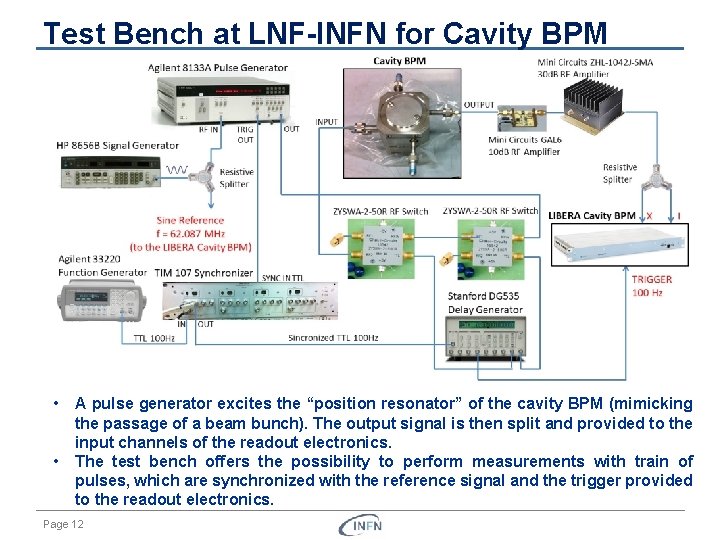
Test Bench at LNF-INFN for Cavity BPM • • A pulse generator excites the “position resonator” of the cavity BPM (mimicking the passage of a beam bunch). The output signal is then split and provided to the input channels of the readout electronics. The test bench offers the possibility to perform measurements with train of pulses, which are synchronized with the reference signal and the trigger provided to the readout electronics. Page 12
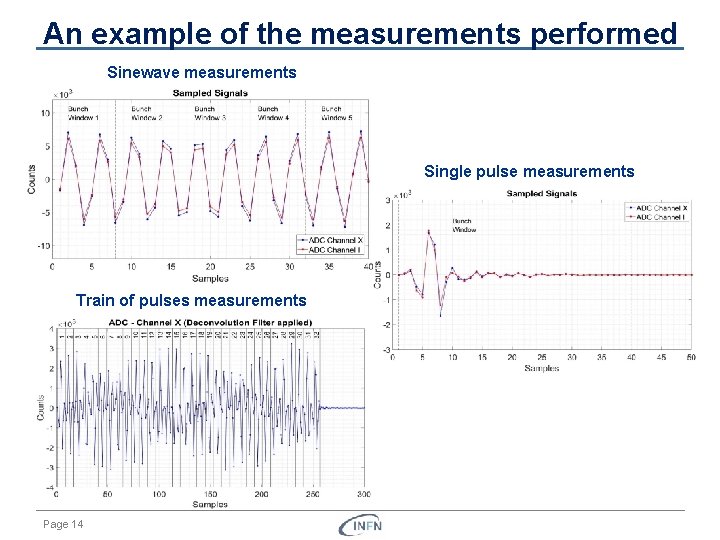
Some of the measurements performed • Calibration of the variable attenuators: Results obtained: if not performed, the variable attenuators could lead to variation of amplitudes of 1 d. B (~12%) • Resolution measurements with sinewave signals. Results obtained: relative standard deviation of 0. 4· 10 3 (0. 4 µm over ± 1 mm) • Resolution measurements with single pulses Results obtained: relative standard deviation of 3· 10 3 (3 µm over ± 1 mm). The resolution is worse than the sinewave case, mainly due to the fact that we were not exploiting all the input available range of the readout electronics. • Resolution measurements with trains of pulses Results obtained: similar values of relative standard deviation as the single pulse case. Bad synchronization between the ADC clock and the bunches could lead to accuracy problems. • Stability over time Results obtained: temperature could lead to amplitude variation of the signals in the order of 5%. Nevertheless the effects on the signals ratio is negligible. CONCLUSIONS: Resolution of 1 µm over ± 1 mm can be achieved, but measurements in presence of the beam are required. Page 13
An example of the measurements performed Sinewave measurements Single pulse measurements Train of pulses measurements Page 14
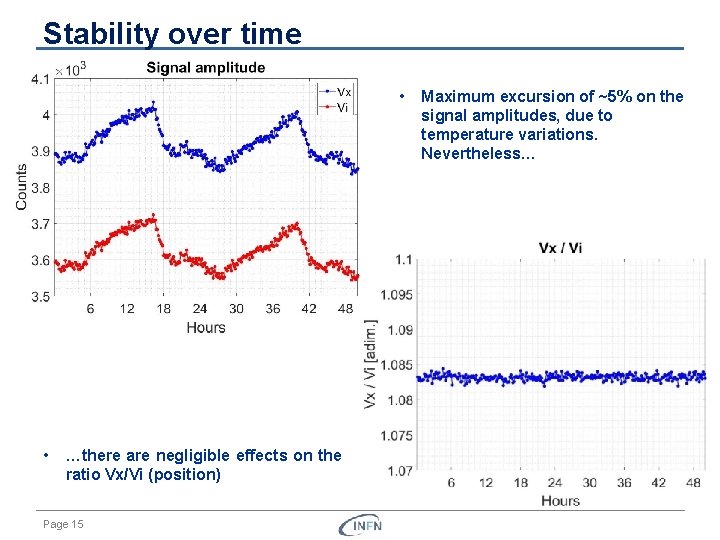
Stability over time • • …there are negligible effects on the ratio Vx/Vi (position) Page 15 Maximum excursion of ~5% on the signal amplitudes, due to temperature variations. Nevertheless…
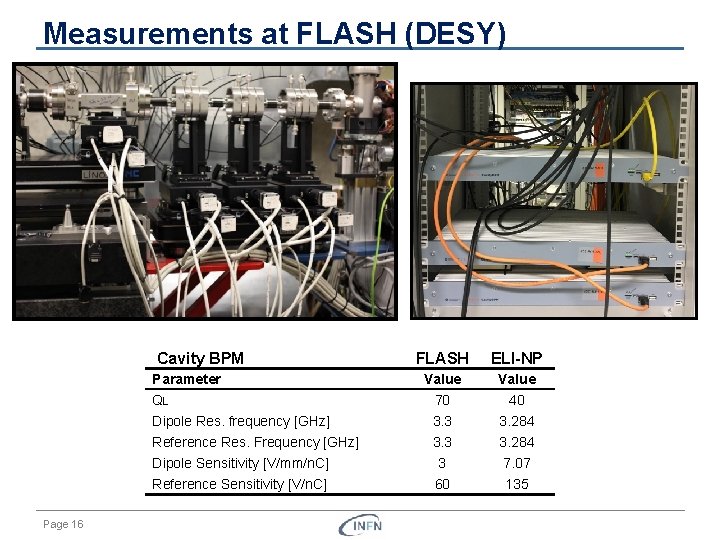
Measurements at FLASH (DESY) Cavity BPM FLASH ELI-NP Value QL 70 40 Dipole Res. frequency [GHz] 3. 3 3. 284 Reference Res. Frequency [GHz] 3. 3 3. 284 Dipole Sensitivity [V/mm/n. C] 3 7. 07 Reference Sensitivity [V/n. C] 60 135 Parameter Page 16
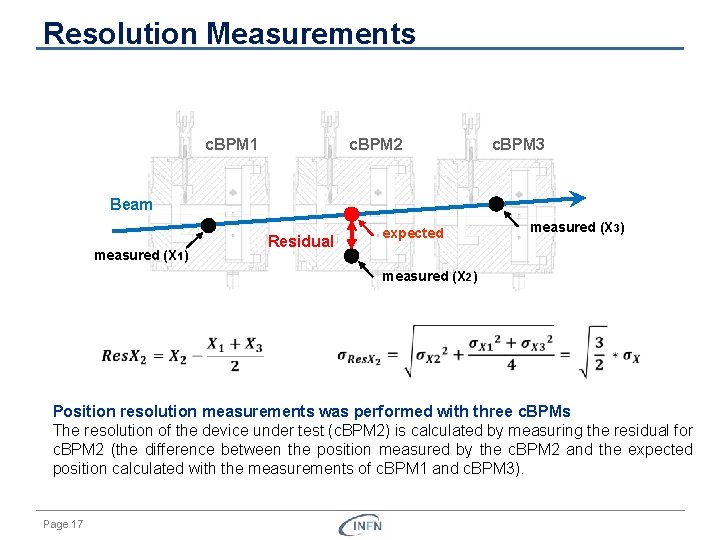
Resolution Measurements c. BPM 1 c. BPM 2 c. BPM 3 Beam measured (X 1) Residual expected measured (X 3) measured (X 2) Position resolution measurements was performed with three c. BPMs The resolution of the device under test (c. BPM 2) is calculated by measuring the residual for c. BPM 2 (the difference between the position measured by the c. BPM 2 and the expected position calculated with the measurements of c. BPM 1 and c. BPM 3). Page 17
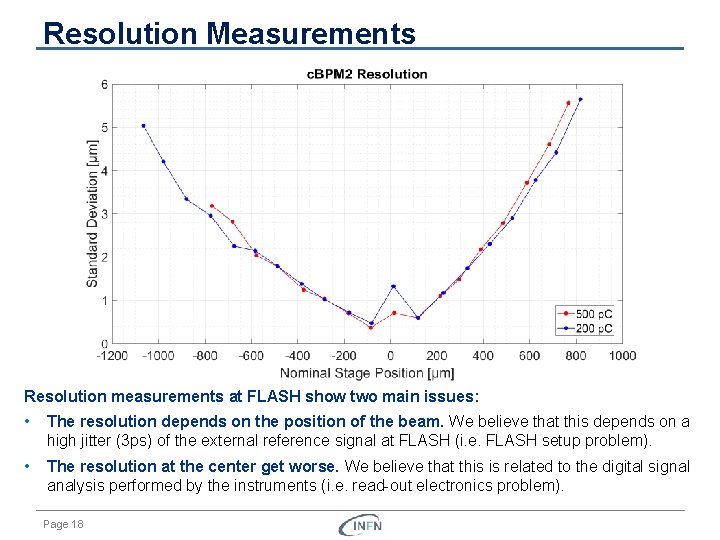
Resolution Measurements Resolution measurements at FLASH show two main issues: • The resolution depends on the position of the beam. We believe that this depends on a high jitter (3 ps) of the external reference signal at FLASH (i. e. FLASH setup problem). • The resolution at the center get worse. We believe that this is related to the digital signal analysis performed by the instruments (i. e. read out electronics problem). Page 18
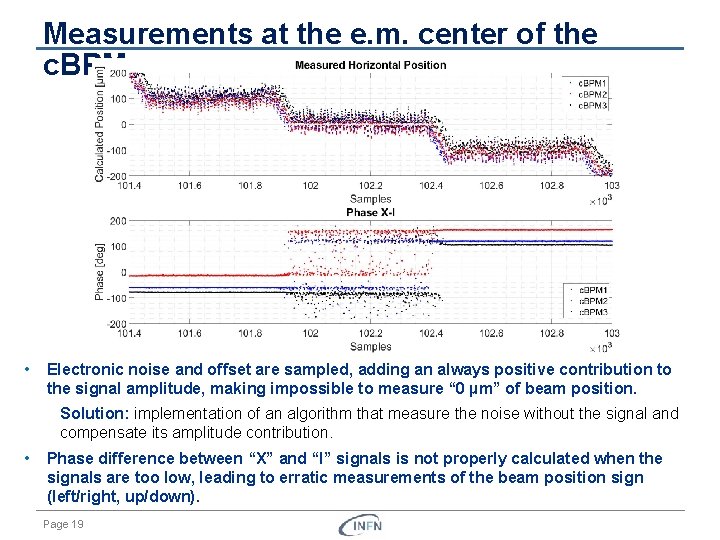
Measurements at the e. m. center of the c. BPM • Electronic noise and offset are sampled, adding an always positive contribution to the signal amplitude, making impossible to measure “ 0 µm” of beam position. Solution: implementation of an algorithm that measure the noise without the signal and compensate its amplitude contribution. • Phase difference between “X” and “I” signals is not properly calculated when the signals are too low, leading to erratic measurements of the beam position sign (left/right, up/down). Page 19
Conclusions on the beam measurements • A resolution as low as 0. 37 µm over a range of ± 1. 3 mm was obtained for beam bunch of 200 p. C and 500 p. C. • Resolution depends on the beam position, which could be justified by taking into accounts jitter / phase noise. The problem is probably related to the reference signal provided to the system and can be addressed with a low jitter reference signal. • Measurements for beam at the e. m. center of the c. BPM are problematic. This issue can be partially compensated with the implementation of an algorithm that compensate the noise contribution on the signal amplitude. • Other measurements (linearity, crosstalk between channels, frequency analysis of the signals, …) were performed and reported on thesis, showing good results for ELI-NP GBS applications. • Further measurements are ongoing at SPARC-LAB, to complete the characterization and to provide a starting point for the design of the diagnostics of the EUPRAXIA linac. Page 20
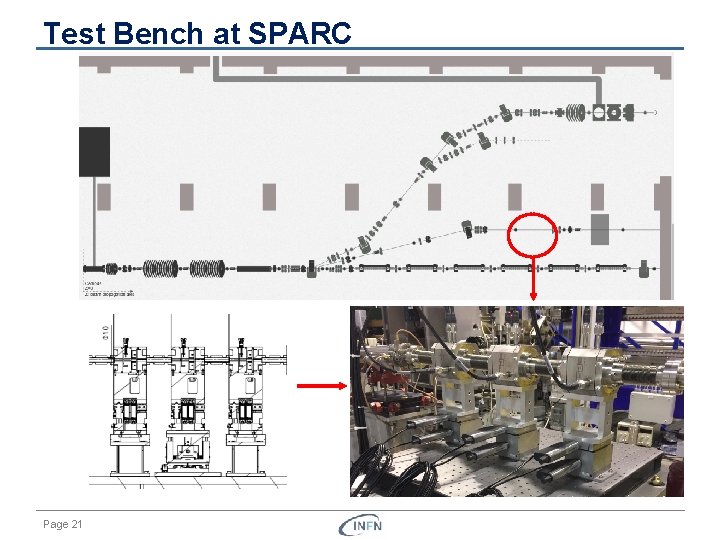
Test Bench at SPARC Page 21

Thank you for your attention!
Spares Page 23
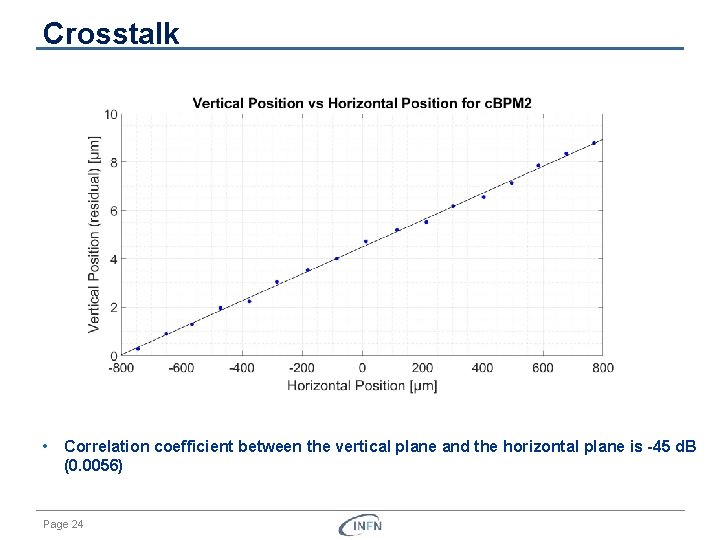
Crosstalk • Correlation coefficient between the vertical plane and the horizontal plane is -45 d. B (0. 0056) Page 24
- Slides: 24