
Lab 8 Fatigue Testing Machine 1 Lab 7
Lab 8: Fatigue Testing Machine 1 Lab 7: Fatigue Testing Machine 10/22/2021

Objective To become familiar with Fatigue Testing Machine. Investigate the effect of the radius of the fillet and surface smoothness. Draw a simple Wöhler diagram 2 Lab 7: Fatigue Testing Machine 10/22/2021
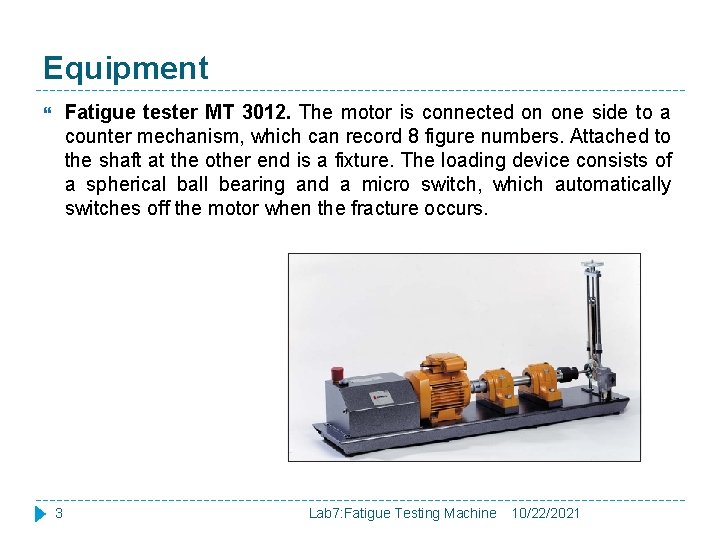
Equipment Fatigue tester MT 3012. The motor is connected on one side to a counter mechanism, which can record 8 figure numbers. Attached to the shaft at the other end is a fixture. The loading device consists of a spherical ball bearing and a micro switch, which automatically switches off the motor when the fracture occurs. 3 Lab 7: Fatigue Testing Machine 10/22/2021
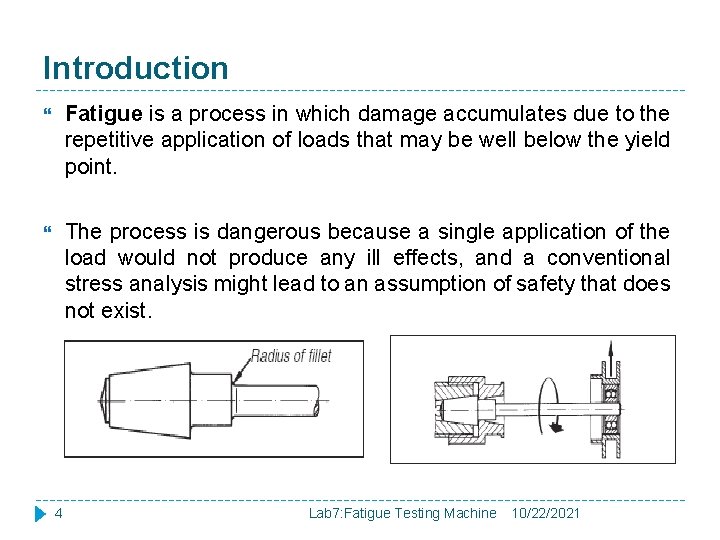
Introduction Fatigue is a process in which damage accumulates due to the repetitive application of loads that may be well below the yield point. The process is dangerous because a single application of the load would not produce any ill effects, and a conventional stress analysis might lead to an assumption of safety that does not exist. 4 Lab 7: Fatigue Testing Machine 10/22/2021

Introduction cont. � Fatigue of materials is a well known situation whereby rupture can be caused by a large number of stress variations at a point even though the maximum stress is less than the proof or yield stress. � The fracture is initiated by tensile stress at a macro or microscopic flaw. Once started the edge of the crack acts as a stress raiser and thus assists in propagation of the crack until the reduced section can no longer carry the imposed load. � While it appears that fatigue failure may occur in all materials, there are marked differences in the incidence of fatigue. For example, mild steel is known to have an 'endurance limit stress' below which fatigue fracture does not occur, this is know as the fatigue limit. 5 Lab 7: Fatigue Testing Machine 10/22/2021
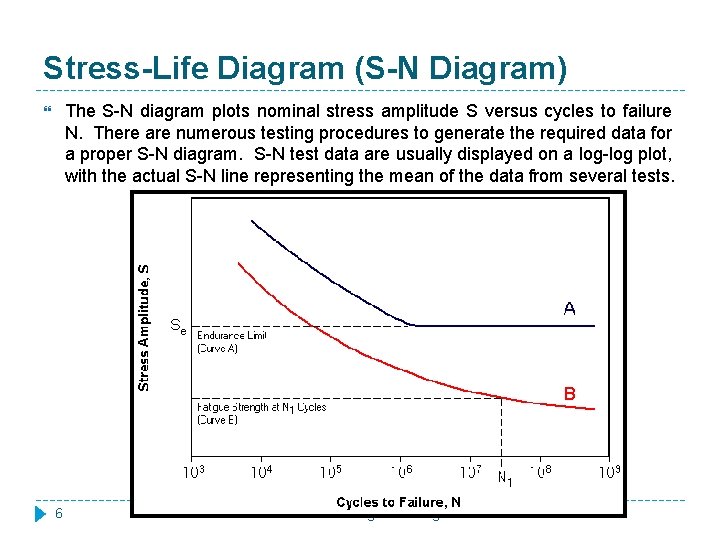
Stress-Life Diagram (S-N Diagram) The S-N diagram plots nominal stress amplitude S versus cycles to failure N. There are numerous testing procedures to generate the required data for a proper S-N diagram. S-N test data are usually displayed on a log-log plot, with the actual S-N line representing the mean of the data from several tests. 6 Lab 7: Fatigue Testing Machine 10/22/2021

Endurance Limit Certain materials have a fatigue limit or endurance limit which represents a stress level below which the material does not fail and can be cycled infinitely. If the applied stress level is below the endurance limit of the material, the structure is said to have an infinite life. This is the characteristic of steel and titanium in benign environmental conditions. The concept of an endurance limit is used in infinite-life or safe stress designs. It is due to interstitial elements (such as carbon or nitrogen in iron) that pin dislocations, thus preventing the slip mechanism that leads to the formation of micro cracks. The endurance limit is not a true property of a material, since other significant influences such as surface finish cannot be entirely eliminated. 7 Lab 7: Fatigue Testing Machine 10/22/2021

Endurance Limit cont. The factors that can affect the endurance limit include: 8 Surface Finish Temperature Stress Concentration Notch Sensitivity Size Environment Reliability Lab 7: Fatigue Testing Machine 10/22/2021
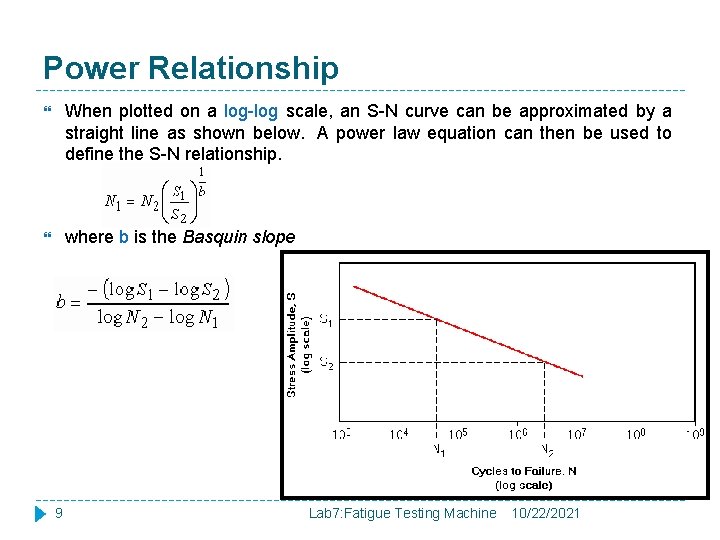
Power Relationship When plotted on a log-log scale, an S-N curve can be approximated by a straight line as shown below. A power law equation can then be used to define the S-N relationship. where b is the Basquin slope 9 Lab 7: Fatigue Testing Machine 10/22/2021
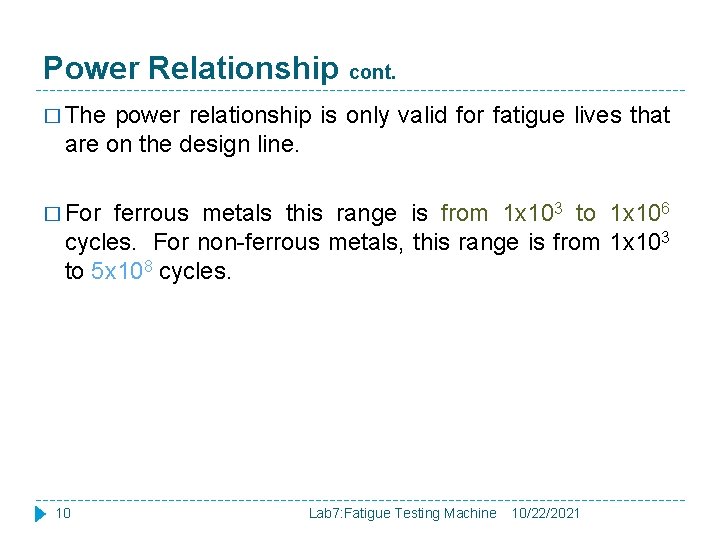
Power Relationship cont. � The power relationship is only valid for fatigue lives that are on the design line. � For ferrous metals this range is from 1 x 10³ to 1 x 10⁶ cycles. For non-ferrous metals, this range is from 1 x 10³ to 5 x 10⁸ cycles. 10 Lab 7: Fatigue Testing Machine 10/22/2021
Effects of Surface Finish, Size, Fillet Radius � Effect of surface finish: The surface of the standard rotating bending specimen is carefully finished by grinding and polishing to remove any circumferential scratches. Most actual parts have a less well finished surface and have a reduced endurance limit as a result. � Effect of size: The probability of finding a bigger flaw increases as the size of components is increased. In part, this leads to a finding that, all other things being equal, larger components have reduced fatigue strength. � Effect of fillet radius: Most components have one or more dimensions which vary greatly from the main dimensions, for example in bearings. Such differences in dimensions create concentration of tension. A material of low fillet radius sensitivity should be selected when dimensioning a component which will be subjected to fatigue stresses. 11 Lab 7: Fatigue Testing Machine 10/22/2021
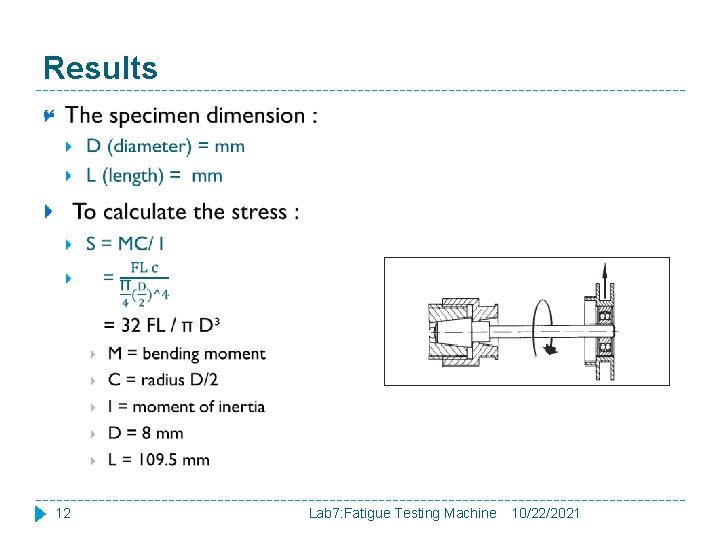
Results 12 Lab 7: Fatigue Testing Machine 10/22/2021
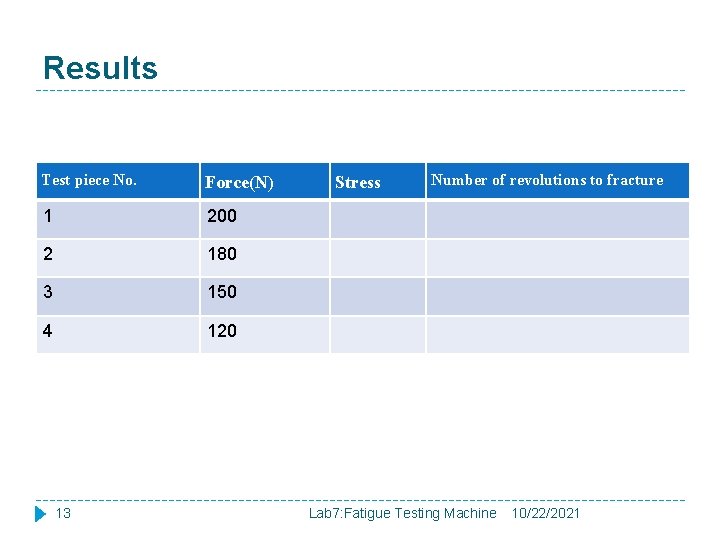
Results Test piece No. Force(N) 1 200 2 180 3 150 4 120 13 Stress Number of revolutions to fracture Lab 7: Fatigue Testing Machine 10/22/2021
- Slides: 13