Lab 2 Quality Assurance in the clinical Lab

Lab 2 Quality Assurance in the clinical Lab

Westgard Rules ¤ There are six basic rules in the Westgard scheme. ¤ These rules are used individually or in combination to evaluate the quality of analytical runs. ¤ Most of the quality control rules can be expressed as NL where N represents the number of control observations to be evaluated and L represents the statistical limit for evaluating the control observations. ¤ Thus 13 s represents a control rule which is manifested when one control observation exceeds the ± 3 s control limits

Rule 13 s ¤ One QC result outside ± 3 s ¤ This rule identifies unacceptable random error or possibly the beginning of a large systematic error.

Rule 12 s ¤ This is a warning rule that is violated when a single control observation is outside the ± 2 s limits. ¤ This rule warns that random error or systematic error may be present in the test system. ¤ Must then evaluate the 13 S rule

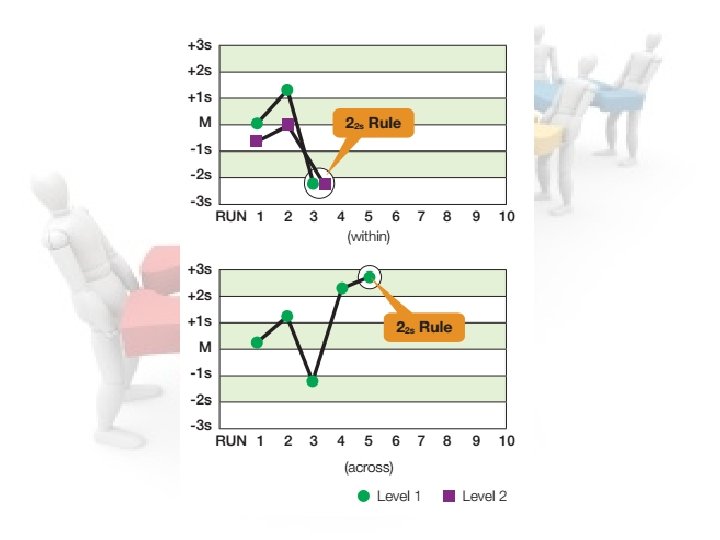
Rule 22 s ¤ This rule identifies systematic error only. ¤ The criteria for this rule are: • Two consecutive QC results Greater than 2 s on the same side of the mean • Or Both controls in the same run exceed ± 2 SD ¤ Patient results cannot be reported. ¤ Requires corrective action

Rule R 4 s ¤ This rule identifies random error only ¤ One control exceeds the mean by – 2 SD, and the other control exceeds the mean by +2 SD ¤ The difference between the two results will therefore exceed 4 SD. ¤ For example, assume both Level I and Level II have been assayed within the current run. Level I is +2. 8 s above the mean and Level II is -1. 3 s below the mean. The total difference between the two control levels is greater than 4 s (e. g. [+2. 8 s – (-1. 3 s)] = 4. 1 s).

Rule 41 s ¤ The criteria which must be met to manifest this rule are: • Four consecutive QC results for one level of control are outside ± 1 SD on the same side of the mean, or • both levels of control have 2 consecutive results that are outside ± 1 SD. ¤ This allows the detection of systemic error

¤ These rules are violated when there are: ¤ Ten consecutive QC results for one level of control are on one side of the mean, or ¤ both levels of control have five consecutive results that are on the same side of the mean (no requirement for SD size). ¤ This allows the detection of systemic error.

If QC is out of control ¤ STOP testing ¤ Identify and correct problem ¤ Repeat testing on patient samples and controls after correction ¤ Do not report patient results until problem is solved and controls indicate proper performance.

Sensitivity ¤ Sensitivity can be defined in two ways. ¤ The first one is the ability of a diagnostic test to detect very ¤ ¤ small amounts of the analyte. The other is the ability of a test to detect truly infected individuals. Sensitivity can be calculated using the following formula: Sensitivity = Total number of true positive results X 100 Total number of infected patients. The greater the sensitivity of a test, the fewer the number of false negative results

Specificity ¤ It is the ability of a method to identify all samples which do not contain the substance being detected (identify non-infected individuals correctly). ¤ Specificity = Total number of true negative results X 100 Total number of uninfected patient ¤ The greater the specificity of a test, the fewer the number of positive results. ¤ For example, Ziehl Neelson staining of false sputum is highly specific for diagnosing pulmonary tuberculosis, because it gives only a few false positive results.

Linearity ¤ Linearity refers to the relationship between measured & expected values over the analytical measurement range ¤ May be considered in relation to actual or relative analyte concentration
 Pre-analytic v. Specimen collection v. Specimen transport v. Specimen quality Analytic")
QUALITY ASSURANCE (QA) Pre-analytic v. Specimen collection v. Specimen transport v. Specimen quality Analytic v. Result accuracy v. Clerical errors v. Analytical errors Post-analytic v. Result reporting v. Record keeping for patient and QC

Control of Pre-analytical Variables Preanalytical variability is defined as errors before the sample reaches the laboratory ¤ Test conducted - appropriate test should be requested & performed ¤ Patient identification - labeling of specimen may be improper; corrected by bar coding ¤ Laboratory logs - entry of patient & test details in lab registers & computers ¤ Transcription errors - from manual entry of data, even when results are double checked; computerization reduces this error

¤ Patient preparation - proper patient preparation is ¤ ¤ essential to obtain meaningful test result Specimen collection - container, anticoagulant, time taken to send specimen to lab, corrected by using vacutainer tubes & collection of samples by lab personnel Specimen Transport - critical for some tests Specimen Separation, aliquoting - monitoring of the performance of the centrifuge, container used for storage Personnel - variation from person to person. Safety precautions for all specimens.

Pre - Analytical Errors ¤ Improper preparation of the patient ¤ Improper collection of the blood sample ¤ Incorrect specimen container ¤ Incorrect specimen storage

Analytical Errors ¤ The sample ¤ Glassware / pipettes / balances ¤ Reagents / calibrators / controls ¤ The application ¤ The instrument

Other Factors ¤ Calculation errors ¤ ¤ – incorrect factor / wrong calibration values Transcription errors Dilutions errors – incorrect dilution or dilution factor used Lack of training The human factor – tiredness / carelessness / stress

Post - Analytical Errors ¤ The prompt and correct delivery of the correct ¤ report on the correct patient to the correct Doctor. How the Clinician interprets the data to the full benefit of the patient.

So 0 o ; ¤ Quality Assurance is internal Quality assessment plus ¤ external Quality assessment Quality Control is achieved through proper documented and validated interventions at Preanalytical, analytical and post analytical stages

Reference ranges of the most common tests Analyte Reference Intervals for Healthy adults* Glucose 70 – 110 mg/dl Cholesterol <200 mg/d. L Triglyceride <250 mg/d. L ALT 13 – 40 IU/L AST 10– 59 U/L Amylase 27– 131 U/L ALP 53 -128 U/L CK 25 – 130 U/L GGT 1 -30 U/L

Ammonia 40 -80 μg/d. L LDH 100– 190 U/L Total Bilirubin 0. 1 -1. 2 mg/d Direct Bilirubin <0. 3 mg/d. L Urea Nitrogen (BUN) 6 -20 mg/d. L Creatinine 0. 6 -1. 3 mg/d. L Uric acid 2. 5 -7. 2 mg/d. L Total protein 6. 4 -8. 3 g/d. L ( 64 -83 g/L ) Albumin 3. 5 -5. 2 g/d. L ( 35 -52 g/L ) Cholinesterase 4. 9– 11. 9 U/m. L Sodium (Na+) 136 -145 mmol/L Potassium (K+) 3. 5 -5. 1 mmol/L Calcium (Ca++) 8. 6 -10. 3 mg/d. L

Thank You
- Slides: 24