LAB 1 THE COMPLETELY RANDOMIZED DESIGN CRD DEFINITION
")
LAB # 1 THE COMPLETELY RANDOMIZED DESIGN (CRD)

DEFINITION Achieved when the samples of experimental units for each treatment are random and independent of each other Design is used to compare the treatment means:

The hypotheses are tested by comparing the differences between the treatment means. • Test statistic is calculated using measures of variability within treatment groups and measures of variability between treatment groups •
 FOR A COMPLETELY RANDOMIZED DESIGN: 1")
STEPS FOR CONDUCTING AN ANALYSIS OF VARIANCE (ANOVA) FOR A COMPLETELY RANDOMIZED DESIGN: 1 - Assure randomness of design, and independence, randomness of samples • 2 - Check normality, equal variance assumptions 3 - Create ANOVA summary table • • 4 - Conduct multiple comparisons for pairs of means as necessary/desired •

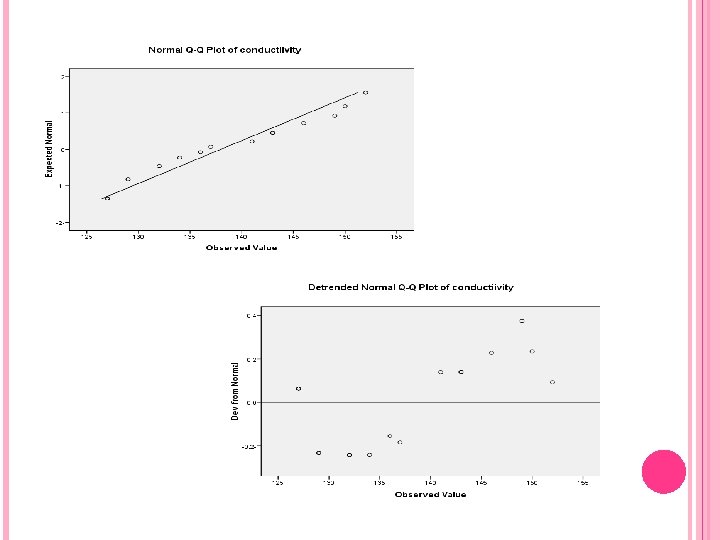
ASSUMPTIONS 1 - Normality: You can check on normality using 1 - plot 2 - Kolmogorve test 2 - Constant variance: You can check on homogeneity of variances using 1 - Plot 2 - leven’s test.

ONE WAY ANOVA

MULTIPLE COMPARISONS OF MEANS A significant F-test in an ANOVA tells you that the treatment means as a group are statistically different. Does not tell you which pairs of means differ statistically from each other With k treatment means, there are c • different pairs of means that can be compared, with c calculated as • •

MULTIPLE COMPARISONS OF MEANS

EXAMPLE 1 A manufacturer of television sets is interested in the effect on tube conductivity of four different types of coating for color picture tubes. The following conductivity data are obtained. Conductivity Coating 1 146 150 141 143 2 143 137 149 152 3 127 132 136 134 4 129 132 127 129

SOLUTION Enter data in spss as follows:

ANALYSIS Tests of Normality Kolmogorov-Smirnova Statistic conductiivity df . 133 Shapiro-Wilk Sig. 16 Statistic. 200* df . 928 Sig. 16 . 230 a. Lilliefors Significance Correction *. This is a lower bound of the true significance. Test of Homogeneity of Variances conductiivity Levene Statistic df 1 2. 370 df 2 3 Sig. 122

ONE WAY ANOVA conductiivity Sum of Squares Between Groups df Mean Square 844. 688 3 281. 562 236. 250 12 19. 688 1080. 938 15 Within Groups Total F Sig. 14. 302 . 000
 coating (J) coating")
Multiple Comparisons Dependent Variable: conductiivity 95% Confidence Interval Mean Difference (I(I) coating (J) coating Tukey HSD 1 2 3 4 J) Std. Error Sig. Lower Bound Upper Bound 2 -. 250 - 3. 137 1. 000 -9. 56 - 9. 06 3 12. 750* 3. 137 . 007 3. 44 22. 06 4 15. 750* 3. 137 . 001 6. 44 25. 06 1 . 250 3. 137 1. 000 -9. 06 - 9. 56 3 13. 000* 3. 137 . 006 3. 69 22. 31 4 16. 000* 3. 137 . 001 6. 69 25. 31 1 -12. 750* 3. 137 . 007 -22. 06 - -3. 44 - 2 -13. 000* 3. 137 . 006 -22. 31 - -3. 69 - 4 3. 000 3. 137 . 776 -6. 31 - 12. 31 1 -15. 750* 3. 137 . 001 -25. 06 - -6. 44 - 2 -16. 000* 3. 137 . 001 -25. 31 - -6. 69 - 3 -3. 000 - 3. 137 . 776 -12. 31 - 6. 31

LSD 1 2 3 4 2 1 3 4 3 1 2 4 4 1 2 3 -. 250 - 3. 137 . 938 -7. 09 - 6. 59 12. 750* 3. 137 . 002 5. 91 19. 59 15. 750* 3. 137 . 000 8. 91 22. 59 . 250 3. 137 . 938 -6. 59 - 7. 09 13. 000* 3. 137 . 001 6. 16 19. 84 16. 000* 3. 137 . 000 9. 16 22. 84 -12. 750* 3. 137 . 002 -19. 59 - -5. 91 - -13. 000* 3. 137 . 001 -19. 84 - -6. 16 - 3. 000 3. 137 . 358 -3. 84 - 9. 84 -15. 750* 3. 137 . 000 -22. 59 - -8. 91 - -16. 000* 3. 137 . 000 -22. 84 - -9. 16 - -3. 000 - 3. 137 . 358 -9. 84 - 3. 84

Thanks for all
- Slides: 16