La fontana della giovinezza Lucas Cranach 1546 EUROPEAN


 %")


 Body fat (%) Age related increase in body fat for normal")


- Slides: 74
La fontana della giovinezza Lucas Cranach, 1546
EUROPEAN MOLECULAR BIOLOGY ORGANIZATION EMBO reports, 2005, 6, n 2, 98 -102 Growing old is not made easier by hucksters and charlatans who sell all kinds of products that claim to alleviate the ageing process or extend life expectancy. The absence of empirical research on the community’s acceptance of, and broader attitudes towards, different types of life extension technology is a crucial gap in this policy debate, and there is a pressing need for interdisciplinary research to examine public assumptions. In the lack of better knowledge, critics and supporters just assume that the general populace will enthusiastically embrace or reject life extension technology—whatever suits their arguments best. There is insufficient evidence to support either claim. It is time that social scientists begin to collect some.
“Io sono fortemente contrario alla morte!”
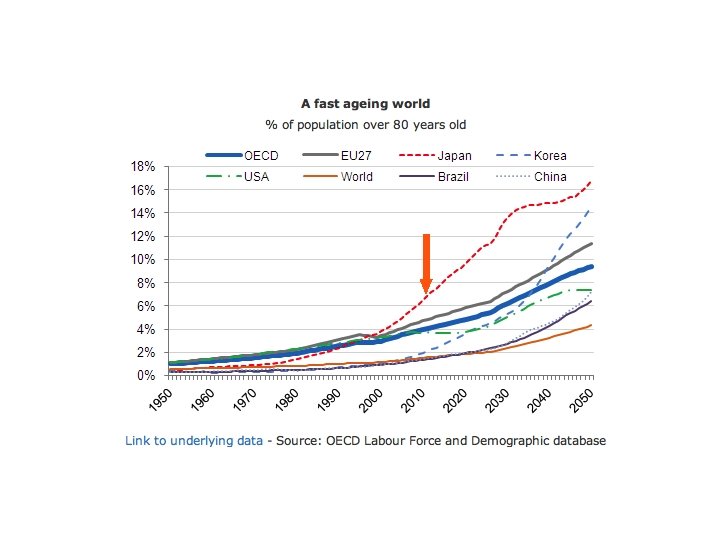
Una delle più importanti conquiste del XX° secolo è lo straordinario guadagno di circa 30 anni di aspettativa di vita che si è configurato in Europa occidentale, Stati Uniti, Canada, Australia, Nuova Zelanda e, ancora più, in Giappone, Spagna e Italia. Se le condizioni generali rimarranno immutate e se l'attuale crescita annuale della speranza di vita continuerà per tutto il XXI° secolo, la maggior parte dei nati dopo il 2000, residenti nei paesi caratterizzati da lunga durata della vita, potranno festeggiare il loro 100° compleanno. Department of Demography at the University of California, Berkeley, USA, Max Planck Institute for Demographic Research in Rostock, Germany
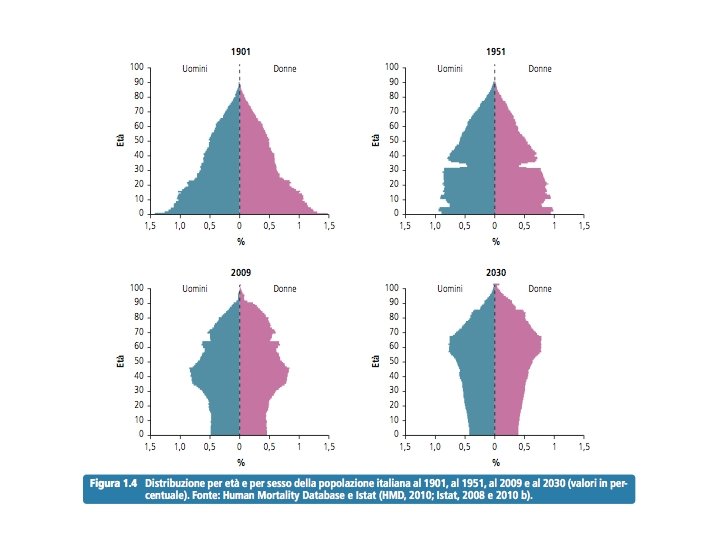
Women and Men: the older they grow the less different they become Graziella Caselli & Marco Marsili - Dipartimento di Scienze Statistiche and Istat, Rome, Italy Women and Men: the older they grow the less different they become 31/12/2021 Slide 6
Età in anni Aspettativa di vita alla nascita in USA 1900 -2000 CDC deaths report, 2010
Età in anni Aspettativa di vita alla nascita in USA 2000 -2008 CDC deaths report, 2010
Modificazioni dell’aspettativa di vita negli USA Anni CDC deaths report, 2010
Speranza di vita alla nascita per sesso e differenza di genere, Italia, 2001 -2010 Istituto Nazionale di Statistica 2011 * stima
Olshansky et al, 2005
Olshansky et al, 2005
Incremento percentuale previsto entro il 2025 in relazione alle fascie di età più avanzate CESD, 1995 160 120 % 80 40 0 >75 >80 >85 >90 anni
Modello di Famiglia Multigenerazionale Bisnonni Nonni Genitori Figlia Unica
Number of countries with 30 per cent ormore of the population aged 60 -plus, 2012 -2050 United Nations Population Fund, 2012
Le tre età dell’uomo Giorgione, 1501
Nuove tipologie di vecchiaia Secondo una consolidata tradizione, l'uomo ha tre periodi principali della vita: infanzia, età adulta e vecchiaia. La vecchiaia sta ora evolvendo in due segmenti: • una terza età (giovane-vecchio < 85 anni) • una quarta età (super-vecchio > 85 anni). Alcuni studi di invecchiamento hanno rivelato che le prospettive di longevità in buona salute sono assai modeste.
Le età dell’uomo • Infanzia-adolescenza < 18 a • Età adulta • Giovane adulto 18 -45 a • Adulto maturo 45 -65 a • Terza età • Giovane-vecchio 65 -75 a • Vecchio 75 -85 a (inizio fragilità) • Quarta età • Super-vecchio > 85 a (fragilità)
Terza età e quarta età Nella terza età, almeno sino ai 75 anni, le funzioni e la consapevolezza sono di solito conservate. La quarta età è generalmente caratterizzata da vulnerabilità fisica, scarsa identità e inadeguata autonomia psichica.
Timing of onset of cognitive decline results from Whitehall II prospective cohort study. Singh-Manoux A, et al, BMJ. 2011 Cognitive decline is already evident in middle age (45 -49 yrs)
NEJM, 2009
Invecchiamento • • sistema cardiovascolare sistema respiratorio sistema digestivo sistema nefro-urinario sistema nervoso centrale sistema osteoarticolare sistema muscolare sistema endocrino
• • Cofattori del fenotipo socio-economico senescente povertà economica povertà dei rapporti sociali trascuratezza nella cura delle parti del corpo più colpite dall'invecchiamento (denti) e nella correzione di difetti sensoriali (udito, vista) carenze alimentari
Principali modificazione farmacocinetiche età-correlate • • • Polifarmacoterapia Prescrizioni inappropriate Posologia e frequenza della terapia Scarsa compliance Cambio della terapia al ricovero e dopo la dimissione • Interazioni farmacologiche • Adverse drug reactions (ADRs) Nobili A et al, 2011
Linda Partridge, Janet Thornton and Gillian Bates The aim of research into ageing is to improve the health of older humans. The reason is that more people are now living long enough to experience the loss of function and diseases of older age. Ageing is the major risk factor for all of the predominant killer diseases, including cardiovascular disease, cancer and neurodegeneration, and the main burden of ill health is now falling on the older section of the population.
L’organismo degli esseri viventi è costituito da una raffinata macchina cibernetica.
OMEOSTASI Proprietà degli organismi viventi di conservare relativamente costanti alcune caratteristiche interne, quali la temperatura, la pressione osmotica ecc. , al variare delle condizioni esterne. Il sistema omeostatico si basa su molteplici componenti, che assieme prendono il nome di meccanismo a feedback.
Threshold for homeostasis Young % % Young Old % Old Physiological Function
Guardiamo l’invecchiamento da una diversa prospettiva Fragilità
Disease Aging Neuroendocrine dysregulation Chronic undernutrition Inadequate intake of protein and energy Senescent muscoskeletal changes Negative energy balance Weight loss Negative nitrogen balance Anorexia of aging Total Energy Expediture CYCLE OF FRAILTY Loss of muscle mass Sarcopenia Resting Metabolic Rate Activity Walking speed Strength & Power VO 2 max Cycle of frailty hypothesized as consistent with demonstrated pairwise associations and clinical signs and symptoms of frailty. Da, Fried et al, 2001, mod.
Composizione corporea • • Utilizzazione energia Comorbilità Polifarmacoterapia Incontinenza Cadute Problemi nutrizionali Osteoporosi Anemia Sarcopenia Omeostasi Neurodegenerazione Fragilità la velocità del cammino l’autonomia il peso corporeo l'attività fisica giornaliera la forza muscolare l'astenia l’equilibrio Ferrucci L, 2010
Disease Aging Senescent muscoskeletal changes Neuroendocrine dysregulation Chronic undernutrition Inadequate intake of protein and energy Negative energy balance Weight loss Negative nitrogen balance Anorexia of aging DISABILITY Loss of muscle mass Total Energy Expediture Sarcopenia Resting Metabolic Rate Activity Walking speed Strength & Power DISABILITY DEPENDENCY From frailty to disability VO 2 max
Prevalence of disability Established Populations for the Epidemiological Study of the Elderly (EPESE) % 100 80 60 Women Men 40 20 0 65 70 75 80 85 90 95 Age Leveille 2000
Prevalenza anziani disabili OCSE, 2011
Proiezione del numero di persone con disabilità ISTAT 2010
Anni vissuti in stato di disabilità in Italia Anni Rapporto WHO sullo stato di salute nel mondo
Burden of disease attributable to 20 leading risk factors for both sexes in 2010, expressed as a percentage of disability-adjusted life-years The negative percentage for alcohol is the protective effect of mild alcohol use on ischaemic heart disease and diabetes Christopher J L Murray, et al, Lancet 2013; 381: 997– 1020
RESEARCH Unhealthy behaviours and disability in older adults Fanny Artaud et al, BMJ 2013; 347: f 4240, 1 -15 What is already known on this topic Some evidence shows that unhealthy behaviours are associated with an increased risk of disability in older people, but their independent contribution to disability remains unclear. Few studies have examined the combined association of unhealthy behaviours with disability, and reverse causation may have contributed to the association in previous studies. The pathways involved in the association between unhealthy behaviours and disability are poorly understood. What this study adds Low physical activity, diet poor in fruit and vegetables, and smoking, were independently associated with an increased hazard of disability. Chronic conditions, as body mass index, depressive symptoms and trauma, partially explained this association. The hazard of disability increased progressively with the number of unhealthy behaviours; people with three unhealthy behaviours had more than a twofold increased hazard of disability. Similar conclusions were reached in analyses restricted to participants who developed disability more than four years after the assessment of behaviours, ruling out reverse causation as a major explanation.
Probability of an additional 20 -year survival to age 90 years for a 70 -year-old man, according to the presence of 0 to 5 modifiable adverse factors at baseline (smoking, diabetes, obesity, hypertension, and sedentary lifestyle) or their common clustering Yates, L. B. et al. Arch Intern Med 2008; 168: 284 -290.
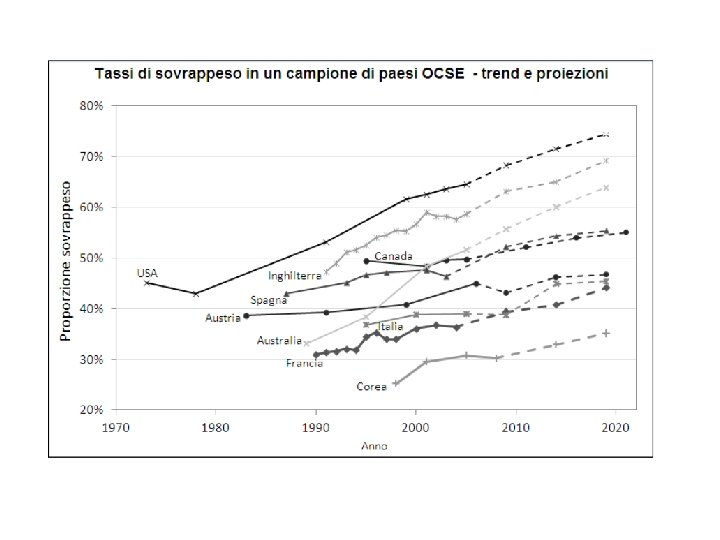
“Guardando fuori dalla finestra, si può vedere un minaccioso temporale - l'obesità - che, se non è affrontata, ha un effetto negativo sulla speranza di vita” Olshansky SJ et al, 2005
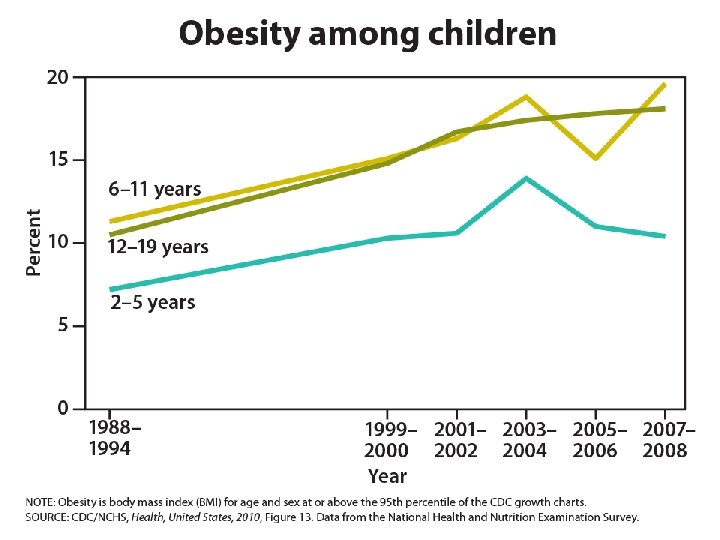
1980 to 2008 trends in the prevalence of overweight and obesity, by sex, were estimated for 199 countries and territories. Globally, the prevalence of overweight and obesity has increased since 1980. Moreover, the rise in obesity has accelerated in the last decade. This documentation of country trends in obesity prevalence may be used to set targets as requested by the United Nations General Assembly's High-Level Meeting on the Prevention and Control of Noncommunicable Diseases.
Change in the age-standardized prevalences of obesity and overweight in many regions of the world for male and female adults ≥ 20 years, percentage points per decade. The absolute change in prevalence is shown, rather than a relative change in the prevalence of obesity-overweight. Stevens et al. Population Health Metrics 2012, 10: 22
Effects of obesity and smoking on life expectancy 1 - Prospective Studies Collaboration, Lancet, 2009 2 - Doll R, BMJ, 2004 Richard Peto, F. R. S et al, NEJM, 2010
Disability risk with ageing in relation to relative class of BMI risk 0. 35 High risk-BMI >30 0. 25 Disability 0. 20 Index Moderate risk BMI 25 -30 0. 15 * 0. 10 Low risk-BMI <25 0. 00 63 65 68 70 72 74 76 78 Age (years) * Cut off of disability Vita et al. , 1998
Scenarios for Change in Population Burden of Disability from 1990 to 2040 Disability-Free Life Expectancy 1990 78. 8. years Scenario 1: Stable Population Morbidity 2040 85. 0 years Scenario 2: Compression of Morbidity 2040 85. 0 years Scenario 3: Expansion of Morbidity 2040 85. 0 years Years of life free of disability (Active life expectancy) Years disabled (Disabled life expectancy) Guralnik J, et al. New Engl J Med 1993; 329: 110.
Lancet 2012; 380: 2144– 62 As life expectancy has increased, the number of healthy years lost to disability has also increased in most countries, consistent with the expansion of morbidity hypothesis, which has implications for health planning and health-care expenditure. Compared with substantial progress in reduction of mortality over the past two decades, relatively little progress has been made in reduction of the overall effect of non-fatal disease and injury on population health.
Invecchiamento e composizione corporea
Body weight (kg) Body fat (%) Age related increase in body fat for normal males at constant BMI Age (years) Prentice AM & Jebb SA, 2001
Modificazioni percentuali di BMI, grasso corporeo e massa muscolare in relazione all’età Uomini 60 Grasso 40 differenza % Donne Grasso 20 BMI 0 -20 Massa muscolare -40 Massa muscolare -60 30 40 50 60 70 80 90 30 40 Età (anni) 50 60 70 80 90 100
Diagram of age-associated changes in fat distribution Fat mass reaches a peak by middle or early old age, followed by a substantial decline in advanced old age. Aging causes a loss of subcutaneous fat (peripherally first and then centrally), accumulation of visceral fat, and ectopic fat deposition (in muscle, liver, bone marrow, and elsewhere). White circles = subcutaneous fat Red circles = visceral fa Orange circles = fat in non adipose tissue Cartwright M J et al, 2007
Invecchiamento del sistema muscolare • Atrofia delle fibre muscolari con aumento del tessuto connettivo e adiposo all’interno del muscolo. • Conversione delle fibre muscolari “fast” tipo II in fibre “slow” di tipo I, con perdita della potenza muscolare necessaria per le attività della vita quotidiana: alzarsi da una sedia o salire le scale. • Diminuzione della forza muscolare con riduzione del grado di autonomia. • Riduzione della capacità di mantenimento dell’equilibrio con aumento del rischio di cadute e fratture. Stephan von Haehling et al, 2012
Age-related decreases in thigh muscle area, knee extensor strenght, and aerobic capacity in 78 healthy persons Nair KS, Am J Clin Nutr 2005
SARCOPENIA • La riduzione della massa muscolare, tale da compromettere in maniera significativa le funzioni cui è fisiologicamente deputata, costituisce aspetto cruciale dell’invecchiamento. • La sarcopenia ha rilevanti effetti extramuscolari: contribuisce all’osteoporosi, alla riduzione delle capacità termoregolatorie, all’alterazione della composizione corporea e alla compromissione dell’omeostasi glucidica.
Obesity acts sinergistically with sarcopenia maximizing clinical consequences = Sarcopenic obesity
Sarcopenic obesity predicts survival and time to drop in IADL in the elderly Survival Baumgartner et al, 2004 years Mean (SD) years to IADL drop SO 1. 5 (1. 1) - S 2. 3 (2. 0) - O 2. 1 (1. 7) - N 2. 4 (1. 8)
Knoops KT et al, 2004 The lifestyle score was calculated by adding the individual scores for diet, physical activity level, smoking status, and alcohol intake. Individuals scored 1 point if they belonged to the low-risk group for diet or a particular lifestyle factor and 0 if they belonged to the high-risk group.
Kaplan-Meier Survival in Validation Cohort by Selected Risk Points The primary predictor a 12 -item mortality index • • • • • ages 60 -64 years: 1 point, ages 65 -69 years: 2 points, ages 70 -74 years: 3 points, ages 75 -79 years: 4 points, ages 80 -84 years: 5 points, ages >85 years: 7 points; male sex: 2 points; current tobacco use: 2 points; body mass index >25: 1 point; diabetes: 1 point; nonskin cancers: 2 points; chronic lung disease: 2 points; heart failure: 2 points; difficulty bathing: 2 points; difficulty managing finances: 2 points; difficulty walking several blocks: 2 points; difficulty pushing/pulling large objects: 1 point. Marisa Cruz, et al, JAMA, 2013
Kaplan-Meier Survival in Validation Cohort by Selected Risk Points Marisa Cruz, et al, JAMA, March 6, 2013—Vol 309, No. 9, 875 -7
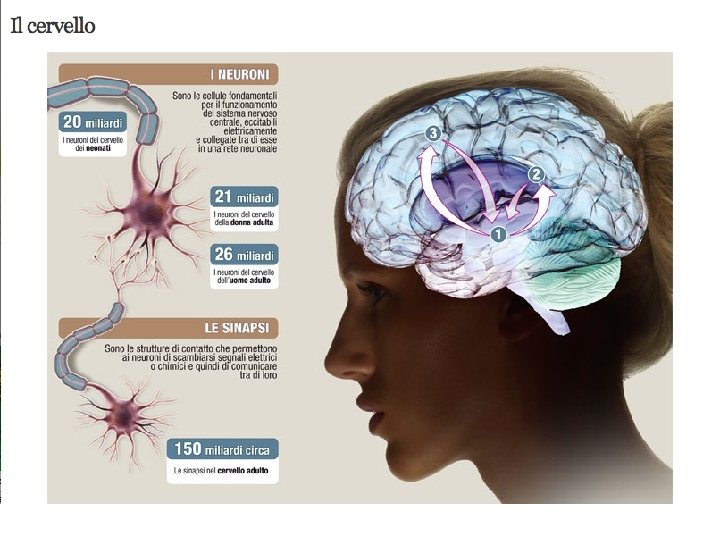
La produzione di nuovi neuroni da cellule staminali è importante per la funzione cognitiva: la riduzione della neurogenesi durante l’invecchiamento del cervello può contribuire all'accumulo di deficit cognitivi correlati all'età. Il controllo dell’apporto calorico può aumentare il numero di divisioni delle staminali neurali e delle cellule progenitrici nel cervello dei topi adulti durante l’invecchiamento.
La parabola vital: Evidence-based demonstration per NON trattare gli anziani diversamente… Ganar dinero Tener sexo Poder conducir Tener amigos No orinarse la ropa 80 Anos 90 Anos 75 Anos 70 Anos 60 Anos 50 Anos 35 Anos 20 Anos 18 Anos 12 Anos 4 Anos Conseguir caminar
In conclusione: I vecchi di oggi sono stati giovani, e molti lo sono fino alla morte. I giovani di oggi sono i vecchi di domani, e un buon medico deve aiutare i pazienti a rimanere giovani. Nell’ambito del buon senso e del rispetto per la vita, e della morte, non vi sono ragioni per trattare i pazienti anziani meno accuratamente dei giovani, anzi, essi richiedono cure più tempestive, accorte e delicate.
One year mortality Rubenstein et al, 1984
Location discharge at 12 months Rubenstein et al, 1984
Fig 2 Functional decline at discharge from hospital in randomised trials comparing acute geriatric units with conventional hospital care Baztan, J. J et al. BMJ 2009; 338: b 50 Copyright © 2009 BMJ Publishing Group Ltd.
Invecchiamento, longevità, fragilità • La fragilità sembra essere la tassa che la specie umana paga per la longevità • Il paziente anziano fragile deve essere gestito con metodologie geriatriche • La valutazione multidimensionale è una metodologia insostituibile.
Michigan Wayne University Study Durata della vita - Anni 1952 -1999
Sorridere allunga la vita