
L and T Dwarfs Often Brilliant Astronomers Find
L and T Dwarfs* Often Brilliant Astronomers Find Great Knowledge Meeting Late Together • • • History of discovery Spectral types/properties Interiors of low mass stars Evolution of low mass stars Photospheres of low mass stars *Discussion and figures taken from Reid and Hawley’s New Light on Dark Stars, 2000
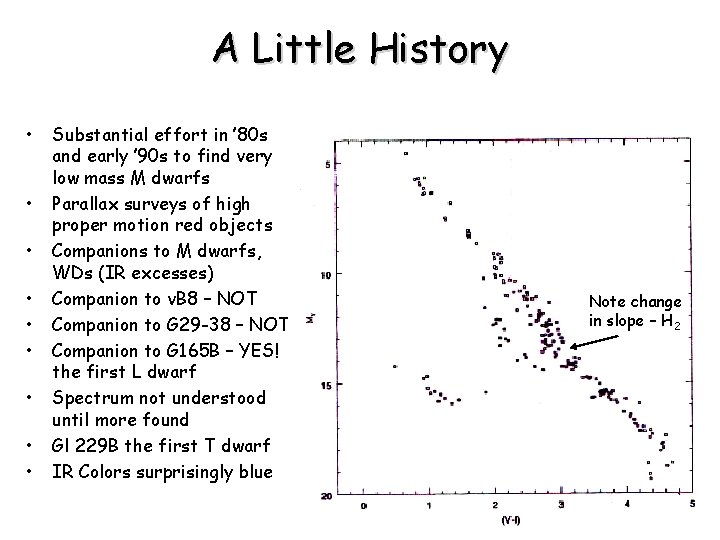
A Little History • • • Substantial effort in ’ 80 s and early ’ 90 s to find very low mass M dwarfs Parallax surveys of high proper motion red objects Companions to M dwarfs, WDs (IR excesses) Companion to v. B 8 – NOT Companion to G 29 -38 – NOT Companion to G 165 B – YES! the first L dwarf Spectrum not understood until more found Gl 229 B the first T dwarf IR Colors surprisingly blue Note change in slope – H 2
Brown Dwarfs Abound! • • • Many L and T dwarfs have now been found – – Improved IR detectors Better spatial resolution (seeing improvements, AO) IR and multi-color surveys (2 MASS, DENIS, and Sloan) Breakthrough in understanding appearance of spectra Significant progress in modeling low mass stellar and substellar objects Understood in the late ’ 50 s (Limber) that – low mass stars must be fully convective – Electron degeneracy must play a role – H 2 formation also important (change in slope of main seq. at 0. 5 MSun) Kumar figured out (in the early ’ 60 s) that a minimum mass is needed for H burning Grossman et al. included deuterium burning (early ’ 70 s) Recent improvements include better equation of state and grain formation
Minimum Mass for H Burning • • As protostar collapses, core temperature rises Low mass stars must collapse to higher densities before temperature high enough for fusion As density increases, core becomes partially degenerate An increasing fraction of energy from collapse goes into compressing degenerate gas Degeneracy stops star from collapsing below 0. 1 RSun (and the core temperature can’t get any higher than this) What happens to the star? – If M>0. 09 MSun, core fusion is possible and sustainable for many Hubble times – For 0. 08 -0. 085 MSun, degeneracy lowers central temperature, but it’s still hot enough for hydrogen fusion (main sequence) – At 0. 075 Msun, core temperature is initially hot enough, but degeneracy cools the core and fusion stops – “transition object” – For lower masses (M<0. 07 MSun), the core is never hot enough for fusion, brown dwarf cools to oblivion Stellar mass limit somewhere between transition object and brown dwarf
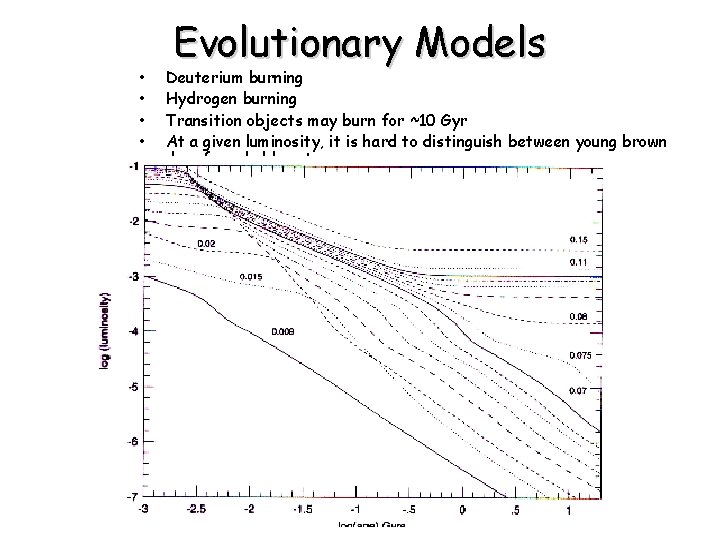
• • Evolutionary Models Deuterium burning Hydrogen burning Transition objects may burn for ~10 Gyr At a given luminosity, it is hard to distinguish between young brown dwarfs and older stars
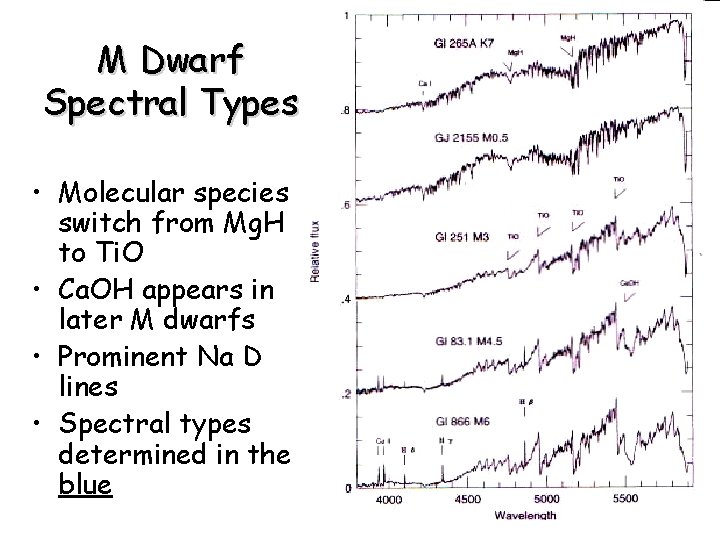
M Dwarf Spectral Types • Molecular species switch from Mg. H to Ti. O • Ca. OH appears in later M dwarfs • Prominent Na D lines • Spectral types determined in the blue
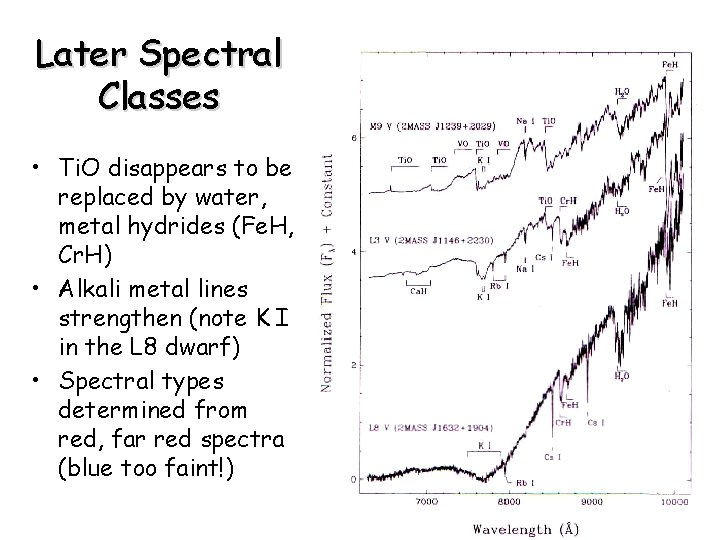
Later Spectral Classes • Ti. O disappears to be replaced by water, metal hydrides (Fe. H, Cr. H) • Alkali metal lines strengthen (note K I in the L 8 dwarf) • Spectral types determined from red, far red spectra (blue too faint!)

L-type Spectral Sequence • K I line strength increases with later spectral type • Li I appears in some low mass stars (m < 0. 06 solar masses) • Appearance of Fe. H, Cr. H • Strength of Ca I • Strength of water • Disappearance of Ti. O • Absence of Fe. H, Cr. H in T dwarf, much increased strength of water
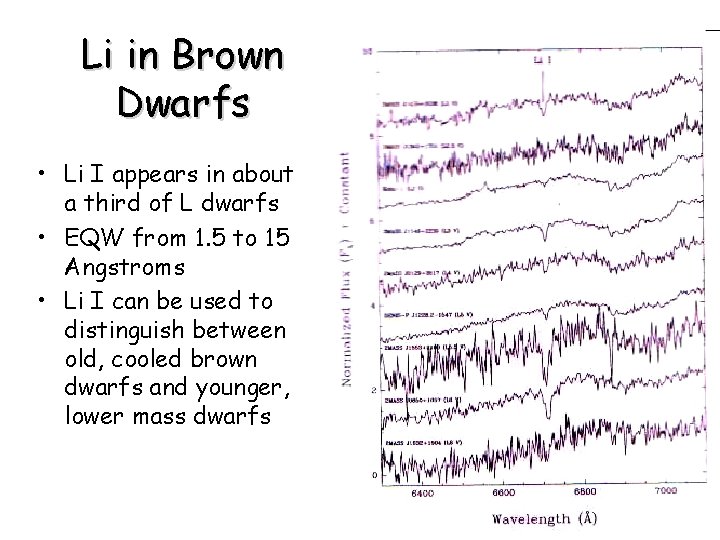
Li in Brown Dwarfs • Li I appears in about a third of L dwarfs • EQW from 1. 5 to 15 Angstroms • Li I can be used to distinguish between old, cooled brown dwarfs and younger, lower mass dwarfs
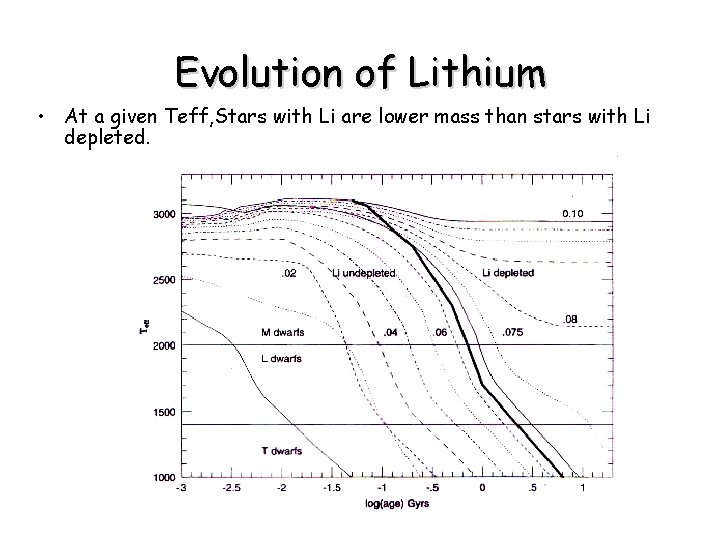
Evolution of Lithium • At a given Teff, Stars with Li are lower mass than stars with Li depleted.
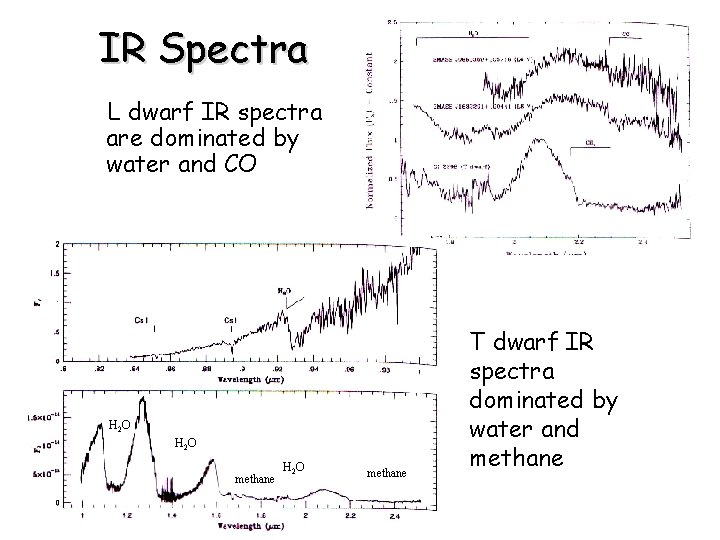
IR Spectra L dwarf IR spectra are dominated by water and CO H 2 O methane T dwarf IR spectra dominated by water and methane
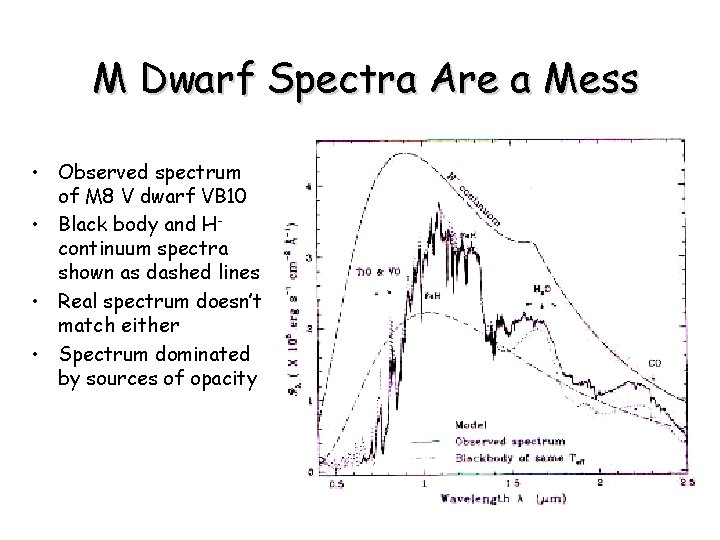
M Dwarf Spectra Are a Mess • Observed spectrum of M 8 V dwarf VB 10 • Black body and Hcontinuum spectra shown as dashed lines • Real spectrum doesn’t match either • Spectrum dominated by sources of opacity
Opacities • Bound-bound opacities – molecules – – Ti. O, Ca. H + other oxides & hydrides in the optical H 2 O, CO in the IR ~109 lines! Bound-bound molecular line opacities dominate the spectrum • Bound-free opacities • • Free-free opacities – Thomson and Rayleigh scattering In metal-poor low mass stars, pressure induced absorption of H 2 H 2 is important in the IR (longer than 1 micron) H 2 molecules have allowed transitions only at electric quadrupole and higher order moments, so H 2 itself is not significant Also significant van der Waals collisional (pressure) broadening of atomic and molecular lines, making these lines much stronger than they would otherwise be At even cooler temperatures (T~1500 -1200) CO is depleted by methane formation (CH 3) – the transition from L to T dwarfs • • • – Atomic ionization, molecular dissociation
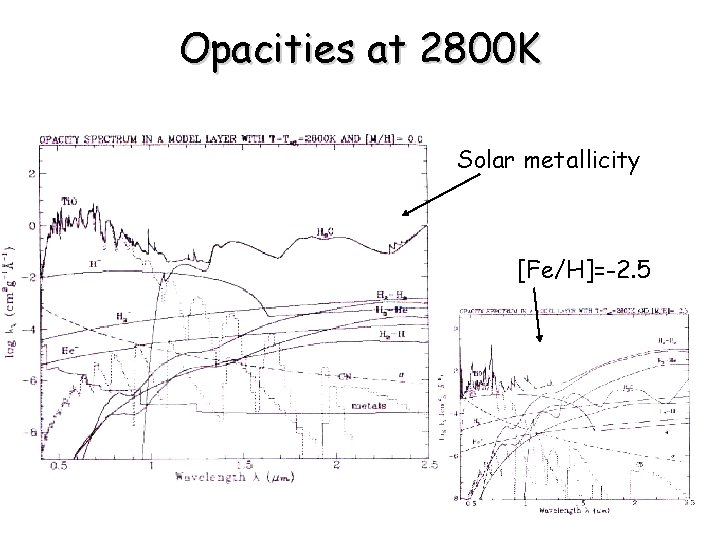
Opacities at 2800 K Solar metallicity [Fe/H]=-2. 5
Stellar Models • General assumptions include – Plane parallel geometry – Homogeneous layers – LTE • Surface gravities: log g ~ 5. 0 • Convection using mixing length • Convection is important even at low optical depth (t<0. 01) • Strength of water absorption depends on detailed temperature structure and treatment of convection • For Teff < 3000 K, grains become important in atmospheric structure (scattering)
Dust • Dust formation is important in M, L, and T dwarfs • Depletes metals, including Ti • Dust includes • • • Corundum (Al 2 O 3) Perovskite (Ca. Ti. O 3), condensing at T < 2300 -2000 K Iron (Fe) VO, condensing at T < 1900 -1700 K Enstatite (Mg. Si. O 3) Forsterite (Mg 2 Si. O 4) • Double-metal absorbers weaken (VO, Ti. O) • Hydride bands dominate • Dust opacity causes greenhouse heating – outgoing IR radiation trapped by extra dust-grain opacity • Heating dissociates H 2 O, giving weaker water bands • Dust settles gravitationally, depleting metals and leaving reduced opacities (time scales unclear) • Dusty models fit observed flux distributions better
Alkali Lines • Alkali lines very prominent in L dwarf spectra (Li, Na, K, Cs, Rb) • Strong because of very low optical opacities – Ti. O, VO are gone – Dust formation also removes primary electron donors, so H- and H 2 - opacities are also reduced – High column density due to low optical opacity leads to very strong lines • K I lines at 7665 and 7699 A have EQWs of several hundred Angstroms • Na D lines also become very strong
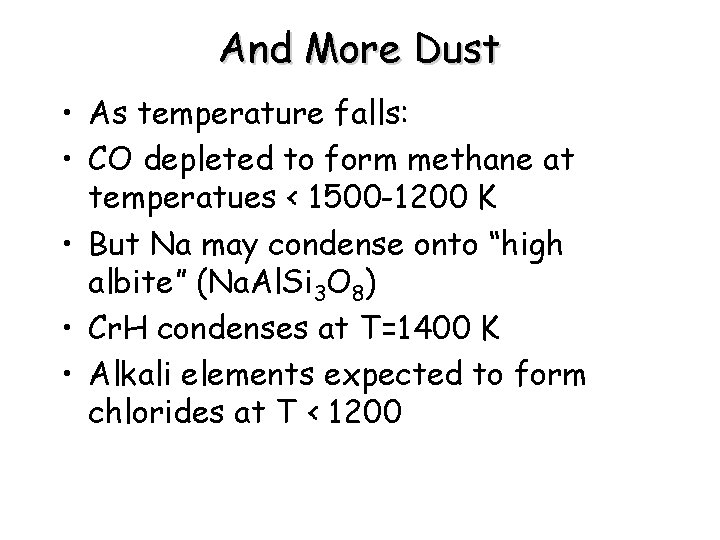
And More Dust • As temperature falls: • CO depleted to form methane at temperatues < 1500 -1200 K • But Na may condense onto “high albite” (Na. Al. Si 3 O 8) • Cr. H condenses at T=1400 K • Alkali elements expected to form chlorides at T < 1200
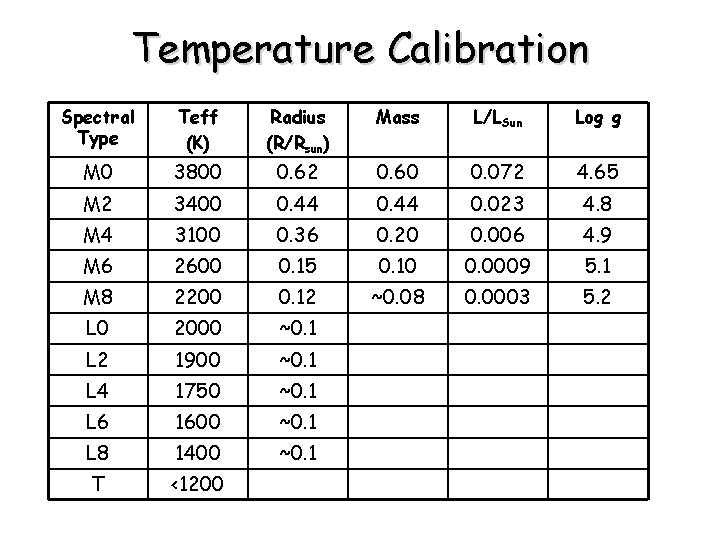
Temperature Calibration Spectral Type Teff (K) Radius (R/Rsun) Mass L/LSun Log g M 0 3800 0. 62 0. 60 0. 072 4. 65 M 2 3400 0. 44 0. 023 4. 8 M 4 3100 0. 36 0. 20 0. 006 4. 9 M 6 2600 0. 15 0. 10 0. 0009 5. 1 M 8 2200 0. 12 ~0. 08 0. 0003 5. 2 L 0 2000 ~0. 1 L 2 1900 ~0. 1 L 4 1750 ~0. 1 L 6 1600 ~0. 1 L 8 1400 ~0. 1 T <1200
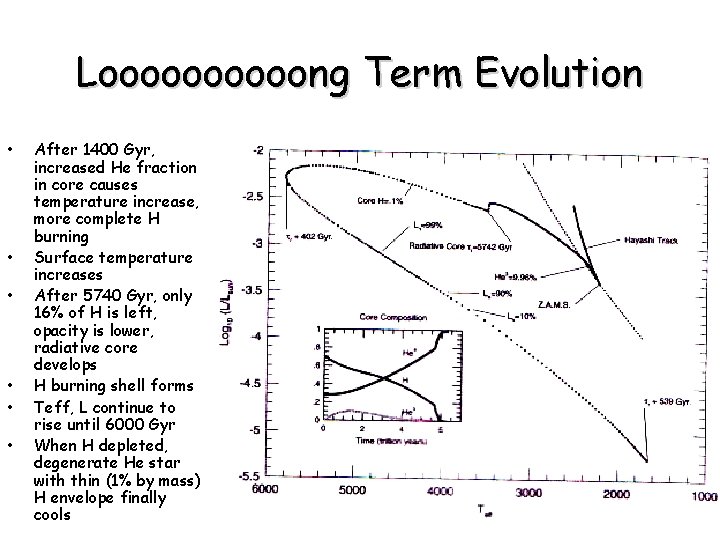
Looooong Term Evolution • • • After 1400 Gyr, increased He fraction in core causes temperature increase, more complete H burning Surface temperature increases After 5740 Gyr, only 16% of H is left, opacity is lower, radiative core develops H burning shell forms Teff, L continue to rise until 6000 Gyr When H depleted, degenerate He star with thin (1% by mass) H envelope finally cools
- Slides: 20