KW GPS Graphic Library International Real Estate Stats

KW GPS Graphic Library

International Real Estate Stats

This breaks down to approximately 1 out every 12 homes sold in the US is an International Transaction! * NAR Profile of International Home Buying Activity

Breakdown of International Transactions

Where are they buying? Source: NAR, 2013 Profile of International Home Buying Activity

Mean Price Source: NAR, 2014 Profile of International Home Buying Activity

U. S. residential property sales to international buyers, ranked by top countries in 2014 in billions* China $22. 0 Argentina/Brazil $4. 1 Canada $13. 8 France $3. 3 India $5. 8 Germany $3. 3 UK $5. 8 Japan $0. 8 Mexico $4. 5 Russia $0. 8 *Source: National Association of Realtors

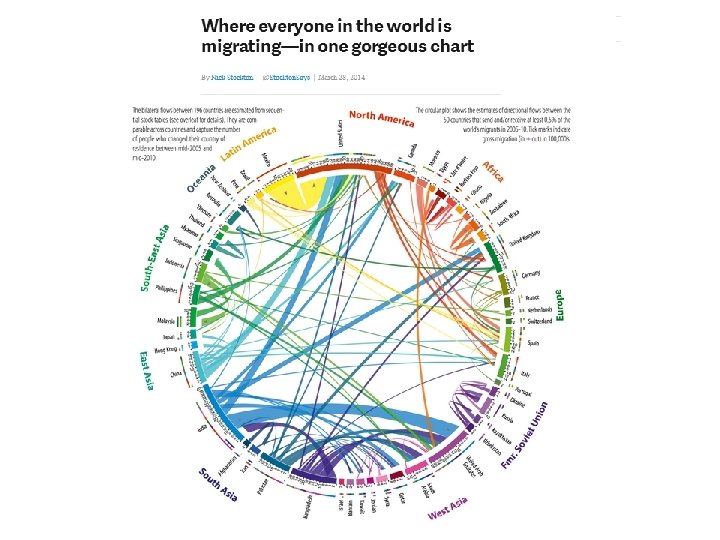
Where they are coming from Source: NAR, 2014 Profile of International Home Buying Activity

Resources • NAR – Annual Profile of International Home Buying Activity – Realtor. Org • NAR – State by State Reports - Realtor. Org • AFIRE – Association of Foreign Investment in Real Estate --http: //www. afire. org/ • Institute of International Education – Open Doors Data – State by State http: //www. iie. org/ 3/6/2021 11

* NAR Profile of International Home Buying Activity

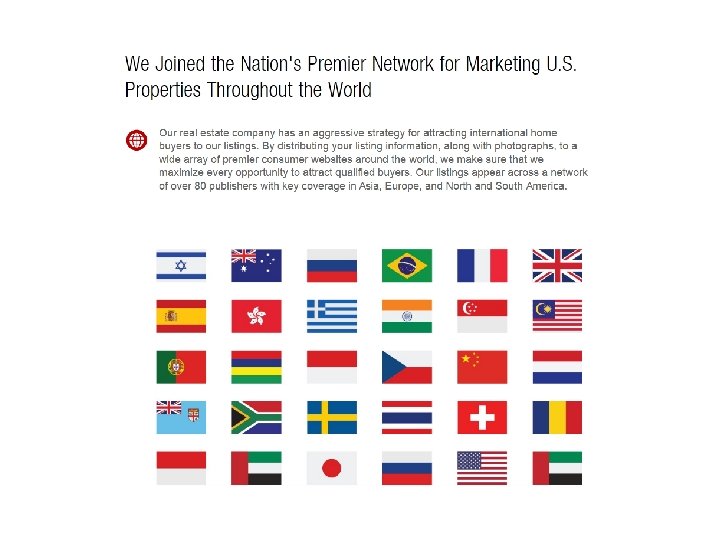
Listhub Global

Listhub Global Syndication Portals

Listhub Global Syndication Portals - Continued

Listhub Global Syndication Portals - Continued

Listhub Global Portal List

Proxio - Graphics


Proxio - Graphics
- Slides: 21