
Kuwaitization A Mirage or Reality Lubna AlKazi Ph
Kuwaitization: A Mirage or Reality Lubna Al-Kazi, Ph. D. Kuwait University
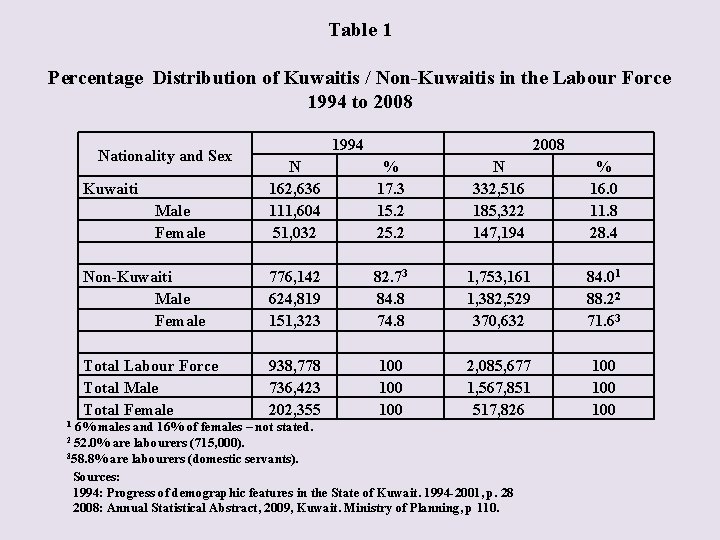
Table 1 Percentage Distribution of Kuwaitis / Non-Kuwaitis in the Labour Force 1994 to 2008 Nationality and Sex 1994 2008 Male Female N 162, 636 111, 604 51, 032 % 17. 3 15. 2 25. 2 N 332, 516 185, 322 147, 194 % 16. 0 11. 8 28. 4 Non-Kuwaiti Male Female 776, 142 624, 819 151, 323 82. 73 84. 8 74. 8 1, 753, 161 1, 382, 529 370, 632 84. 01 88. 22 71. 63 Total Labour Force Total Male Total Female 938, 778 736, 423 202, 355 100 100 2, 085, 677 1, 567, 851 517, 826 100 100 Kuwaiti 1 6% males and 16% of females – not stated. are labourers (715, 000). 358. 8% are labourers (domestic servants). Sources: 1994: Progress of demographic features in the State of Kuwait. 1994 -2001, p. 28 2008: Annual Statistical Abstract, 2009, Kuwait. Ministry of Planning, p 110. 2 52. 0%
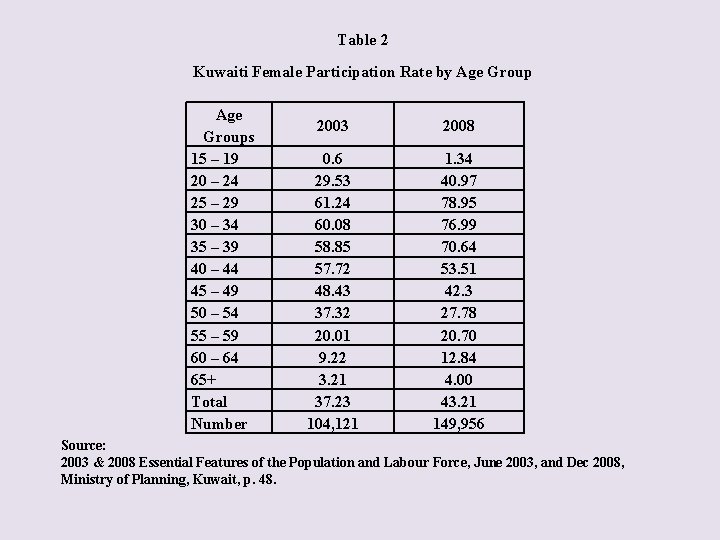
Table 2 Kuwaiti Female Participation Rate by Age Groups 15 – 19 20 – 24 25 – 29 30 – 34 35 – 39 40 – 44 45 – 49 50 – 54 55 – 59 60 – 64 65+ Total Number 2003 2008 0. 6 29. 53 61. 24 60. 08 58. 85 57. 72 48. 43 37. 32 20. 01 9. 22 3. 21 37. 23 104, 121 1. 34 40. 97 78. 95 76. 99 70. 64 53. 51 42. 3 27. 78 20. 70 12. 84 4. 00 43. 21 149, 956 Source: 2003 & 2008 Essential Features of the Population and Labour Force, June 2003, and Dec 2008, Ministry of Planning, Kuwait, p. 48.
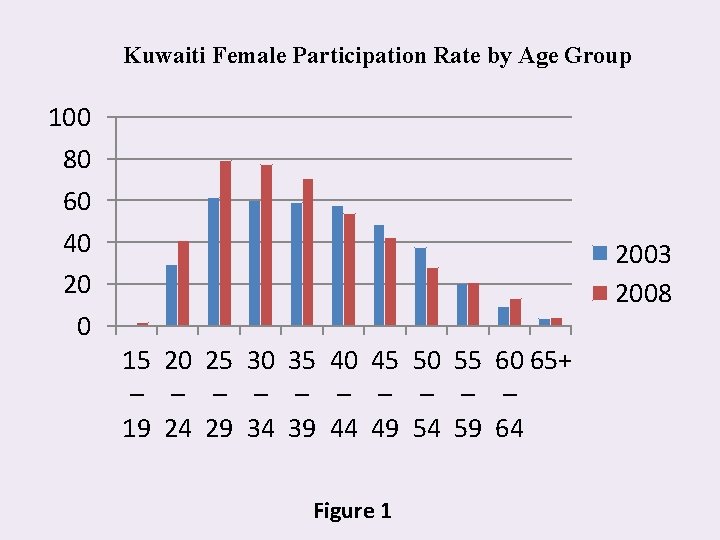
Kuwaiti Female Participation Rate by Age Group 100 80 60 40 2003 2008 15 20 25 30 35 40 45 50 55 60 65+ – – – – – 19 24 29 34 39 44 49 54 59 64 Figure 1
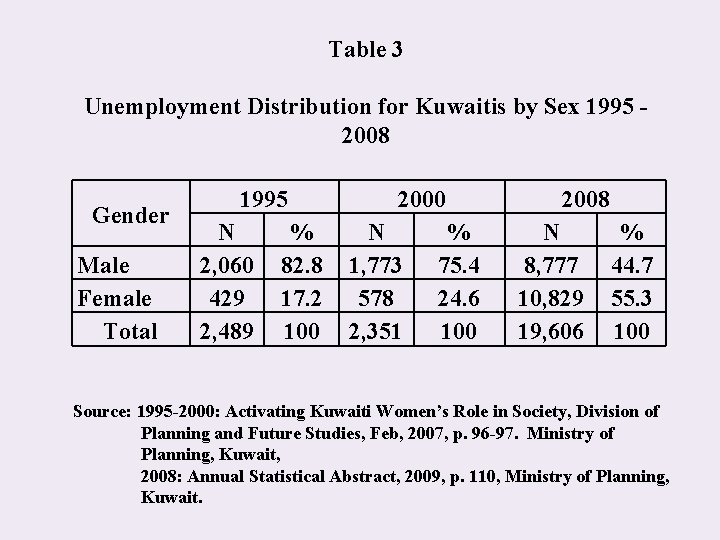
Table 3 Unemployment Distribution for Kuwaitis by Sex 1995 2008 Gender Male Female Total 1995 N 2, 060 429 2, 489 % 82. 8 17. 2 100 2000 N 1, 773 578 2, 351 % 75. 4 24. 6 100 2008 N 8, 777 10, 829 19, 606 % 44. 7 55. 3 100 Source: 1995 -2000: Activating Kuwaiti Women’s Role in Society, Division of Planning and Future Studies, Feb, 2007, p. 96 -97. Ministry of Planning, Kuwait, 2008: Annual Statistical Abstract, 2009, p. 110, Ministry of Planning, Kuwait.
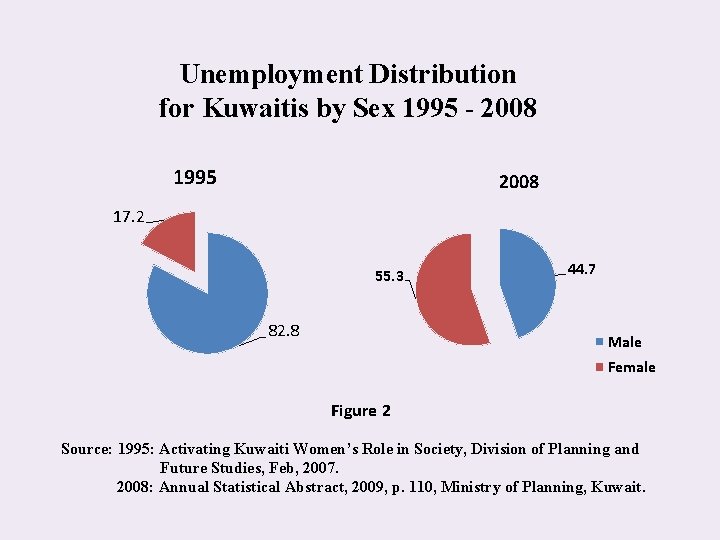
Unemployment Distribution for Kuwaitis by Sex 1995 - 2008 1995 2008 17. 2 55. 3 82. 8 44. 7 Male Female Figure 2 Source: 1995: Activating Kuwaiti Women’s Role in Society, Division of Planning and Future Studies, Feb, 2007. 2008: Annual Statistical Abstract, 2009, p. 110, Ministry of Planning, Kuwait.
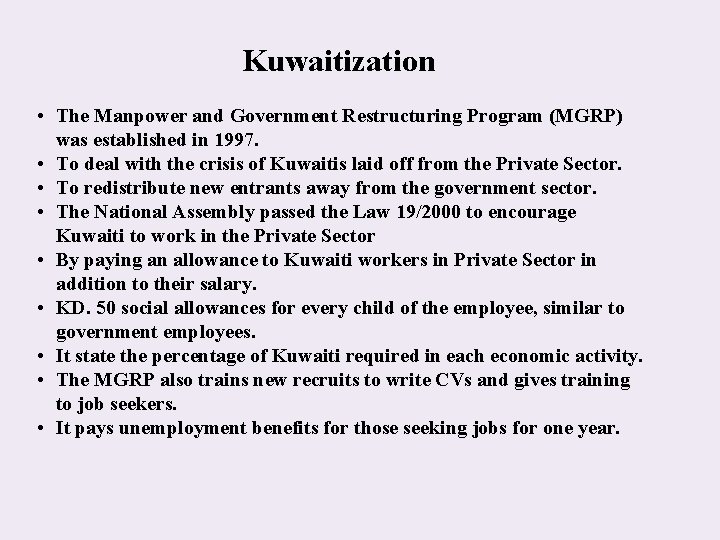
Kuwaitization • The Manpower and Government Restructuring Program (MGRP) was established in 1997. • To deal with the crisis of Kuwaitis laid off from the Private Sector. • To redistribute new entrants away from the government sector. • The National Assembly passed the Law 19/2000 to encourage Kuwaiti to work in the Private Sector • By paying an allowance to Kuwaiti workers in Private Sector in addition to their salary. • KD. 50 social allowances for every child of the employee, similar to government employees. • It state the percentage of Kuwaiti required in each economic activity. • The MGRP also trains new recruits to write CVs and gives training to job seekers. • It pays unemployment benefits for those seeking jobs for one year.
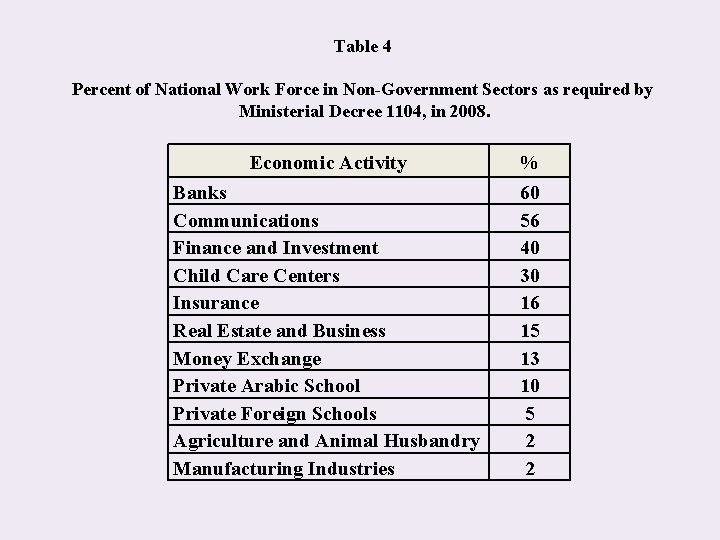
Table 4 Percent of National Work Force in Non-Government Sectors as required by Ministerial Decree 1104, in 2008. Economic Activity % Banks Communications Finance and Investment Child Care Centers Insurance Real Estate and Business Money Exchange Private Arabic School Private Foreign Schools Agriculture and Animal Husbandry Manufacturing Industries 60 56 40 30 16 15 13 10 5 2 2
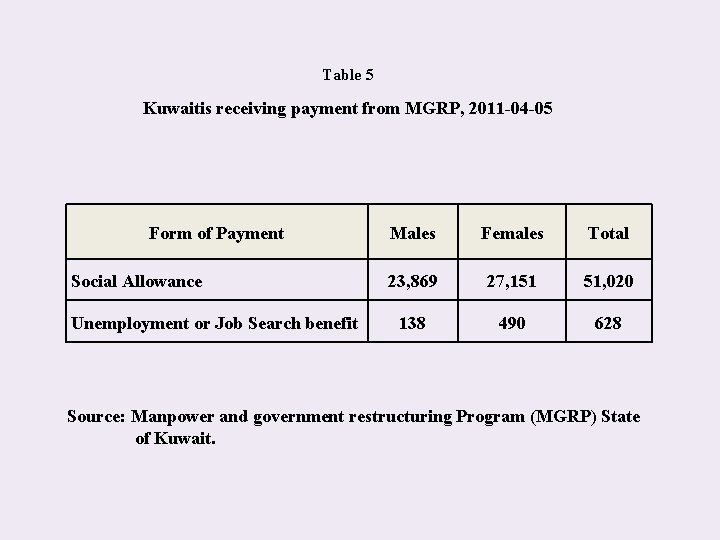
Table 5 Kuwaitis receiving payment from MGRP, 2011 -04 -05 Form of Payment Social Allowance Unemployment or Job Search benefit Males Females Total 23, 869 27, 151 51, 020 138 490 628 Source: Manpower and government restructuring Program (MGRP) State of Kuwait.
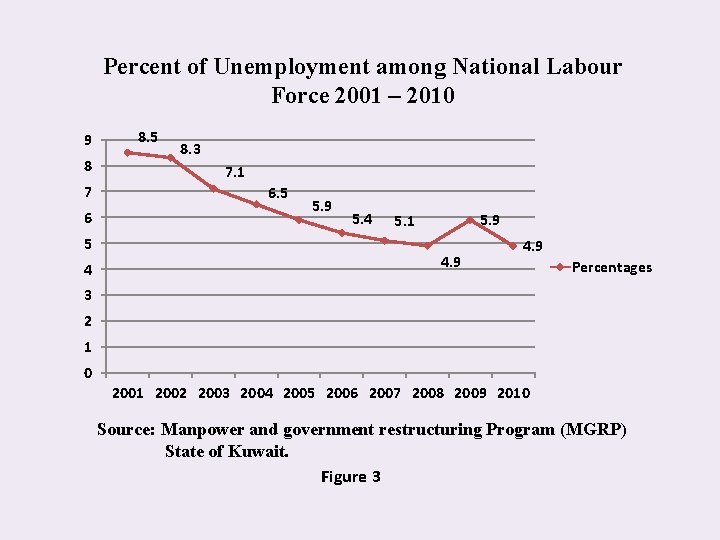
Percent of Unemployment among National Labour Force 2001 – 2010 9 8 7 6 5 4 8. 5 8. 3 7. 1 6. 5 5. 9 5. 4 5. 9 5. 1 4. 9 Percentages 3 2 1 0 2001 2002 2003 2004 2005 2006 2007 2008 2009 2010 Source: Manpower and government restructuring Program (MGRP) State of Kuwait. Figure 3
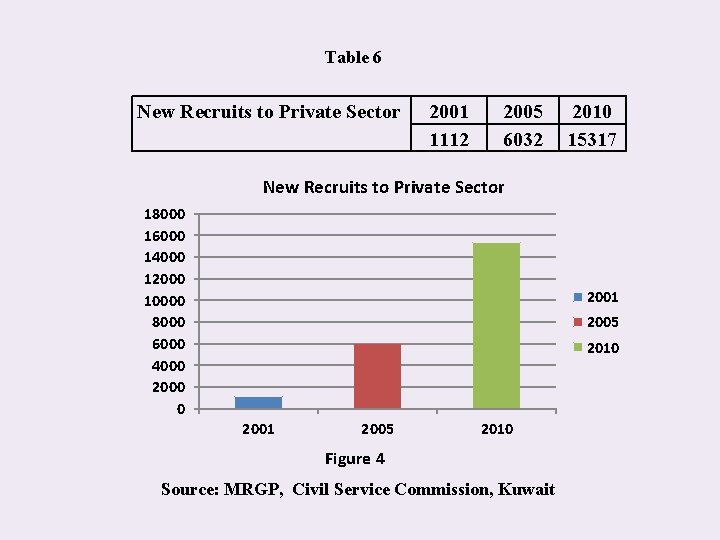
Table 6 New Recruits to Private Sector 2001 1112 2005 6032 2010 15317 New Recruits to Private Sector 18000 16000 14000 12000 10000 8000 6000 4000 2000 0 2001 2005 2010 Figure 4 Source: MRGP, Civil Service Commission, Kuwait
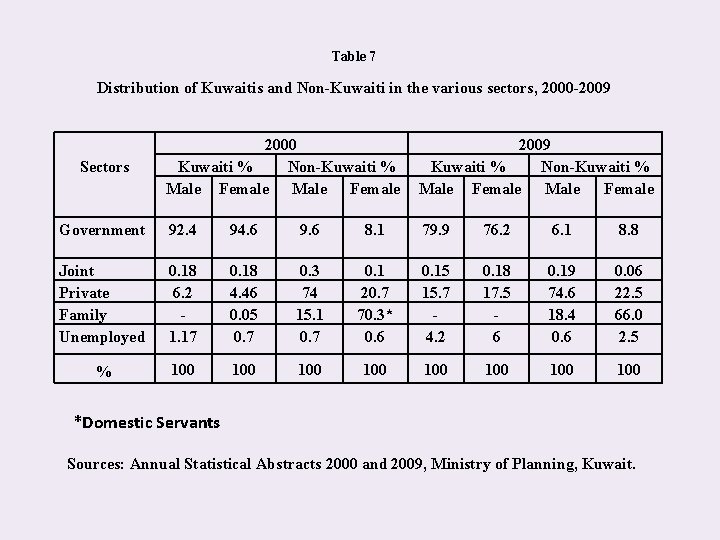
Table 7 Distribution of Kuwaitis and Non-Kuwaiti in the various sectors, 2000 -2009 2000 Kuwaiti % Non-Kuwaiti % Male Female 2009 Kuwaiti % Non-Kuwaiti % Male Female Government 92. 4 94. 6 9. 6 8. 1 79. 9 76. 2 6. 1 8. 8 Joint Private Family Unemployed 0. 18 6. 2 1. 17 0. 18 4. 46 0. 05 0. 7 0. 3 74 15. 1 0. 7 0. 1 20. 7 70. 3* 0. 6 0. 15 15. 7 4. 2 0. 18 17. 5 6 0. 19 74. 6 18. 4 0. 6 0. 06 22. 5 66. 0 2. 5 % 100 100 Sectors *Domestic Servants Sources: Annual Statistical Abstracts 2000 and 2009, Ministry of Planning, Kuwait.
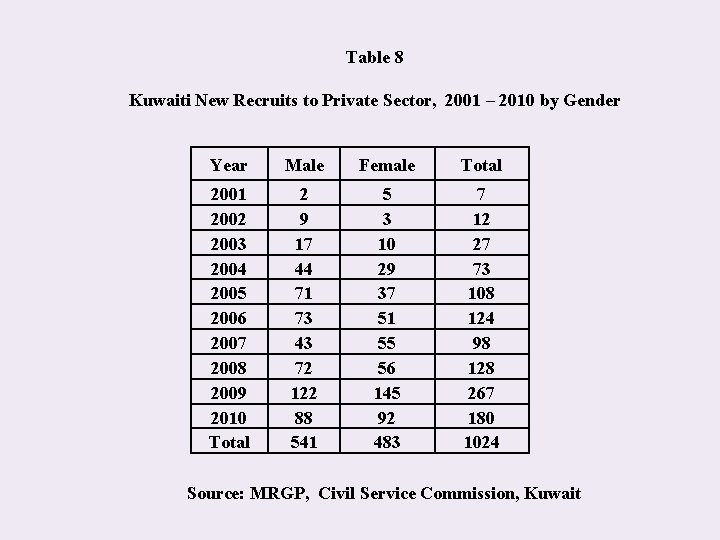
Table 8 Kuwaiti New Recruits to Private Sector, 2001 – 2010 by Gender Year Male Female Total 2001 2002 2003 2004 2005 2006 2007 2008 2009 2010 Total 2 9 17 44 71 73 43 72 122 88 541 5 3 10 29 37 51 55 56 145 92 483 7 12 27 73 108 124 98 128 267 180 1024 Source: MRGP, Civil Service Commission, Kuwait
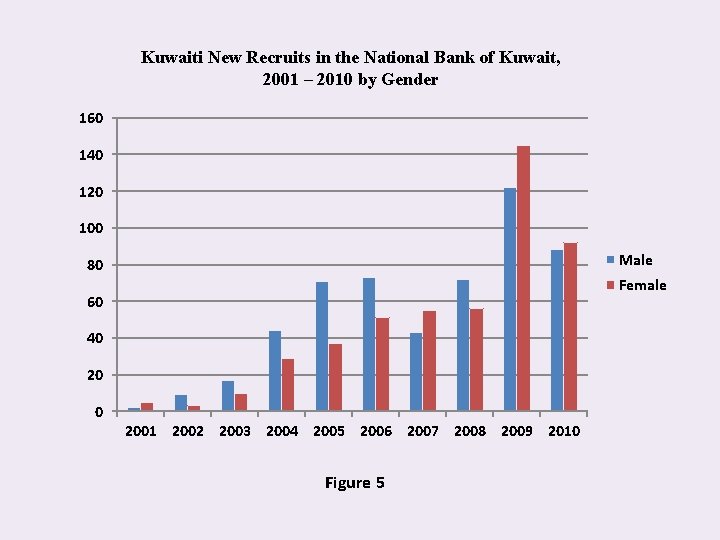
Kuwaiti New Recruits in the National Bank of Kuwait, 2001 – 2010 by Gender 160 140 120 100 Male 80 Female 60 40 2001 2002 2003 2004 2005 2006 2007 2008 2009 2010 Figure 5
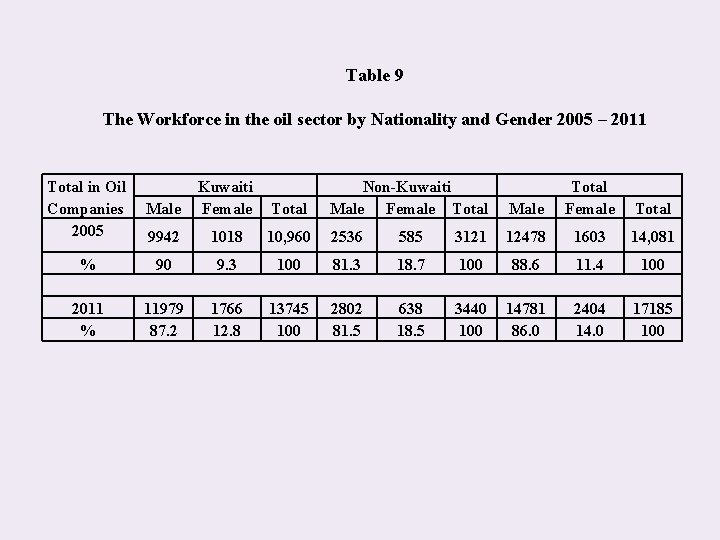
Table 9 The Workforce in the oil sector by Nationality and Gender 2005 – 2011 Total in Oil Companies 2005 Male Kuwaiti Female Total Non-Kuwaiti Male Female Total 9942 % 2011 % Male Total Female Total 1018 10, 960 2536 585 3121 12478 1603 14, 081 90 9. 3 100 81. 3 18. 7 100 88. 6 11. 4 100 11979 87. 2 1766 12. 8 13745 100 2802 81. 5 638 18. 5 3440 100 14781 86. 0 2404 14. 0 17185 100
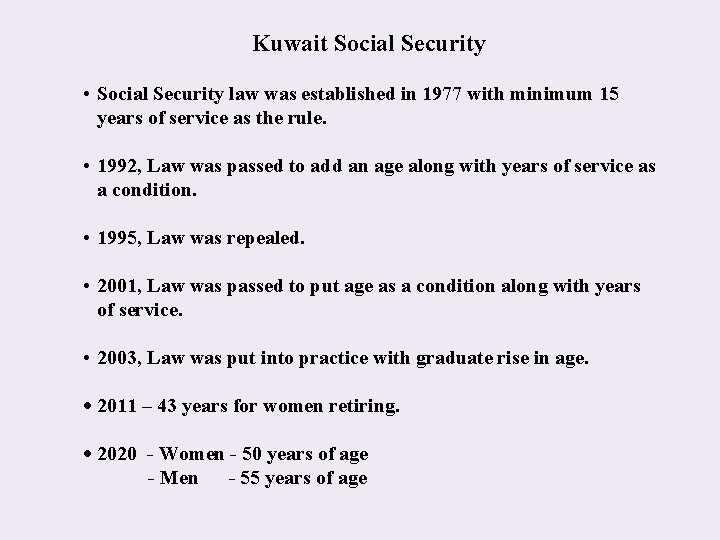
Kuwait Social Security • Social Security law was established in 1977 with minimum 15 years of service as the rule. • 1992, Law was passed to add an age along with years of service as a condition. • 1995, Law was repealed. • 2001, Law was passed to put age as a condition along with years of service. • 2003, Law was put into practice with graduate rise in age. 2011 – 43 years for women retiring. 2020 - Women - 50 years of age - Men - 55 years of age
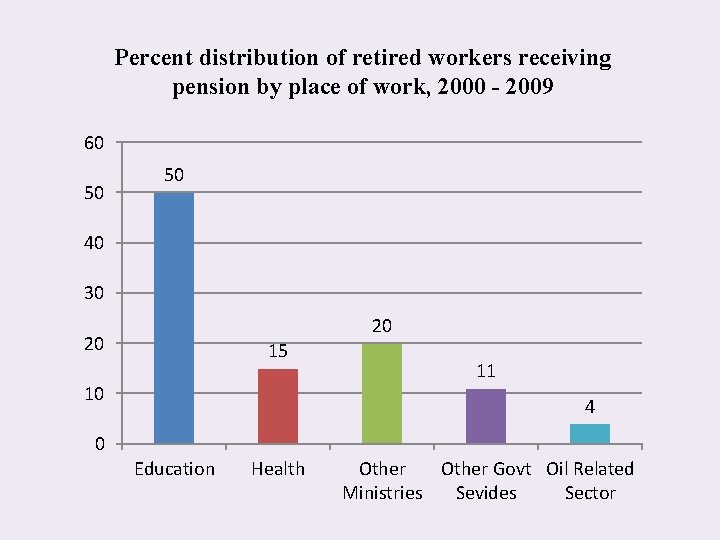
Percent distribution of retired workers receiving pension by place of work, 2000 - 2009 60 50 50 40 30 20 20 15 10 11 4 0 Education Health Other Govt Oil Related Ministries Sevides Sector
- Slides: 17