
KSUCOMCourse 341 Safar 1436 November 2014 Water Sodium
KSU-COM-Course 341 Safar 1436 -November 2014 Water & Sodium Disorders (H 2 O/Na+) Ahmad Raed Tarakji, MD, MSPH, FRCPC, FACP, FASN, FNKF Assistant Professor Nephrology Unit, Department of Medicine College of Medicine, King Saud University Consultant Internist & Nephrologist King Khalid University Hospital King Saud University Medical City Atarakji@ksu. edu. sa
Objectives n By the end of the lecture the student should be able to: 1) Recognize the systems that control body Na and H 2 O contents 2) Understand the difference between body Na content (volume status) and serum Na concentration 3) Recognize the different types of IV fluids used at bedside 4) Know the workup for Hyponatremia 5) Know how to calculate the water deficit in Hypernatremia Nov 2014 A R Tarakji, MD, FRCPC 2
Structure 1) Composition of the fluid compartments 2) Mechanisms which regulate fluid and Sodium balance 3) Disorders of water balance 4) Disorders of Sodium balance Nov 2014 A R Tarakji, MD, FRCPC 3

Homeostasis A relative constancy in the internal environment of the body, naturally maintained by adaptive responses that promote cell function and survival Nov 2014 A R Tarakji, MD, FRCPC 4
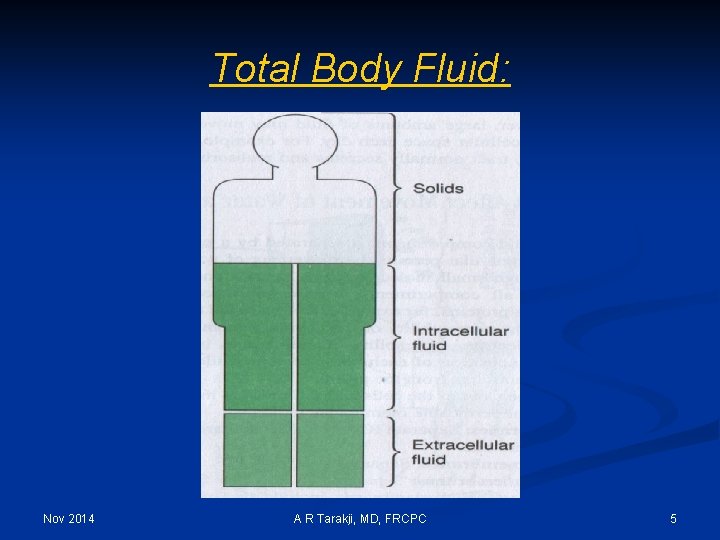
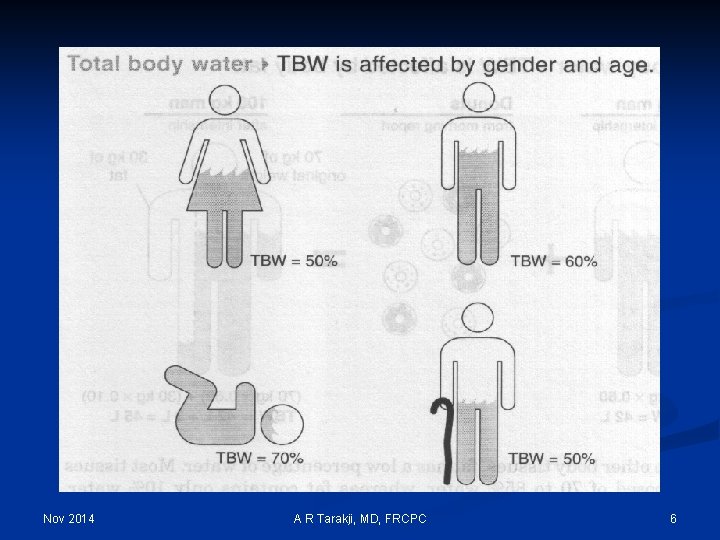
Total Body Fluid: Nov 2014 A R Tarakji, MD, FRCPC 5
Nov 2014 A R Tarakji, MD, FRCPC 6
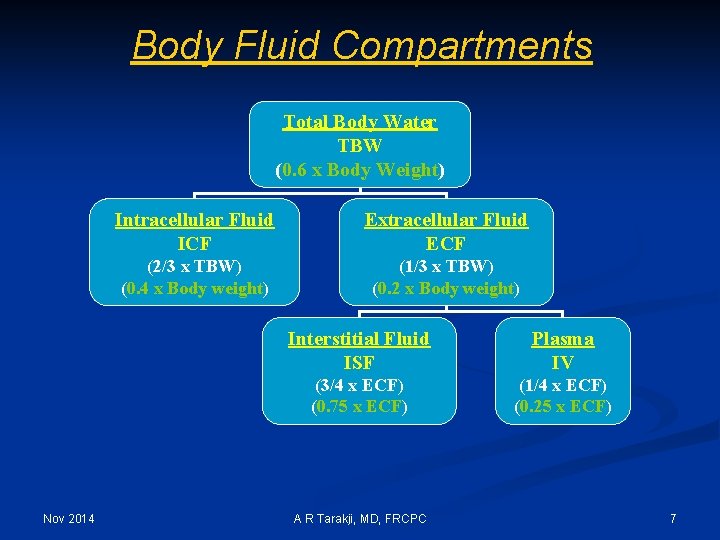
Body Fluid Compartments Total Body Water TBW (0. 6 x Body Weight) Nov 2014 Intracellular Fluid ICF Extracellular Fluid ECF (2/3 x TBW) (0. 4 x Body weight) (1/3 x TBW) (0. 2 x Body weight) Interstitial Fluid ISF Plasma IV (3/4 x ECF) (0. 75 x ECF) (1/4 x ECF) (0. 25 x ECF) A R Tarakji, MD, FRCPC 7
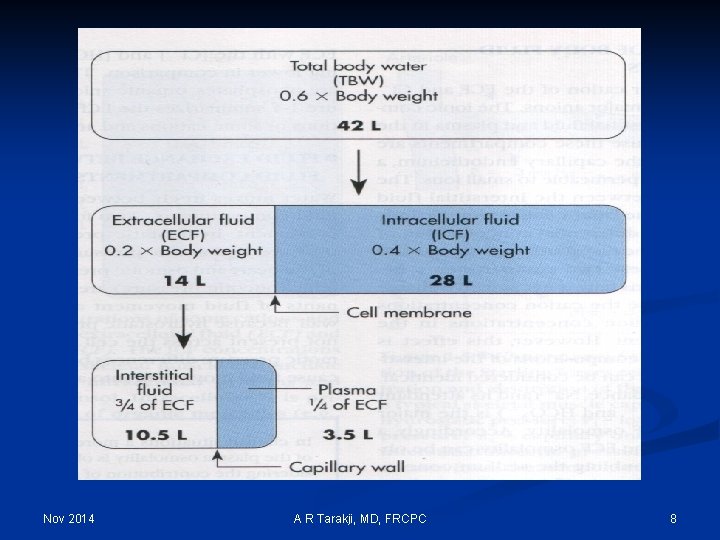
Nov 2014 A R Tarakji, MD, FRCPC 8
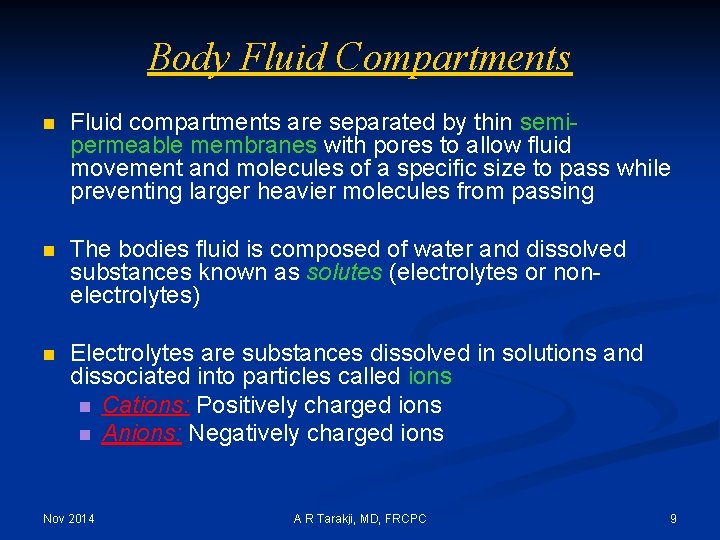
Body Fluid Compartments n Fluid compartments are separated by thin semipermeable membranes with pores to allow fluid movement and molecules of a specific size to pass while preventing larger heavier molecules from passing n The bodies fluid is composed of water and dissolved substances known as solutes (electrolytes or nonelectrolytes) n Electrolytes are substances dissolved in solutions and dissociated into particles called ions n Cations: Positively charged ions n Anions: Negatively charged ions Nov 2014 A R Tarakji, MD, FRCPC 9
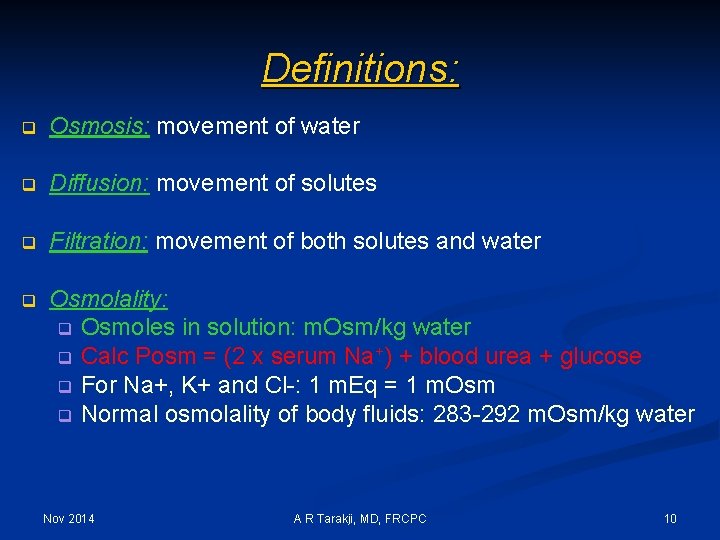
Definitions: q Osmosis: movement of water q Diffusion: movement of solutes q Filtration: movement of both solutes and water q Osmolality: q Osmoles in solution: m. Osm/kg water q Calc Posm = (2 x serum Na+) + blood urea + glucose q For Na+, K+ and Cl-: 1 m. Eq = 1 m. Osm q Normal osmolality of body fluids: 283 -292 m. Osm/kg water Nov 2014 A R Tarakji, MD, FRCPC 10
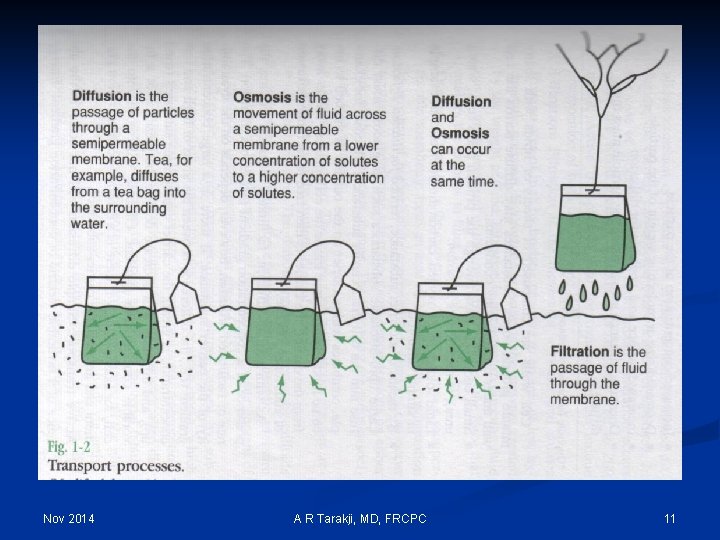
Nov 2014 A R Tarakji, MD, FRCPC 11
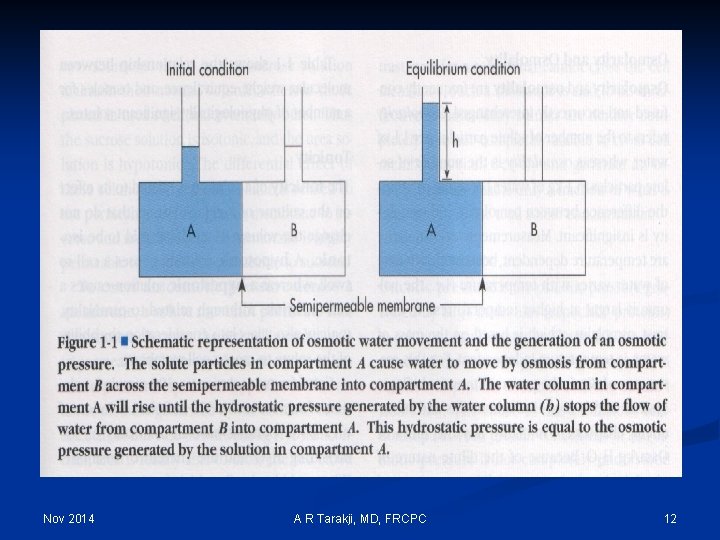
Nov 2014 A R Tarakji, MD, FRCPC 12
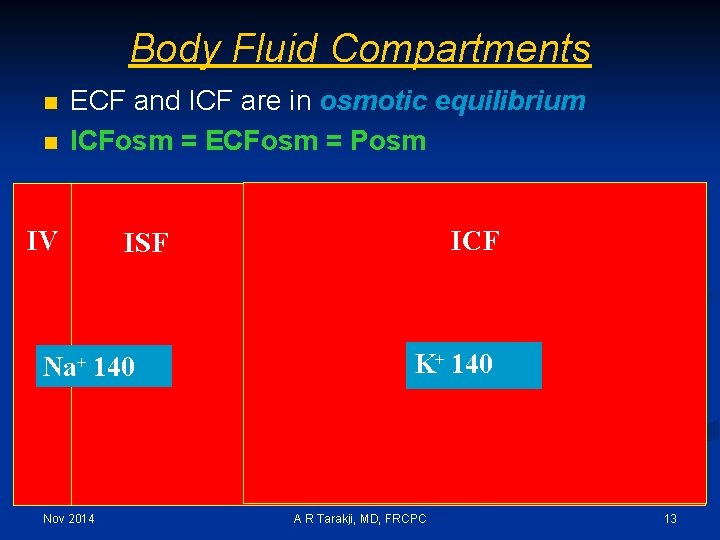
Body Fluid Compartments n n ECF and ICF are in osmotic equilibrium ICFosm = ECFosm = Posm IV Na+ 140 Nov 2014 ICF ISF K+ 140 A R Tarakji, MD, FRCPC 13
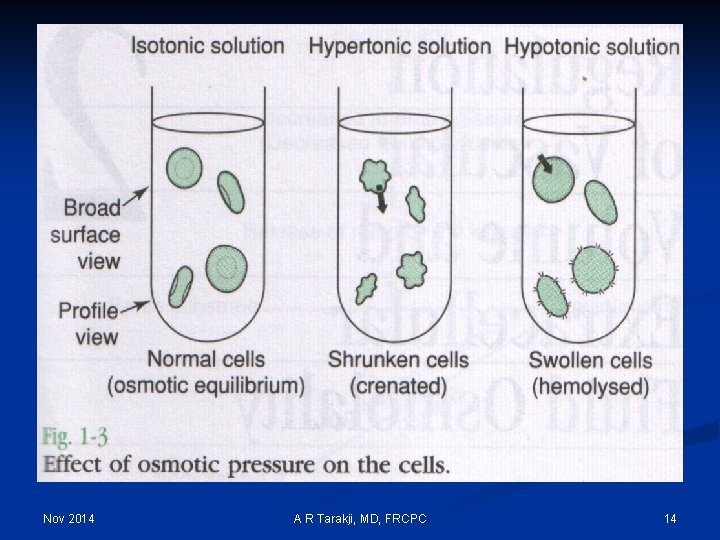
Nov 2014 A R Tarakji, MD, FRCPC 14
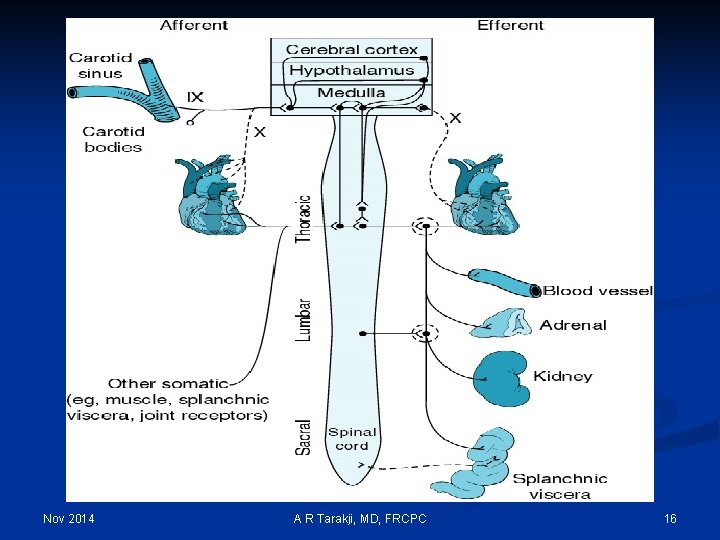
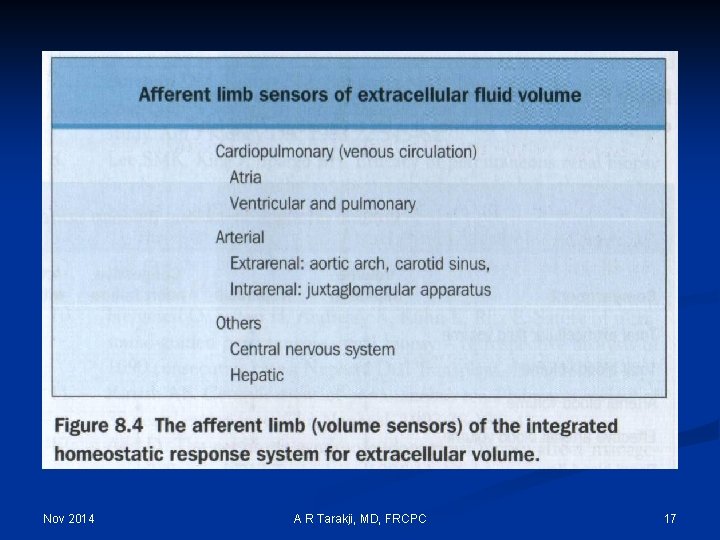
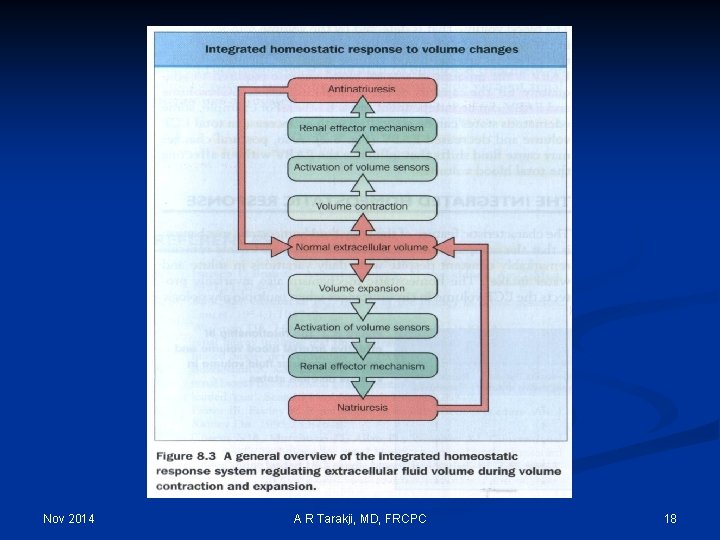
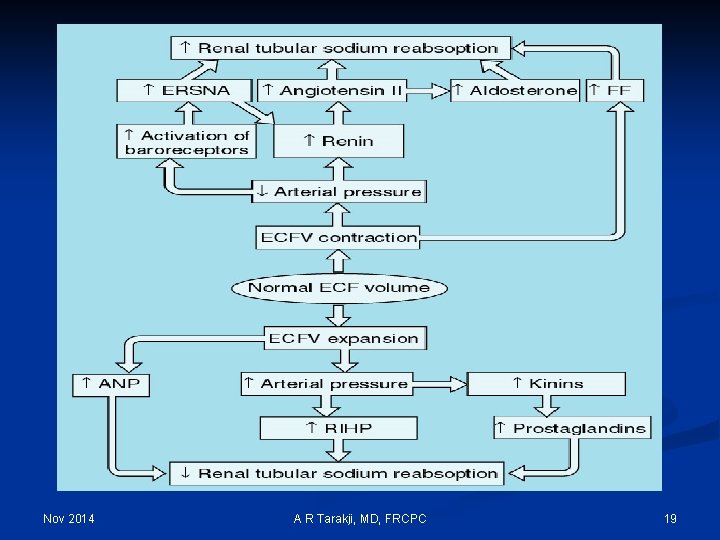
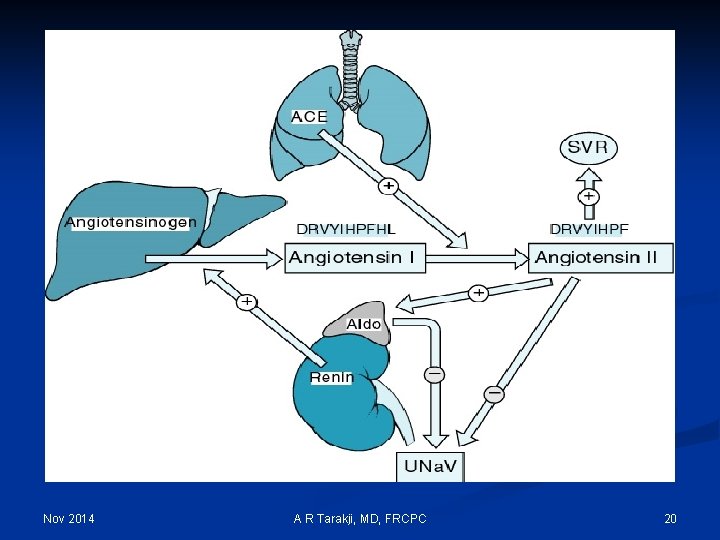
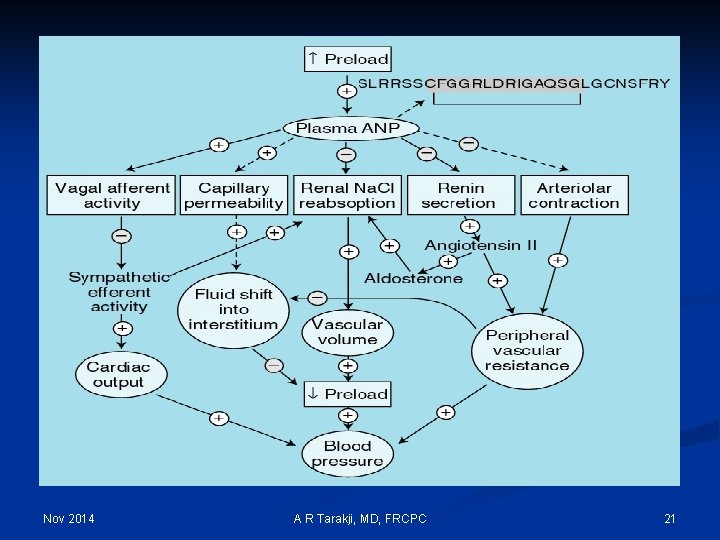
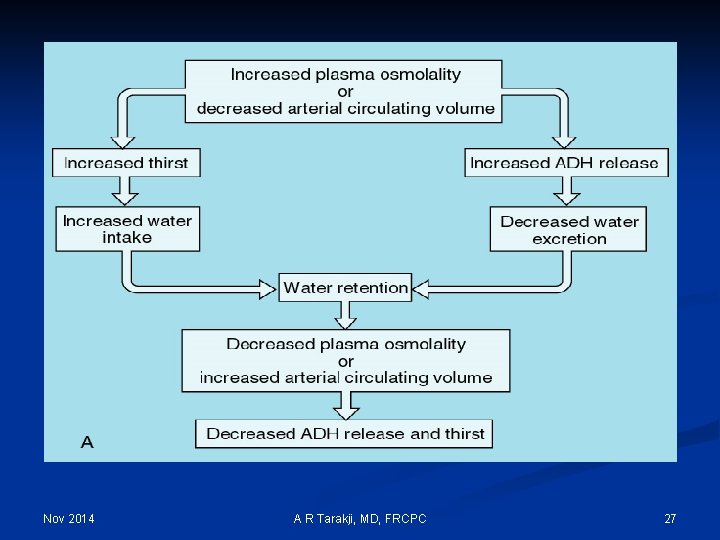
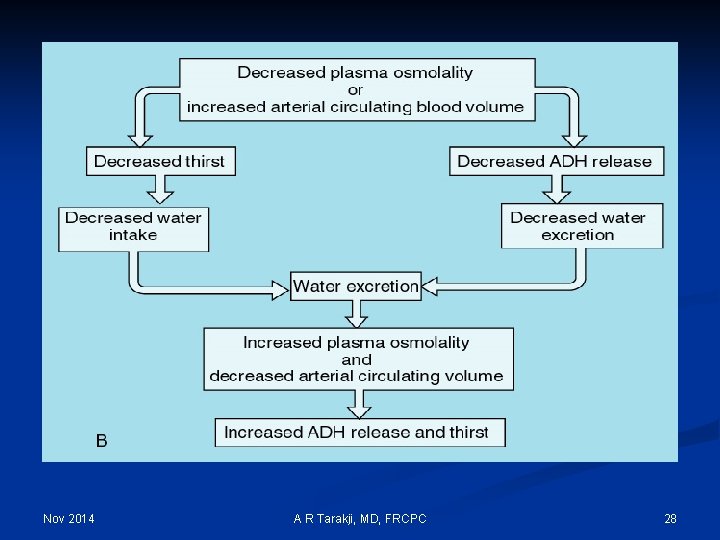
Regulation Mechanisms of Fluid and Electrolytes: n Regulation of osmolality and volume is achieved through thirst and the osmoreceptor-antidiuretic hormone system (vasopressin) n n Volume is more important than osmolality The regulation of volume also occurs through neurological and renal mechanisms n The stretch receptors (baroreceptors) n The Renin-Angiotension-Aldosterone System n The Natriuretic peptides n Kinins & Prostaglandins Nov 2014 A R Tarakji, MD, FRCPC 15
Nov 2014 A R Tarakji, MD, FRCPC 16
Nov 2014 A R Tarakji, MD, FRCPC 17
Nov 2014 A R Tarakji, MD, FRCPC 18
Nov 2014 A R Tarakji, MD, FRCPC 19
Nov 2014 A R Tarakji, MD, FRCPC 20
Nov 2014 A R Tarakji, MD, FRCPC 21
Nov 2014 A R Tarakji, MD, FRCPC 22

Nov 2014 A R Tarakji, MD, FRCPC 23
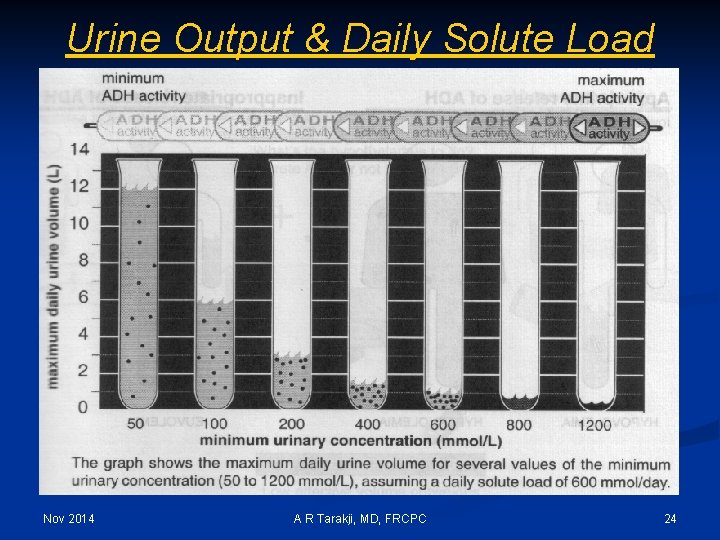
Urine Output & Daily Solute Load Nov 2014 A R Tarakji, MD, FRCPC 24
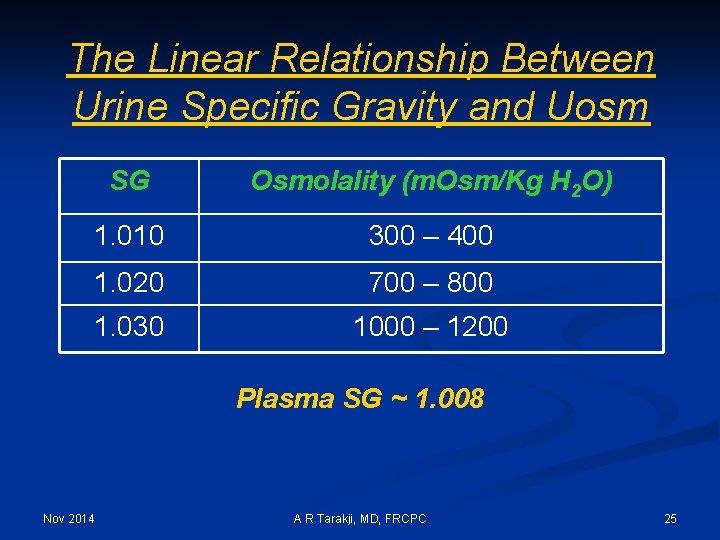
The Linear Relationship Between Urine Specific Gravity and Uosm SG Osmolality (m. Osm/Kg H 2 O) 1. 010 300 – 400 1. 020 700 – 800 1. 030 1000 – 1200 Plasma SG ~ 1. 008 Nov 2014 A R Tarakji, MD, FRCPC 25
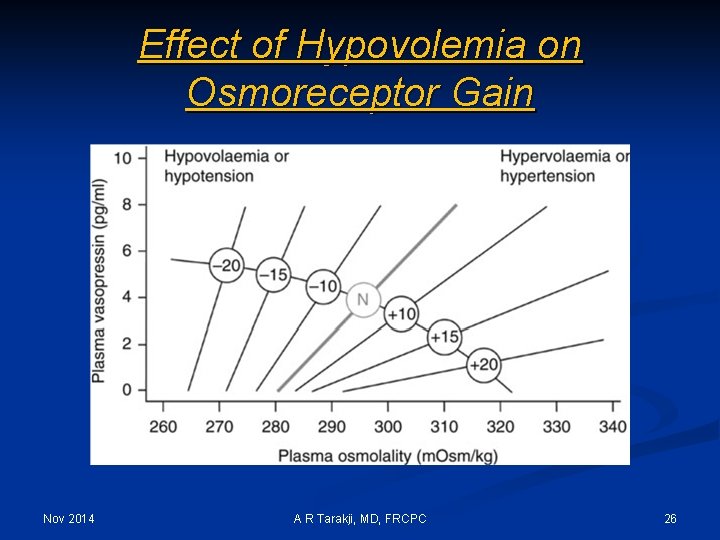
Effect of Hypovolemia on Osmoreceptor Gain Nov 2014 A R Tarakji, MD, FRCPC 26
Nov 2014 A R Tarakji, MD, FRCPC 27
Nov 2014 A R Tarakji, MD, FRCPC 28
Nov 2014 A R Tarakji, MD, FRCPC 29
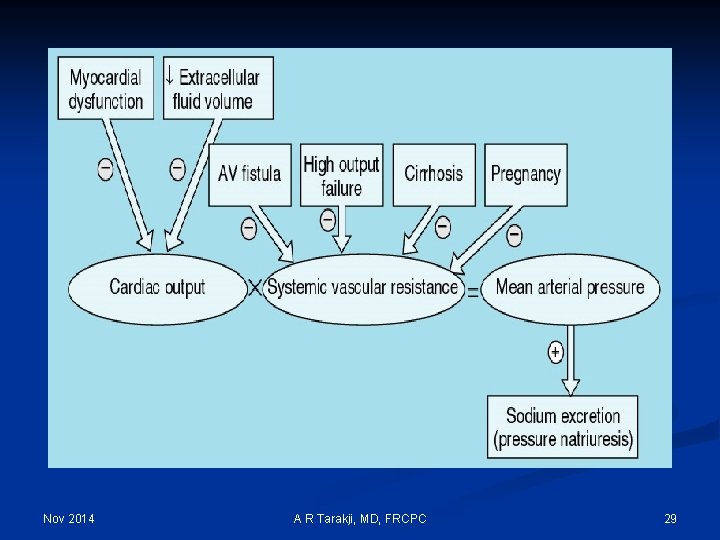
Effective Arterial Blood Volume (EABV): n Although the absolute volume of the intravascular space is an important component of circulatory “fullness”, the adequacy of the circulation (more commonly called the effective arterial blood volume or EABV) also is determined by cardiac output and systemic vascular resistance Nov 2014 A R Tarakji, MD, FRCPC 30
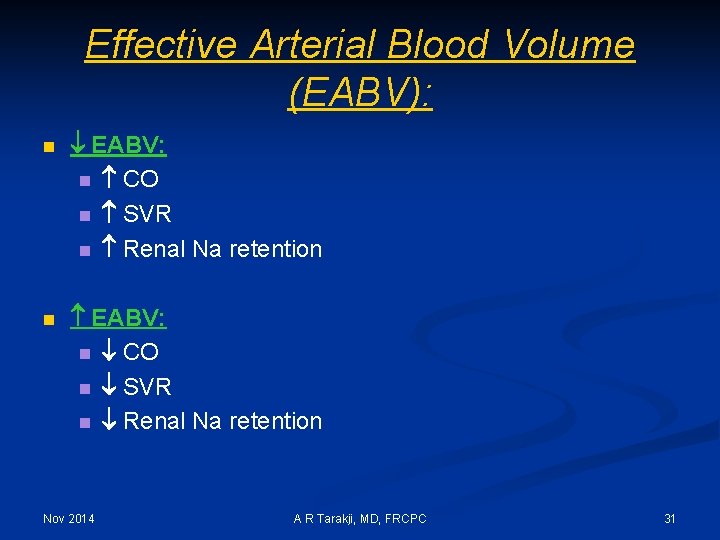
Effective Arterial Blood Volume (EABV): n EABV: n CO n SVR n Renal Na retention Nov 2014 A R Tarakji, MD, FRCPC 31
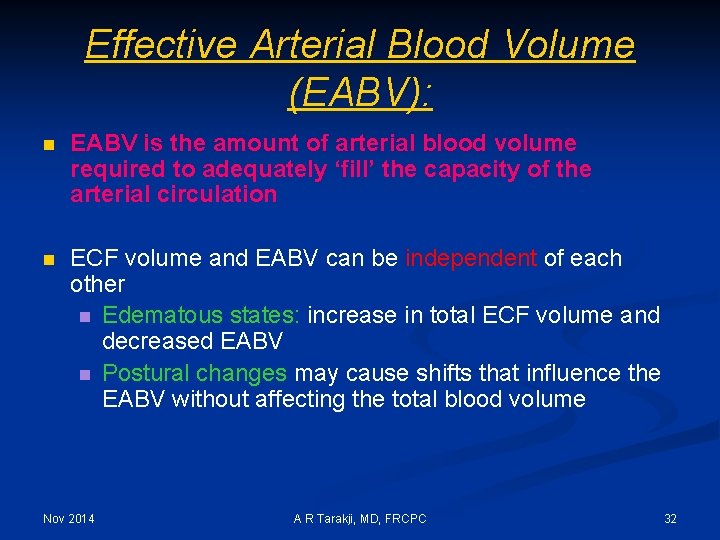
Effective Arterial Blood Volume (EABV): n EABV is the amount of arterial blood volume required to adequately ‘fill’ the capacity of the arterial circulation n ECF volume and EABV can be independent of each other n Edematous states: increase in total ECF volume and decreased EABV n Postural changes may cause shifts that influence the EABV without affecting the total blood volume Nov 2014 A R Tarakji, MD, FRCPC 32
Effective Arterial Blood Volume (EABV): Nov 2014 A R Tarakji, MD, FRCPC 33
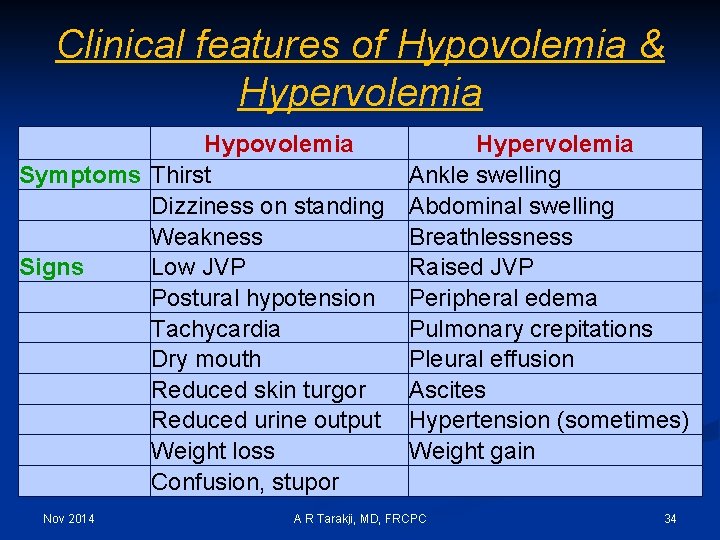
Clinical features of Hypovolemia & Hypervolemia Hypovolemia Symptoms Thirst Dizziness on standing Weakness Signs Low JVP Postural hypotension Tachycardia Dry mouth Reduced skin turgor Reduced urine output Weight loss Confusion, stupor Nov 2014 Hypervolemia Ankle swelling Abdominal swelling Breathlessness Raised JVP Peripheral edema Pulmonary crepitations Pleural effusion Ascites Hypertension (sometimes) Weight gain A R Tarakji, MD, FRCPC 34
Nov 2014 A R Tarakji, MD, FRCPC 35
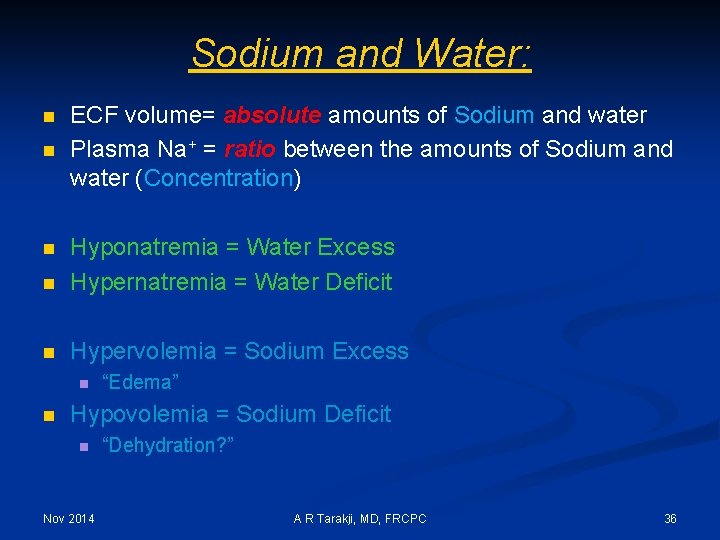
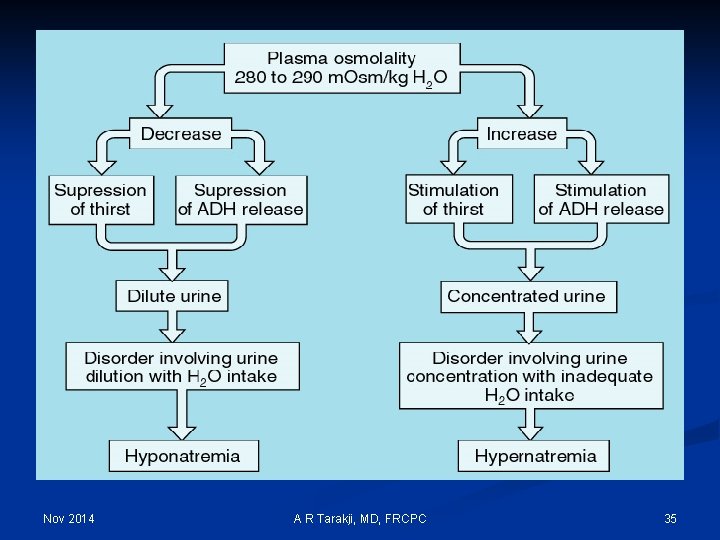
Sodium and Water: n n ECF volume= absolute amounts of Sodium and water Plasma Na+ = ratio between the amounts of Sodium and water (Concentration) n Hyponatremia = Water Excess Hypernatremia = Water Deficit n Hypervolemia = Sodium Excess n n n “Edema” Hypovolemia = Sodium Deficit n Nov 2014 “Dehydration? ” A R Tarakji, MD, FRCPC 36
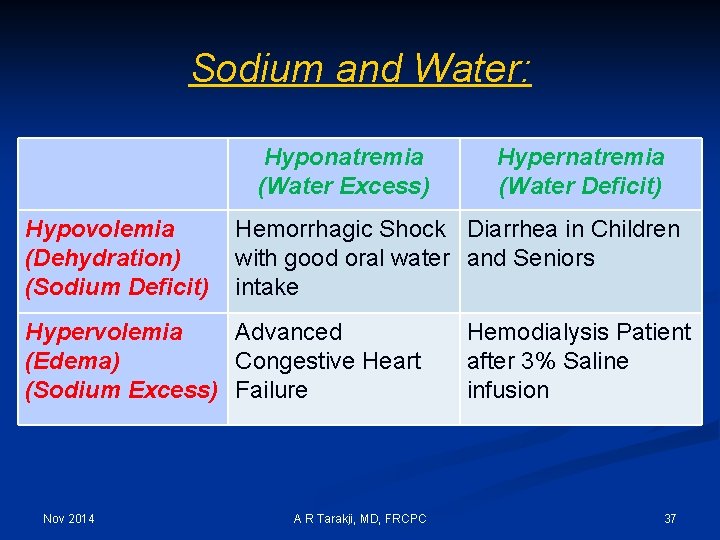
Sodium and Water: Hyponatremia (Water Excess) Hypovolemia (Dehydration) (Sodium Deficit) Hemorrhagic Shock Diarrhea in Children with good oral water and Seniors intake Hypervolemia Advanced (Edema) Congestive Heart (Sodium Excess) Failure Nov 2014 Hypernatremia (Water Deficit) A R Tarakji, MD, FRCPC Hemodialysis Patient after 3% Saline infusion 37
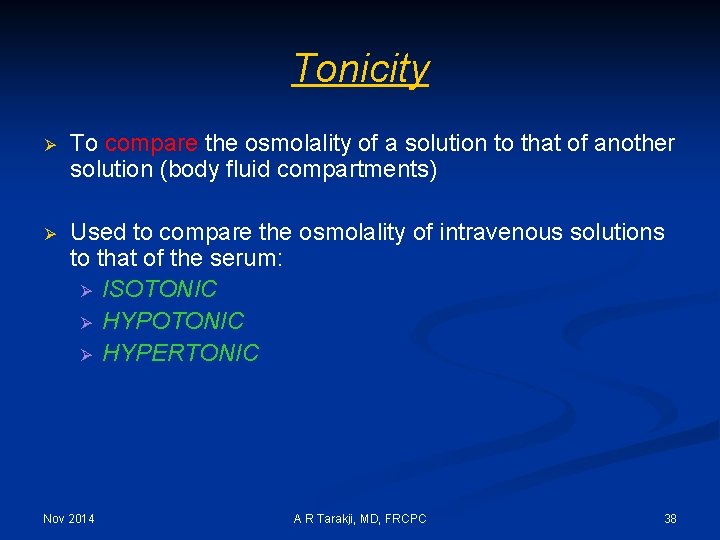
Tonicity Ø To compare the osmolality of a solution to that of another solution (body fluid compartments) Ø Used to compare the osmolality of intravenous solutions to that of the serum: Ø ISOTONIC Ø HYPERTONIC Nov 2014 A R Tarakji, MD, FRCPC 38
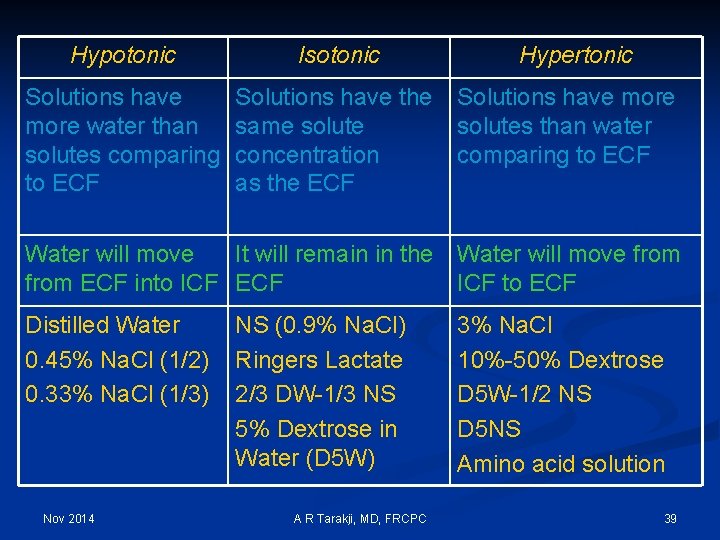
Hypotonic Isotonic Solutions have more water than solutes comparing to ECF Solutions have the same solute concentration as the ECF Hypertonic Solutions have more solutes than water comparing to ECF Water will move It will remain in the Water will move from ECF into ICF ECF ICF to ECF Distilled Water 0. 45% Na. Cl (1/2) 0. 33% Na. Cl (1/3) Nov 2014 NS (0. 9% Na. Cl) Ringers Lactate 2/3 DW-1/3 NS 5% Dextrose in Water (D 5 W) A R Tarakji, MD, FRCPC 3% Na. Cl 10%-50% Dextrose D 5 W-1/2 NS D 5 NS Amino acid solution 39
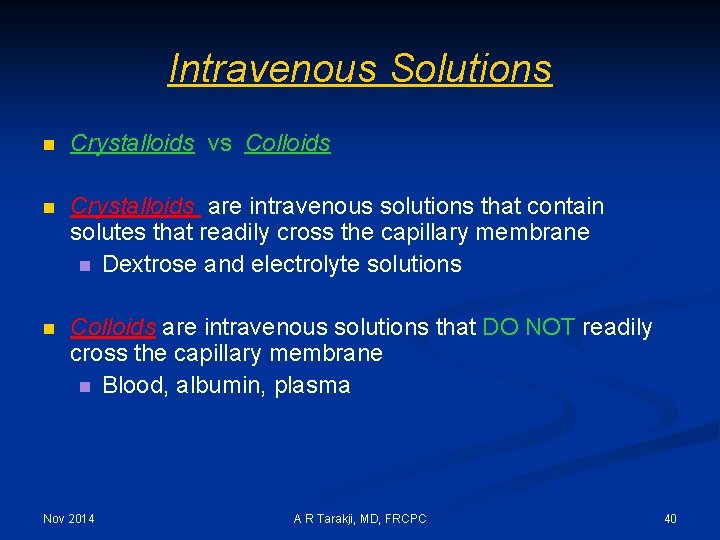
Intravenous Solutions n Crystalloids vs Colloids n Crystalloids are intravenous solutions that contain solutes that readily cross the capillary membrane n Dextrose and electrolyte solutions n Colloids are intravenous solutions that DO NOT readily cross the capillary membrane n Blood, albumin, plasma Nov 2014 A R Tarakji, MD, FRCPC 40
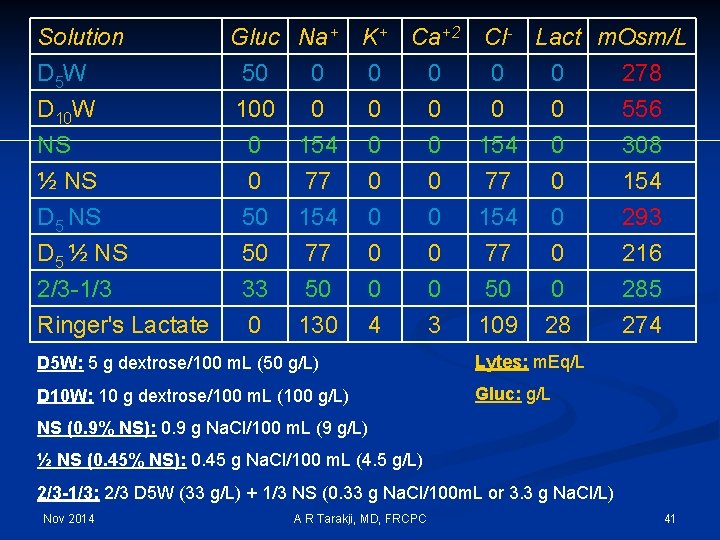
Solution D 5 W D 10 W NS ½ NS D 5 ½ NS 2/3 -1/3 Ringer's Lactate Gluc Na+ 50 0 100 0 0 154 0 50 50 33 0 K+ Ca+2 Cl- Lact m. Osm/L 0 0 278 0 0 556 0 0 154 0 308 77 154 77 50 130 0 0 4 0 0 3 77 154 77 50 109 0 0 28 D 5 W: 5 g dextrose/100 m. L (50 g/L) Lytes: m. Eq/L D 10 W: 10 g dextrose/100 m. L (100 g/L) Gluc: g/L 154 293 216 285 274 NS (0. 9% NS): 0. 9 g Na. Cl/100 m. L (9 g/L) ½ NS (0. 45% NS): 0. 45 g Na. Cl/100 m. L (4. 5 g/L) 2/3 -1/3: 2/3 D 5 W (33 g/L) + 1/3 NS (0. 33 g Na. Cl/100 m. L or 3. 3 g Na. Cl/L) Nov 2014 A R Tarakji, MD, FRCPC 41
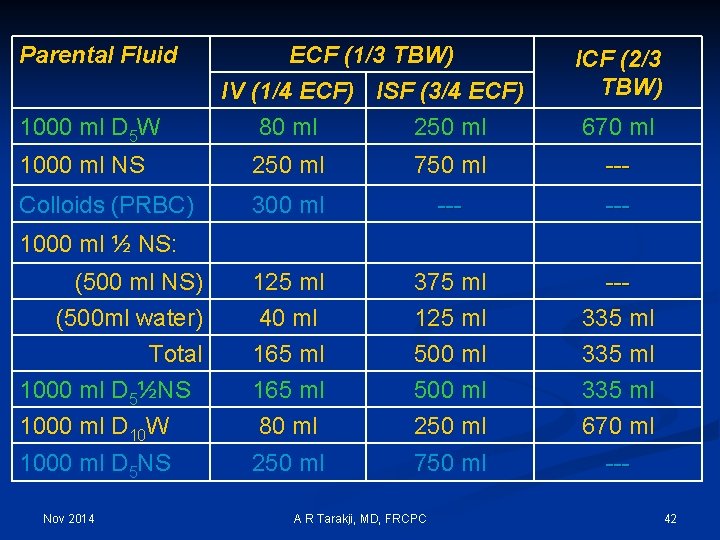
Parental Fluid 1000 ml D 5 W ECF (1/3 TBW) IV (1/4 ECF) ISF (3/4 ECF) 80 ml 250 ml ICF (2/3 TBW) 670 ml 1000 ml NS 250 ml 750 ml --- Colloids (PRBC) 300 ml --- (500 ml NS) (500 ml water) Total 1000 ml D 5½NS 1000 ml D 10 W 125 ml 40 ml 165 ml 80 ml 375 ml 125 ml 500 ml 250 ml --335 ml 670 ml 1000 ml D 5 NS 250 ml 750 ml --- 1000 ml ½ NS: Nov 2014 A R Tarakji, MD, FRCPC 42
Nov 2014 A R Tarakji, MD, FRCPC 43
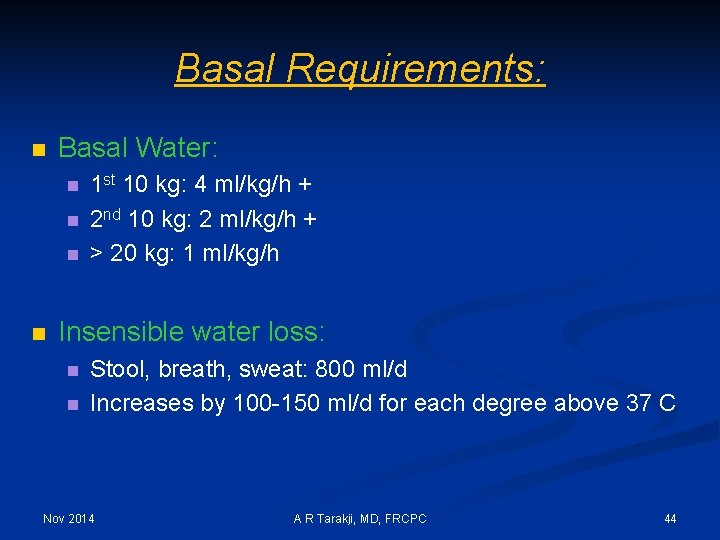
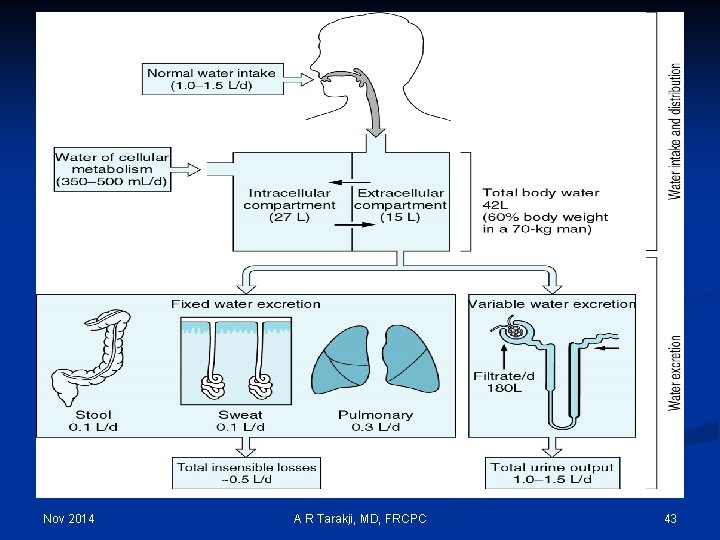
Basal Requirements: n Basal Water: n n 1 st 10 kg: 4 ml/kg/h + 2 nd 10 kg: 2 ml/kg/h + > 20 kg: 1 ml/kg/h Insensible water loss: n n Stool, breath, sweat: 800 ml/d Increases by 100 -150 ml/d for each degree above 37 C Nov 2014 A R Tarakji, MD, FRCPC 44
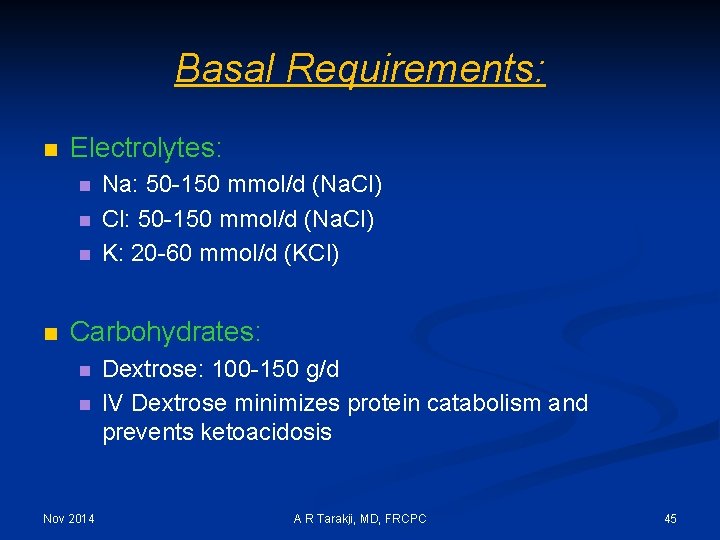
Basal Requirements: n Electrolytes: n n Na: 50 -150 mmol/d (Na. Cl) Cl: 50 -150 mmol/d (Na. Cl) K: 20 -60 mmol/d (KCl) Carbohydrates: n n Nov 2014 Dextrose: 100 -150 g/d IV Dextrose minimizes protein catabolism and prevents ketoacidosis A R Tarakji, MD, FRCPC 45
Hyponatremia Nov 2014 A R Tarakji, MD, FRCPC 46
Hyponatremia 1. Normotonic or Isotonic Hyponatremia 1. Factitious Hyponatremia 2. Pseudohyponatremia 3. Results from laboratory artifact due to high concentrations of proteins or lipids Nov 2014 A R Tarakji, MD, FRCPC 47
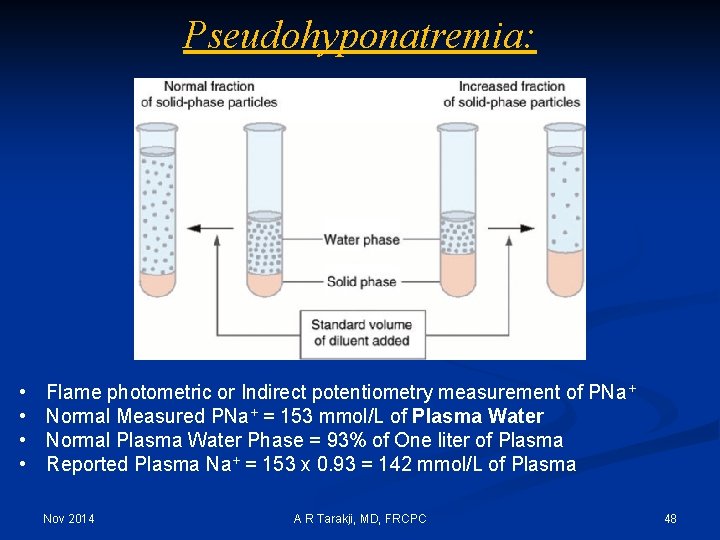
Pseudohyponatremia: • • Flame photometric or Indirect potentiometry measurement of PNa+ Normal Measured PNa+ = 153 mmol/L of Plasma Water Normal Plasma Water Phase = 93% of One liter of Plasma Reported Plasma Na+ = 153 x 0. 93 = 142 mmol/L of Plasma Nov 2014 A R Tarakji, MD, FRCPC 48
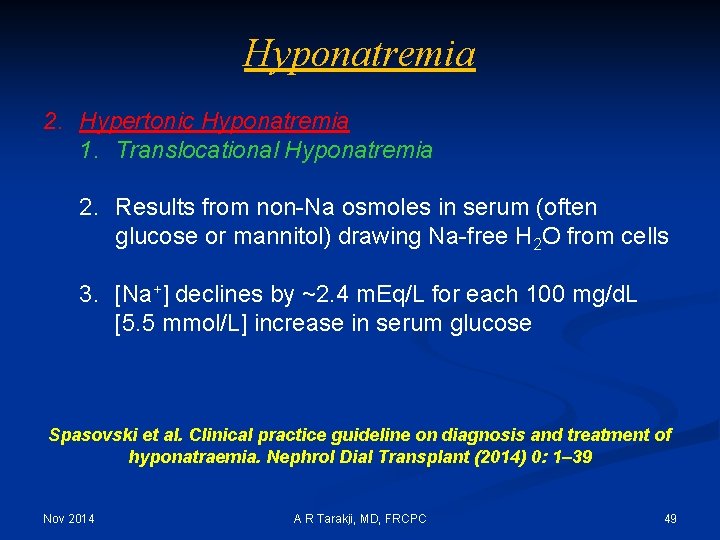
Hyponatremia 2. Hypertonic Hyponatremia 1. Translocational Hyponatremia 2. Results from non-Na osmoles in serum (often glucose or mannitol) drawing Na-free H 2 O from cells 3. [Na+] declines by ~2. 4 m. Eq/L for each 100 mg/d. L [5. 5 mmol/L] increase in serum glucose Spasovski et al. Clinical practice guideline on diagnosis and treatment of hyponatraemia. Nephrol Dial Transplant (2014) 0: 1– 39 Nov 2014 A R Tarakji, MD, FRCPC 49
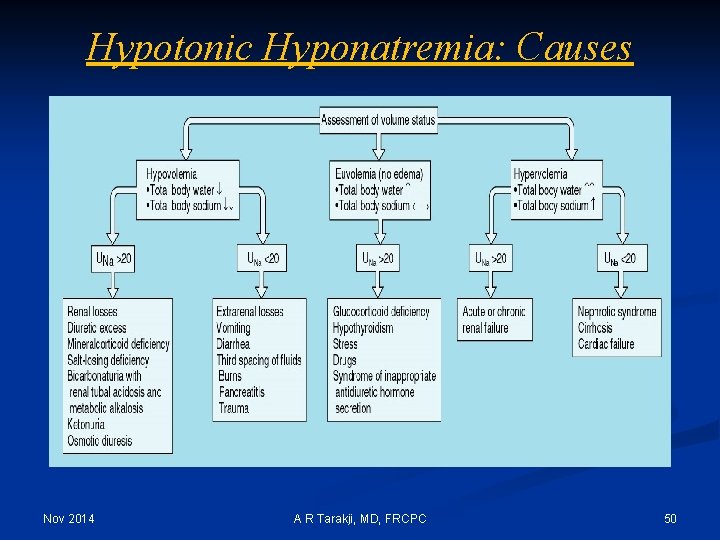
Hypotonic Hyponatremia: Causes Nov 2014 A R Tarakji, MD, FRCPC 50
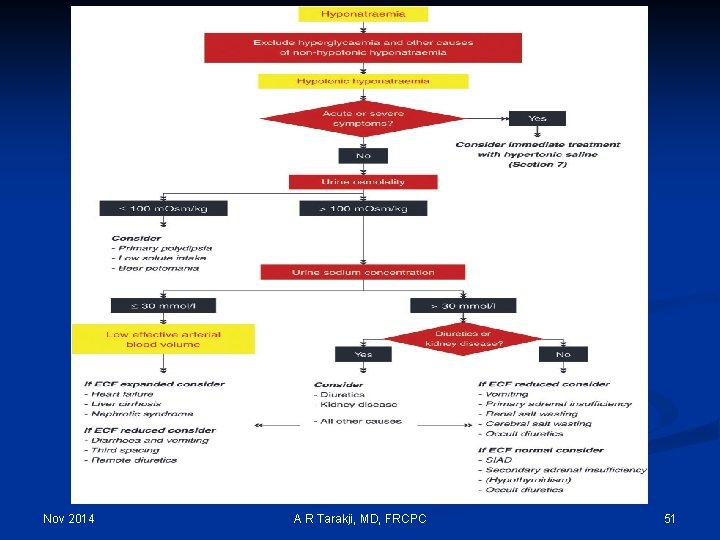
Nov 2014 A R Tarakji, MD, FRCPC 51
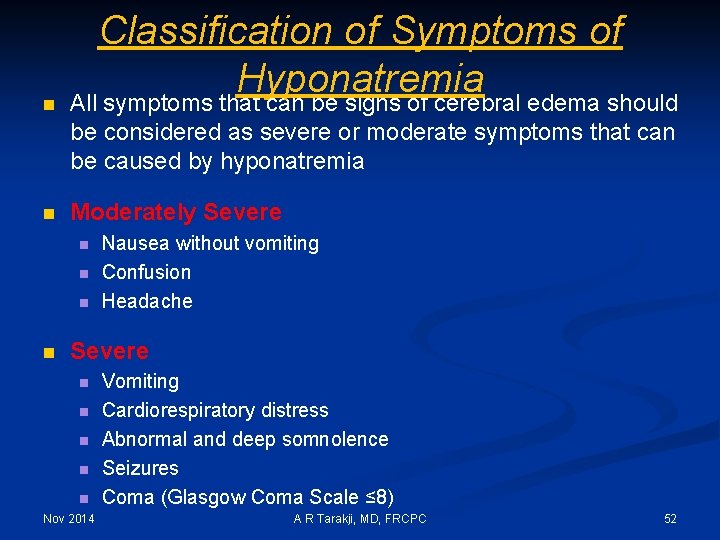
n Classification of Symptoms of Hyponatremia All symptoms that can be signs of cerebral edema should be considered as severe or moderate symptoms that can be caused by hyponatremia n Moderately Severe n n Nausea without vomiting Confusion Headache Severe n n n Nov 2014 Vomiting Cardiorespiratory distress Abnormal and deep somnolence Seizures Coma (Glasgow Coma Scale ≤ 8) A R Tarakji, MD, FRCPC 52
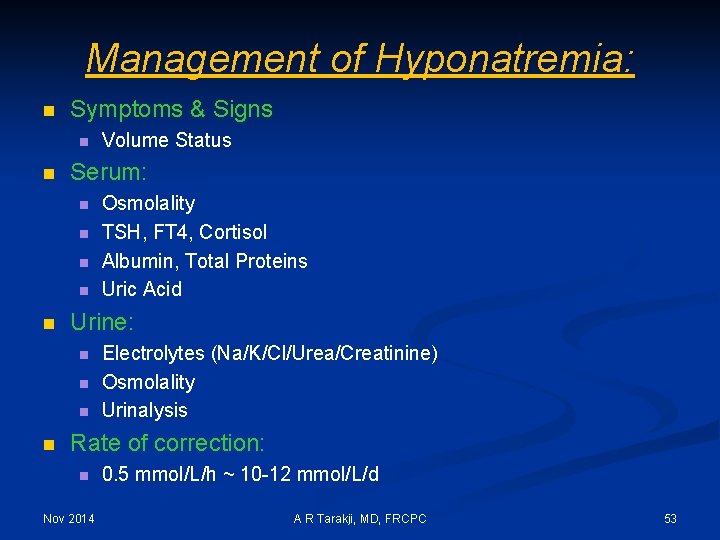
Management of Hyponatremia: n Symptoms & Signs n n Serum: n n n Osmolality TSH, FT 4, Cortisol Albumin, Total Proteins Uric Acid Urine: n n Volume Status Electrolytes (Na/K/Cl/Urea/Creatinine) Osmolality Urinalysis Rate of correction: n Nov 2014 0. 5 mmol/L/h ~ 10 -12 mmol/L/d A R Tarakji, MD, FRCPC 53
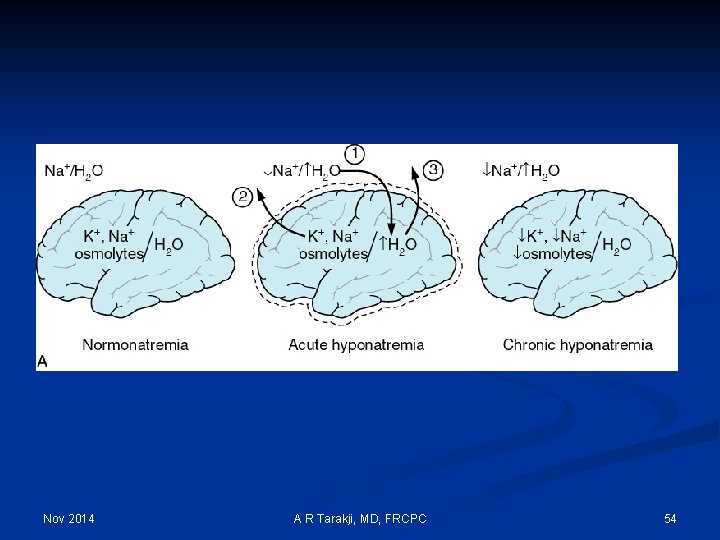
Nov 2014 A R Tarakji, MD, FRCPC 54
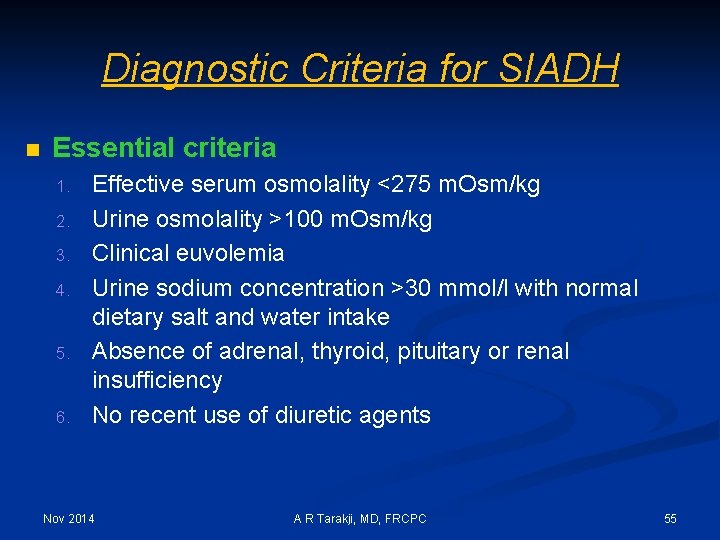
Diagnostic Criteria for SIADH n Essential criteria 1. 2. 3. 4. 5. 6. Effective serum osmolality <275 m. Osm/kg Urine osmolality >100 m. Osm/kg Clinical euvolemia Urine sodium concentration >30 mmol/l with normal dietary salt and water intake Absence of adrenal, thyroid, pituitary or renal insufficiency No recent use of diuretic agents Nov 2014 A R Tarakji, MD, FRCPC 55
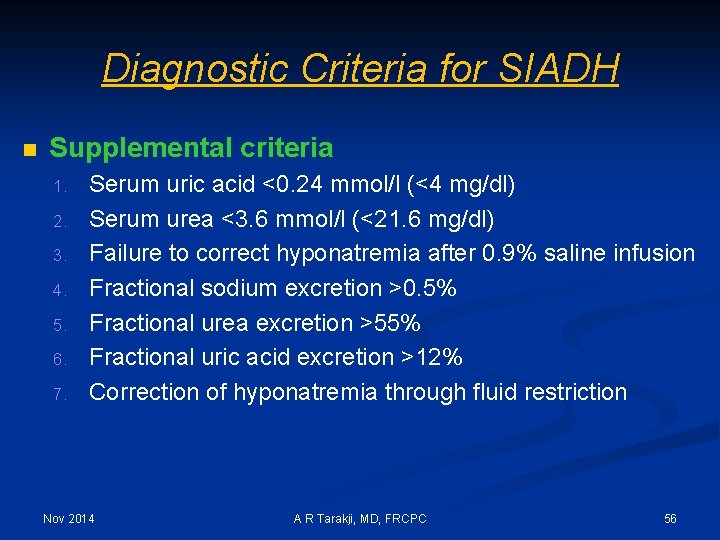
Diagnostic Criteria for SIADH n Supplemental criteria 1. 2. 3. 4. 5. 6. 7. Serum uric acid <0. 24 mmol/l (<4 mg/dl) Serum urea <3. 6 mmol/l (<21. 6 mg/dl) Failure to correct hyponatremia after 0. 9% saline infusion Fractional sodium excretion >0. 5% Fractional urea excretion >55% Fractional uric acid excretion >12% Correction of hyponatremia through fluid restriction Nov 2014 A R Tarakji, MD, FRCPC 56
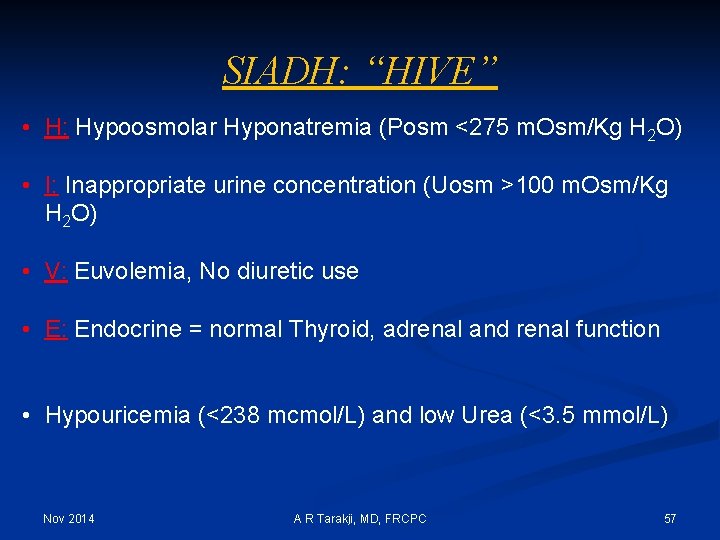
SIADH: “HIVE” • H: Hypoosmolar Hyponatremia (Posm <275 m. Osm/Kg H 2 O) • I: Inappropriate urine concentration (Uosm >100 m. Osm/Kg H 2 O) • V: Euvolemia, No diuretic use • E: Endocrine = normal Thyroid, adrenal and renal function • Hypouricemia (<238 mcmol/L) and low Urea (<3. 5 mmol/L) Nov 2014 A R Tarakji, MD, FRCPC 57
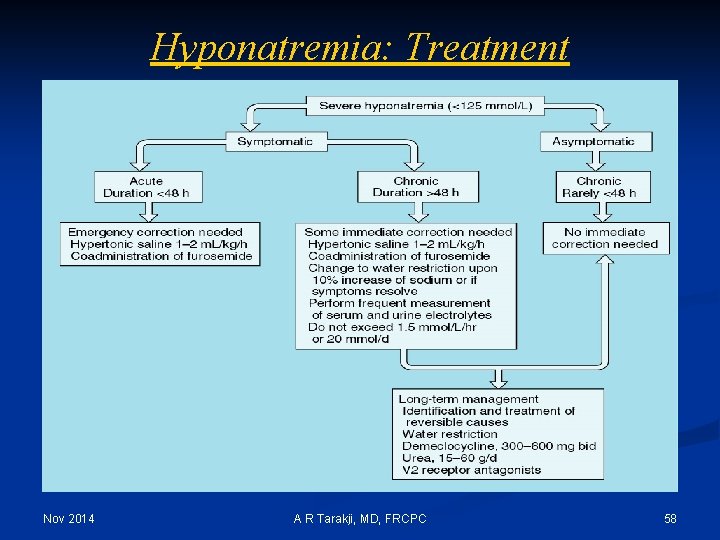
Hyponatremia: Treatment Nov 2014 A R Tarakji, MD, FRCPC 58
Hypernatremia Nov 2014 A R Tarakji, MD, FRCPC 59
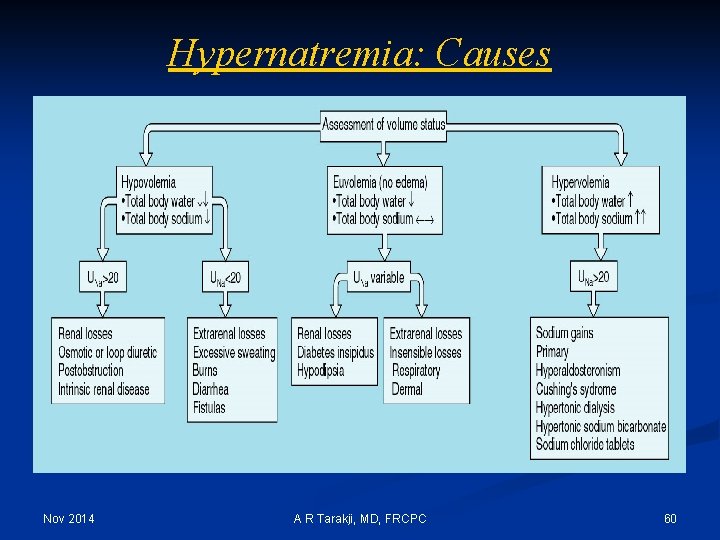
Hypernatremia: Causes Nov 2014 A R Tarakji, MD, FRCPC 60
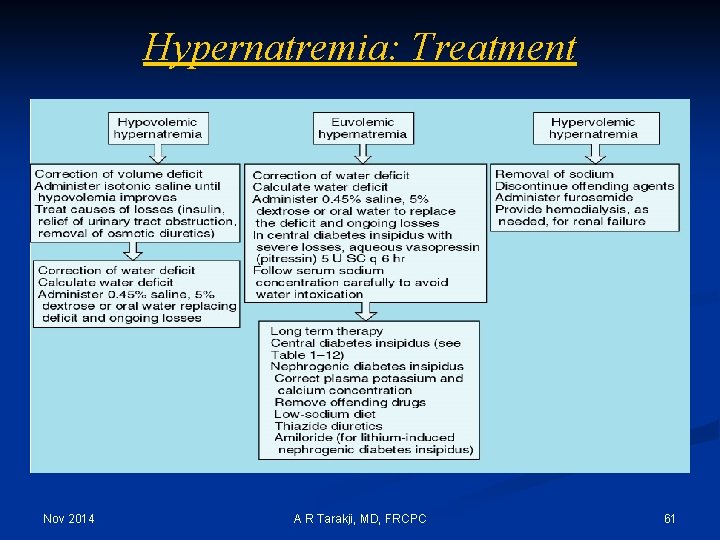
Hypernatremia: Treatment Nov 2014 A R Tarakji, MD, FRCPC 61
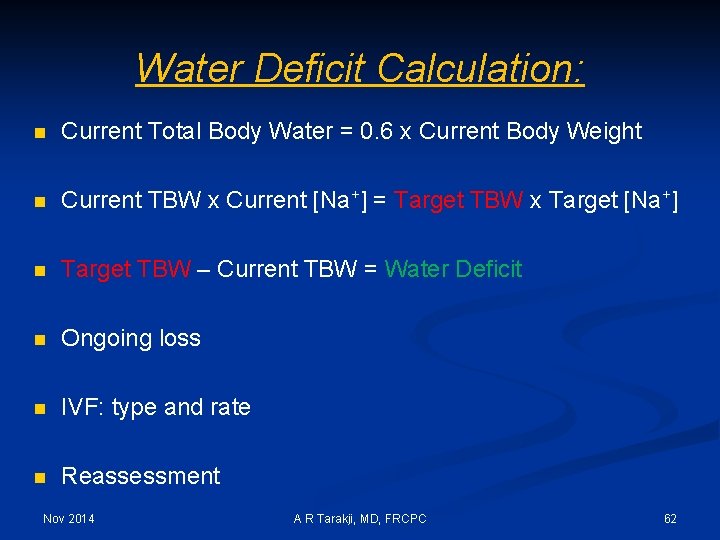
Water Deficit Calculation: n Current Total Body Water = 0. 6 x Current Body Weight n Current TBW x Current [Na+] = Target TBW x Target [Na+] n Target TBW – Current TBW = Water Deficit n Ongoing loss n IVF: type and rate n Reassessment Nov 2014 A R Tarakji, MD, FRCPC 62
Questions? ? Nov 2014 A R Tarakji, MD, FRCPC 63
- Slides: 63