
KSS AHSN COPD Discharge Bundle Project Jo Congleton
KSS AHSN COPD Discharge Bundle Project Jo Congleton Clinical Lead
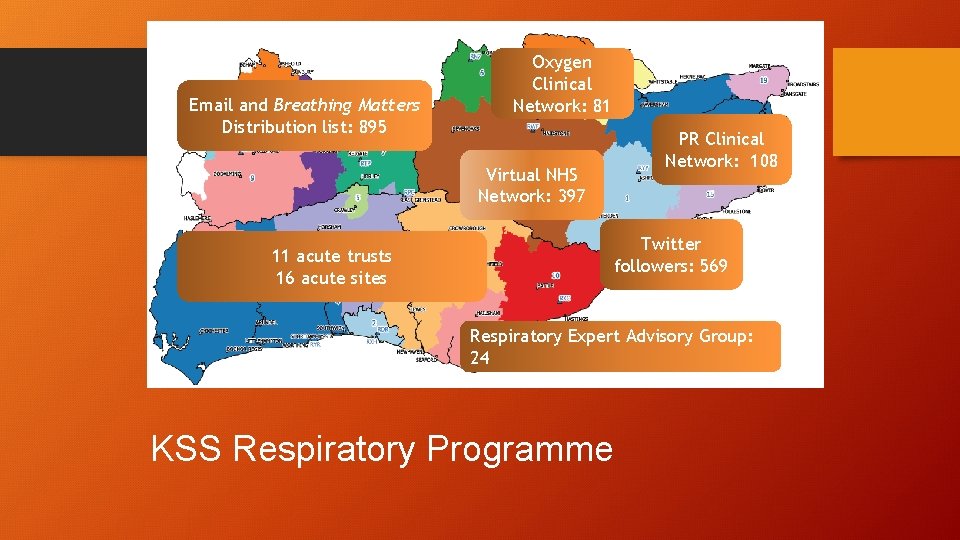
Email and Breathing Matters Distribution list: 895 Oxygen Clinical Network: 81 Virtual NHS Network: 397 PR Clinical Network: 108 Twitter followers: 569 11 acute trusts 16 acute sites Respiratory Expert Advisory Group: 24 KSS Respiratory Programme
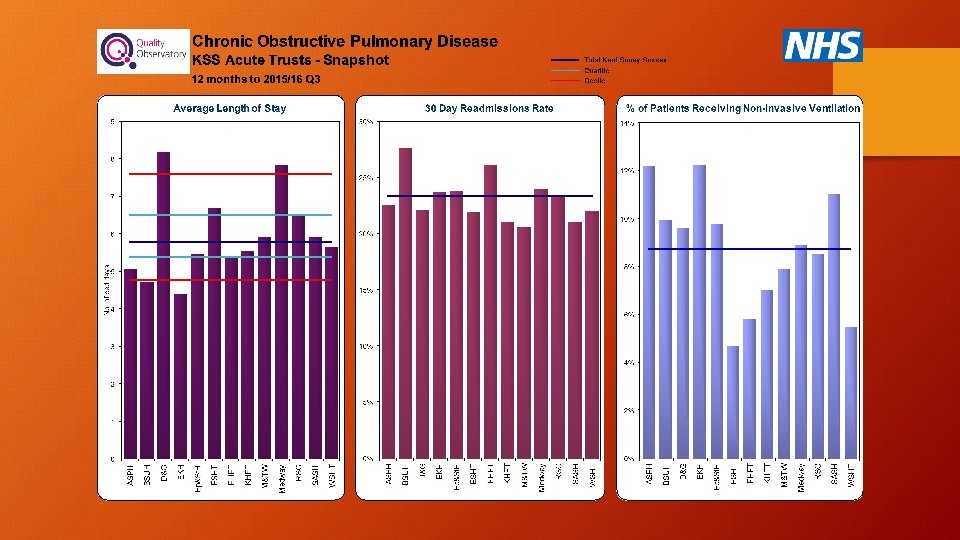
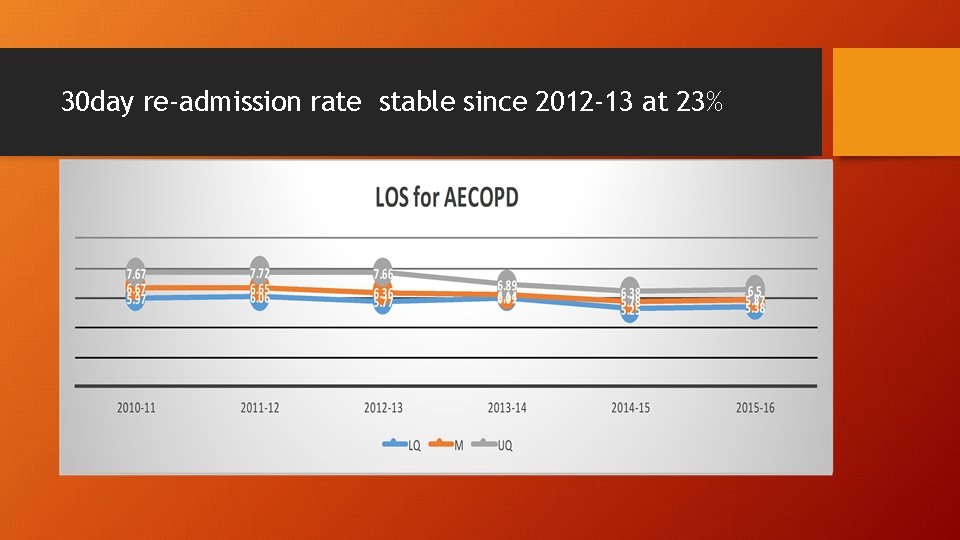
30 day re-admission rate stable since 2012 -13 at 23%
COPD Discharge Bundle Project • Collaborative event to explore enthusiasm for COPD discharge bundle 23/1/2014 • Evidence presented • Proposal to introduce EQ COPD discharge bundle in Kent, Surrey & Sussex - accepted • Wording of Bundle, data dictionary agreed • Reporting tool developed • Data collection commenced October 2014
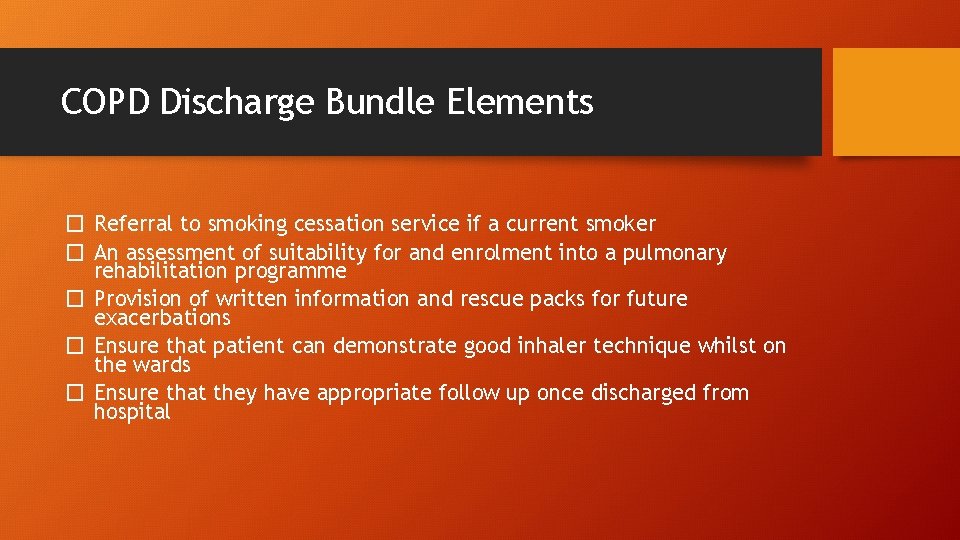
COPD Discharge Bundle Elements � Referral to smoking cessation service if a current smoker � An assessment of suitability for and enrolment into a pulmonary rehabilitation programme � Provision of written information and rescue packs for future exacerbations � Ensure that patient can demonstrate good inhaler technique whilst on the wards � Ensure that they have appropriate follow up once discharged from hospital
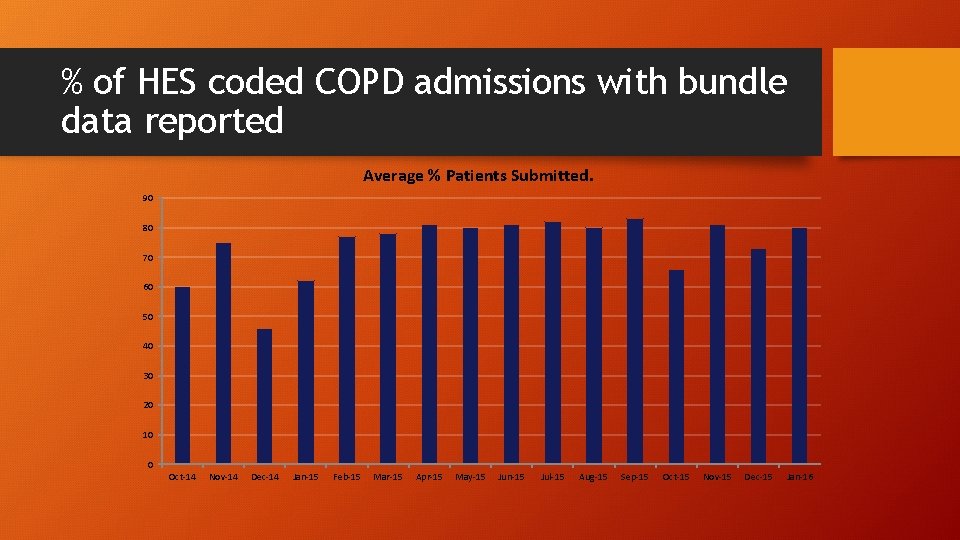
% of HES coded COPD admissions with bundle data reported Average % Patients Submitted. 90 80 70 60 50 40 30 20 10 0 Oct-14 Nov-14 Dec-14 Jan-15 Feb-15 Mar-15 Apr-15 May-15 Jun-15 Jul-15 Aug-15 Sep-15 Oct-15 Nov-15 Dec-15 Jan-16
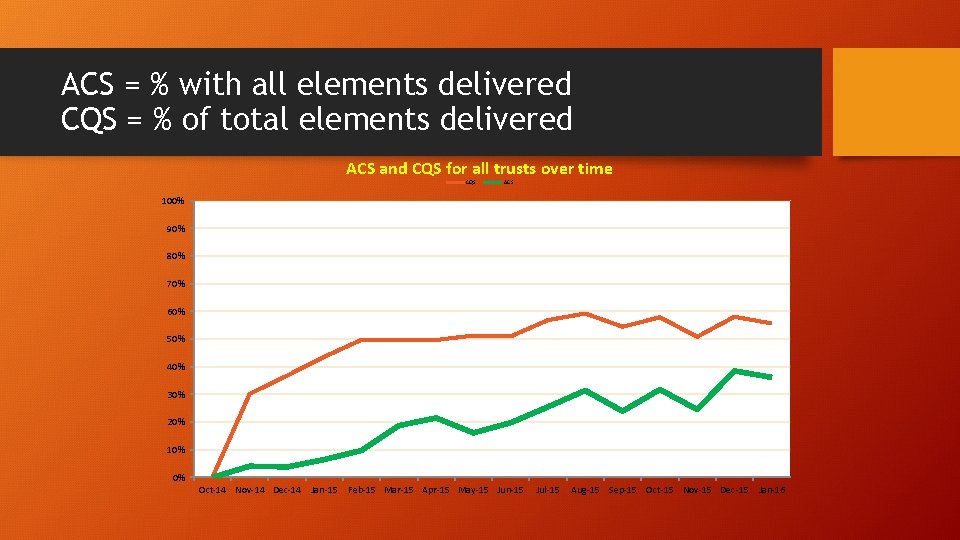
ACS = % with all elements delivered CQS = % of total elements delivered ACS and CQS for all trusts over time CQS ACS 100% 90% 80% 70% 60% 50% 40% 30% 20% 10% 0% Oct-14 Nov-14 Dec-14 Jan-15 Feb-15 Mar-15 Apr-15 May-15 Jun-15 Jul-15 Aug-15 Sep-15 Oct-15 Nov-15 Dec-15 Jan-16
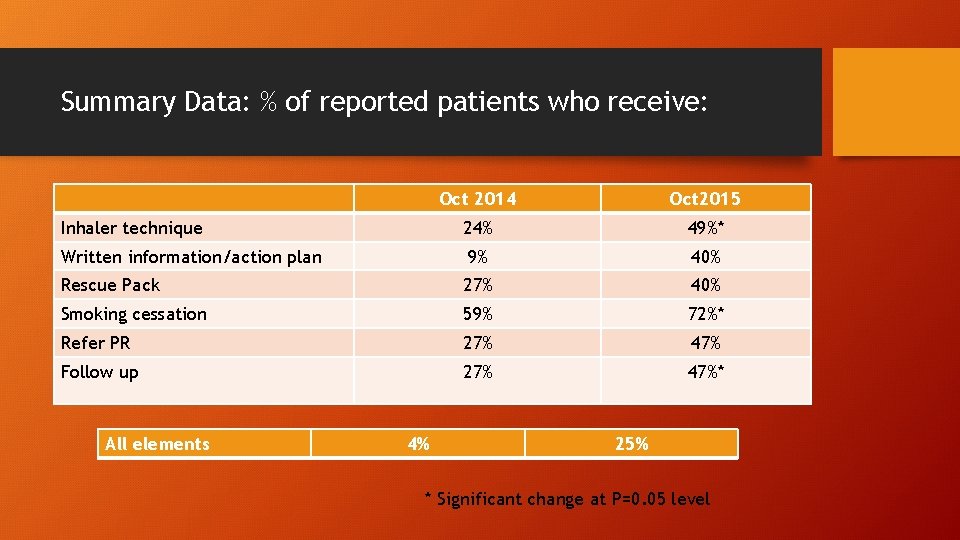
Summary Data: % of reported patients who receive: Oct 2014 Oct 2015 Inhaler technique 24% 49%* Written information/action plan 9% 40% Rescue Pack 27% 40% Smoking cessation 59% 72%* Refer PR 27% 47% Follow up 27% 47%* All elements 4% 25% * Significant change at P=0. 05 level
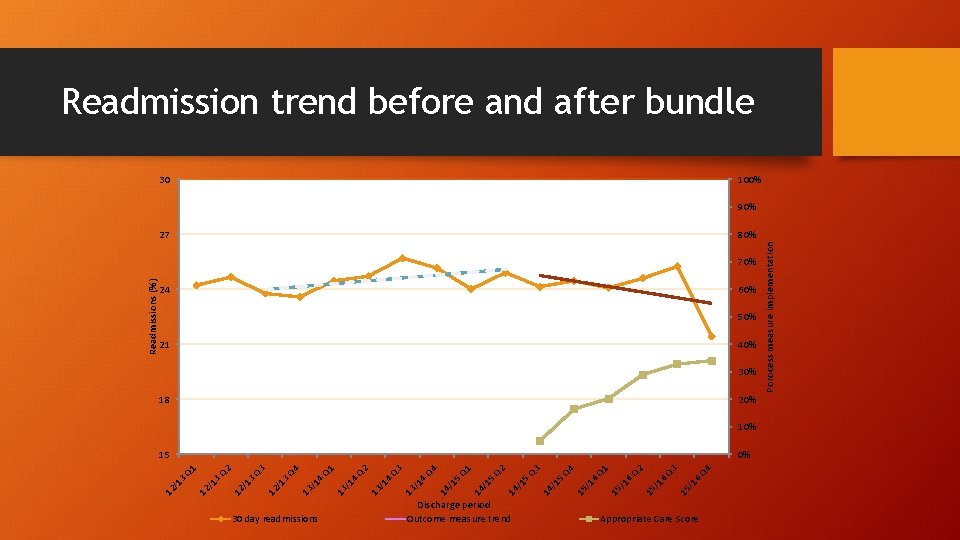
Readmission trend before and after bundle 30 100% 90% 80% Readmissions (%) 70% 24 60% 50% 21 40% 30% 18 20% 10% 30 day readmissions Discharge period Outcome measure trend Q 4 /1 6 Q 3 15 15 /1 6 Q 2 /1 6 15 15 /1 6 Q 1 Q 4 /1 5 14 14 /1 5 Q 3 Q 2 14 /1 5 Q 1 /1 5 14 13 /1 4 Q 3 /1 4 13 13 /1 4 Q 2 Q 1 13 /1 4 Q 4 /1 3 12 /1 /1 3 Q 1 12 /1 3 12 Q 3 0% Q 2 15 Appropriate Care Score Porocess measure implementation 27
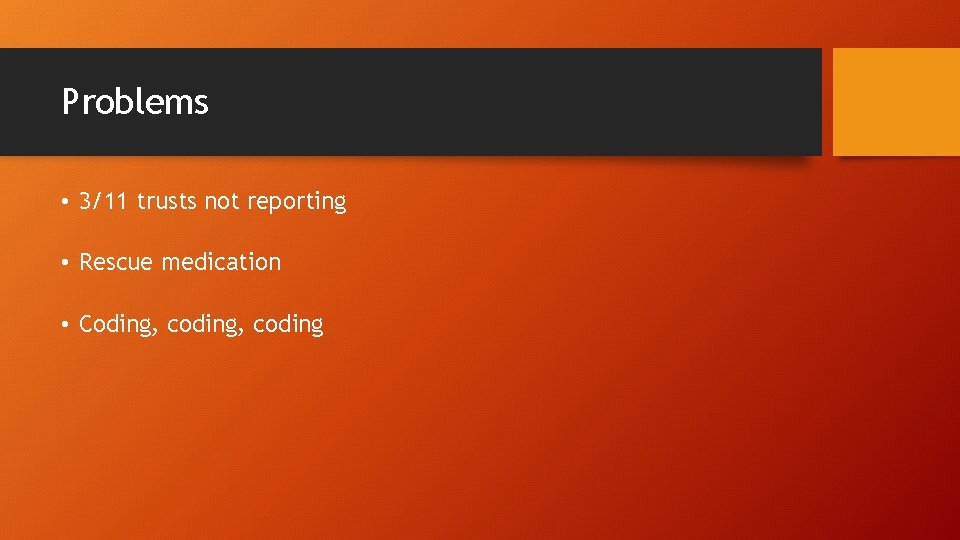
Problems • 3/11 trusts not reporting • Rescue medication • Coding, coding
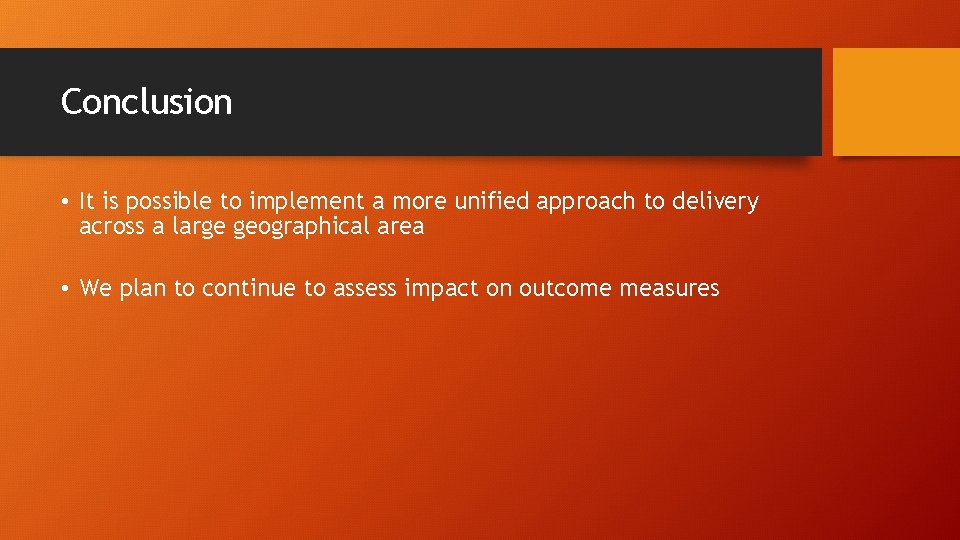
Conclusion • It is possible to implement a more unified approach to delivery across a large geographical area • We plan to continue to assess impact on outcome measures
- Slides: 12