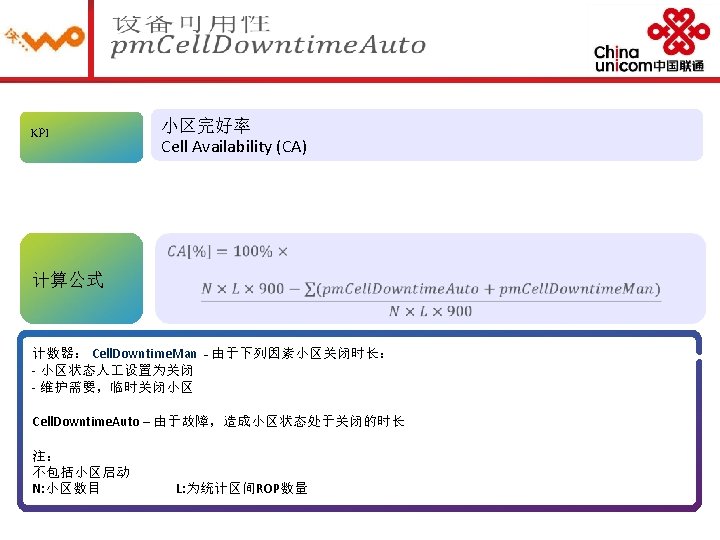
KPI PI RRC ERAB pm Rrc Conn Estab

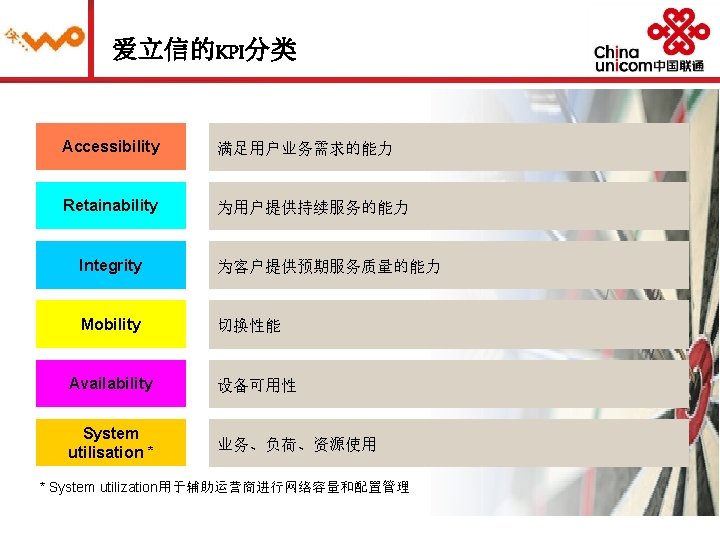

接入性 KPI 无线接通率 PI RRC建立成功率 ERAB建立成功率 计算公式 pm. Rrc. Conn. Estab. Succ: The total number of successful RRC Connection Establishments. pm. Rrc. Conn. Estab. Att: The total number of RRC Connection Request attempts. pm. Rrc. Conn. Estab. Att. Reatt: The total number of RRC Connection Request attempts that are considered as reattempts. pm. Erab. Estab. Succ. Init: The total number of successful initial E-RAB Establishments. pm. Erab. Estab. Succ. Added: The total number of successfully added E-RABs. pm. Erab. Estab. Att. Init: The total number of initial E-RAB Establishment attempts. pm. Erab. Estab. Att. Added: The total number of added E-RAB Establishment attempts.

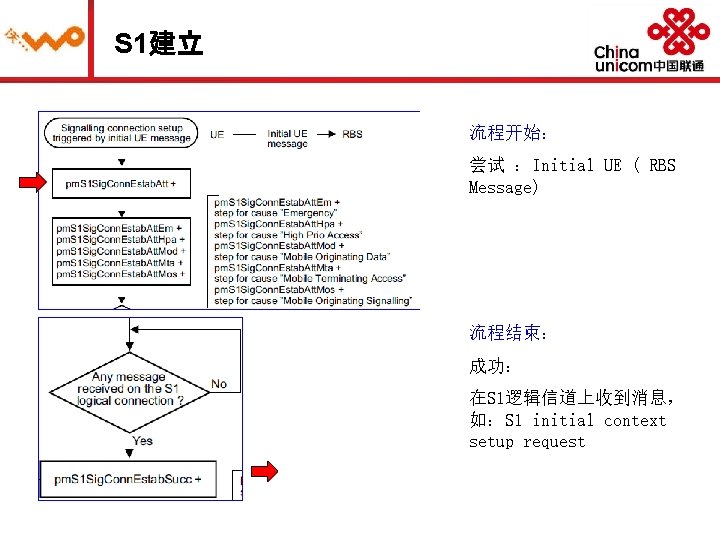
RRC建立 流程开始: 尝试:RRC Connection Request 流程结束: 成功:RRC Connection Setup 失败:RRC Connection Request Rejected
 计算公式 pm. Erab. Rel. Abnormal. Enb.")
保持性 KPI E-RAB掉线率 SARR(Session Abnormal Release Rate ) 计算公式 pm. Erab. Rel. Abnormal. Enb. Act: The total number of abnormal E-RAB Releases per cell initiated by the e. NB and that there was data in either the UL or DL buffer (i. e. active). pm. Erab. Rel. Abnormal. Mme. Act: The total number of E-RAB Releases initiated by the MME considered as abnormal. pm. Erab. Rel. Abnormal. Enb: The total number of abnormal E-RAB Releases triggered by e. NB per cell. pm. Erab. Rel. Normal. Enb: The total number of normal E-RAB Releases triggered by e. NB per cell. pm. Erab. Rel. Mme: The total number of E-RAB Releases per cell initiated by the MME excluding successful handover.

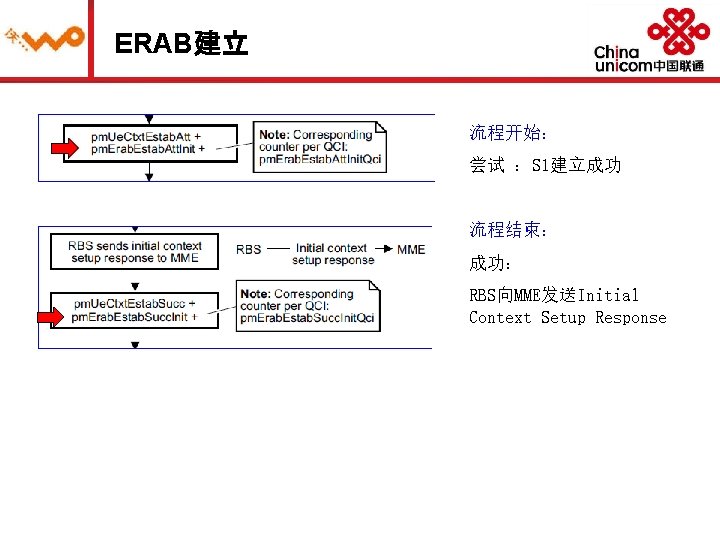
MME发起 l E-RAB Release Procedure – MME Initiated 在Buffer中有数据的非正常释放,才是用户感知的掉话

ENB发起 l E-RAB Release Procedure – e. NB Initiated 在Buffer中有数据的非正常释放,才是用户感知的掉话
 KPI 计算公式 pm. Pdcp. Vol. Drb: 下行方向上总的DRB的流量")
完整性 -基于用户感知的下行速率KPI 下行用户速率 DLUT(Downlink User Throughput ) KPI 计算公式 pm. Pdcp. Vol. Drb: 下行方向上总的DRB的流量 Unit: 1 kilobit (1 000 bits) pm. Pdcp. Vol. Drb. Last. TTI: buffer为空前的最后一个TTI上DRB的流量 Unit: 1 kilobit (1 000 bits) pm. Ue. Thp. Time. Dl: 下行有效的传输时间,从buffer里第一个PDCPSDU在Uu口 上发送到最后buffer为空为止,其中去除buffer为空前的一个TTI. Unit: 1 ms

 计算公式 pm. Ue. Thp. Vol. Ul: 上行方向上总的DRB的流量")
完整性 -基于用户感知的上行速率KPI 上行用户速率 ULUT(Uplink User Throughput ) 计算公式 pm. Ue. Thp. Vol. Ul: 上行方向上总的DRB的流量 Unit: 1 kilobit (1 000 bits) pm. Ue. Thp. Time. Ul: 上行有效传输时间 Unit: 1 ms
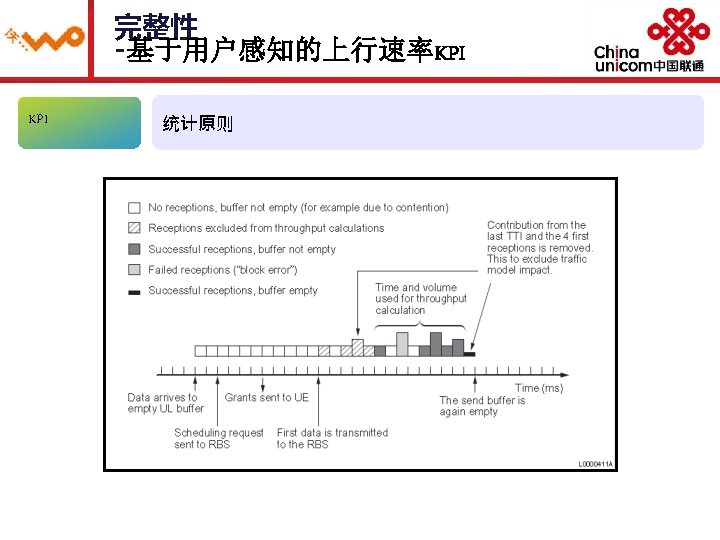
 计算公式")
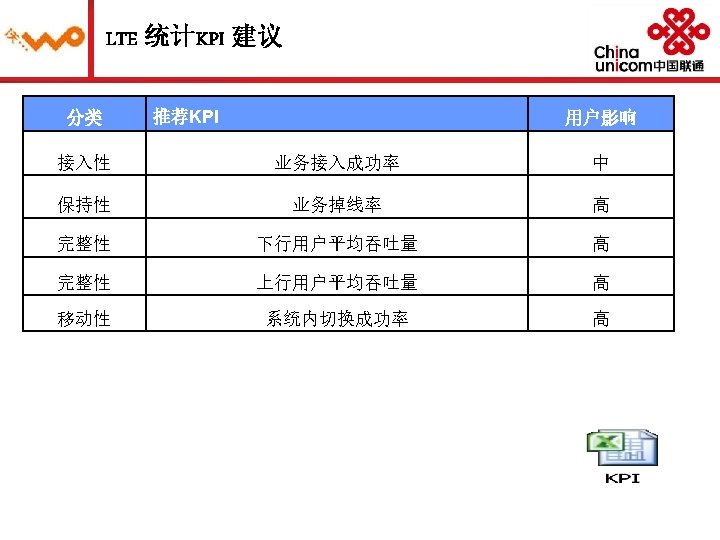
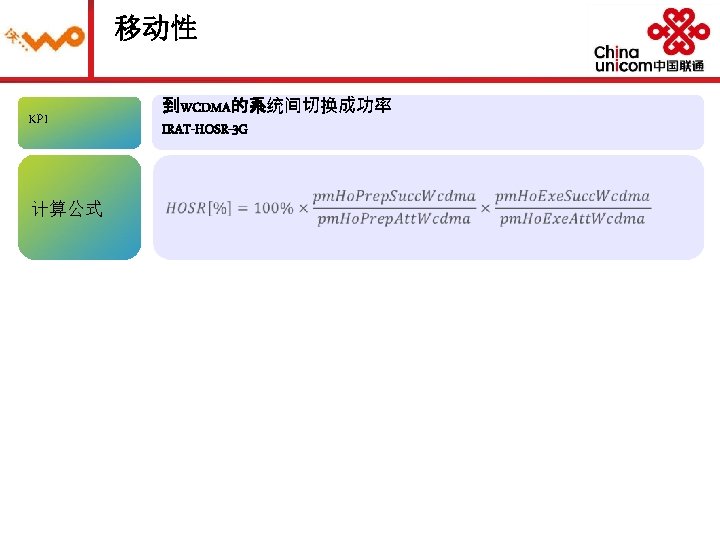
移动性 KPI 系统内切换成功率 HOSR(Intra-LTE Handover Success Rate ) 计算公式

资源利用类 l System Load l Downlink Volume l Uplink Volume l Active UEs l Average number of simultaneous E-RABs l UE Session Time l Physical Resources l PRB utilization l Processor Load l MP Load

System Load Downlink Volume PI 计数器 Ø pm. Pdcp. Vol. Drb Unit: 1 kilobit (1 000 bits) The total volume (PDCP SDU) on Data Radio Bearers that has been transmitted in the downlink direction in the PDCP layer. Ø pm. Pdcp. Vol. Dl. Srb Unit: 1 kilobit (1 000 bits) The total volume (PDCP SDU) on Signaling Radio Bearers that has been transmitted in the downlink direction in the PDCP layer. Uplink Volume PI 计数器 Ø pm. Pdcp. Vol. Ul. Drb Unit: 1 kilobit (1 000 bits) The total volume (PDCP SDU) on Data Radio Bearers that has been received in the uplink direction. Ø pm. Pdcp. Vol. Ul. Srb Unit: 1 kilobit (1 000 bits) The total number of bits (PDCP SDU) on Signaling Radio Bearers that has been transferred (acknowledged by the RBS) in the uplink direction.

System Load PI Number of Active Users 计数器: Ø pm. Active. Ue. Dl. Sum: Number of UEs with DRB data to send in the downlink direction. Aggregates for each TTI Ø pm. Active. Ul. Sum: Number of UEs with buffer status reports indicating DRB data to be sent in the uplink direction. Aggregates for each TTI

System Load l Average number of simultaneous E-RABs l pm. Erab. Lev. Sum l pm. Erab. Lev. Sampling rate: 5 seconds 计数器: Ø pm. Erab. Lev. Sum of all sample values recorded for Number of simultaneous E-RABs Ø pm. Erab. Lev. Samp Counts the number of times the corresponding Sum counters has been incremented.

System Load PI Session Time 计数器: Ø pm. Session. Time. Ue: Unit: 1 s Number of session seconds aggregated for UEs in a cell. A UE is said to be “in session” if any data on a DRB (UL or DL) has been transferred during the last 100 ms Ø pm. Session. Time. Drb:Unit: 1 s Number of session seconds aggregated for DRBs in a cell. A DRB is said to be “in session” if any data on a DRB (UL or DL) has been transferred during the last 100 ms

资源利用率 PI PRB Utilization 计数器: Ø pm. Prb. Util. Dl:PDF A distribution that shows the downlink Physical Resource Block (PRB) pair utilization (total number of used PRB pairs by available PRB pairs) on the Physical Downlink Shared Channel (PDSCH). Ø pm. Prb. Util. Ul:PDF A distribution that shows the uplink Physical Resource Block (PRB) pair utilization (total number of used PRB pairs by available PRB pairs) on the Physical Uplink Shared Channel (PUSCH).
![MP Load PI Mp Load Distribution pm. Processor. Load. Distr PDF ranges: [0]: 0](http://slidetodoc.com/presentation_image_h/c5fd227703ef6b2cfa637ddf653592c6/image-26.jpg "MP Load PI Mp Load Distribution pm. Processor. Load. Distr PDF ranges: [0]: 0")
MP Load PI Mp Load Distribution pm. Processor. Load. Distr PDF ranges: [0]: 0 <= Cpu Load < 20 % [1]: 20 <= Cpu Load < 30 % [2]: 30 <= Cpu Load < 40 % [3]: 40 <= Cpu Load < 50 % [4]: 50 <= Cpu Load < 60 % [5]: 60 <= Cpu Load < 70 % [6]: 70 <= Cpu Load < 80 % [7]: 80 <= Cpu Load < 85 % [8]: 85 <= Cpu Load < 90 % [9]: 90 <= Cpu Load < 95 % [10]: 95 <= Cpu Load Condition: Automatic and continuous measurement, where a sample for the distribution is obtained every 10 seconds. t(10 sec)
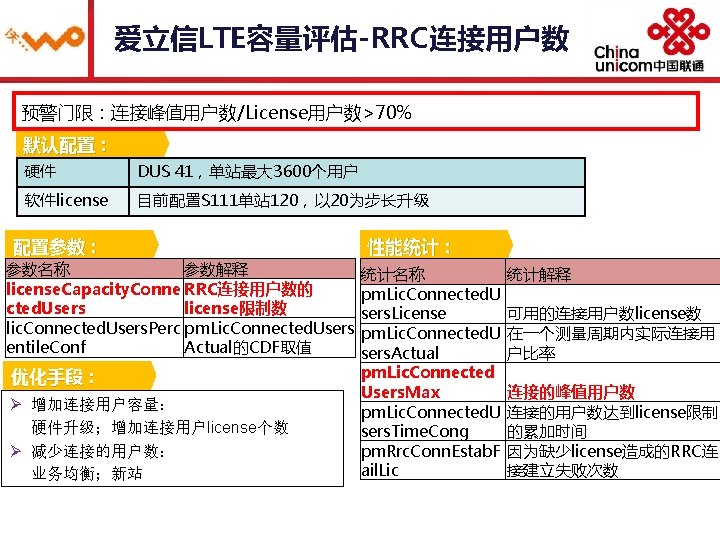

计数器: pm. Lic. Connected. Users. Actua 29 29

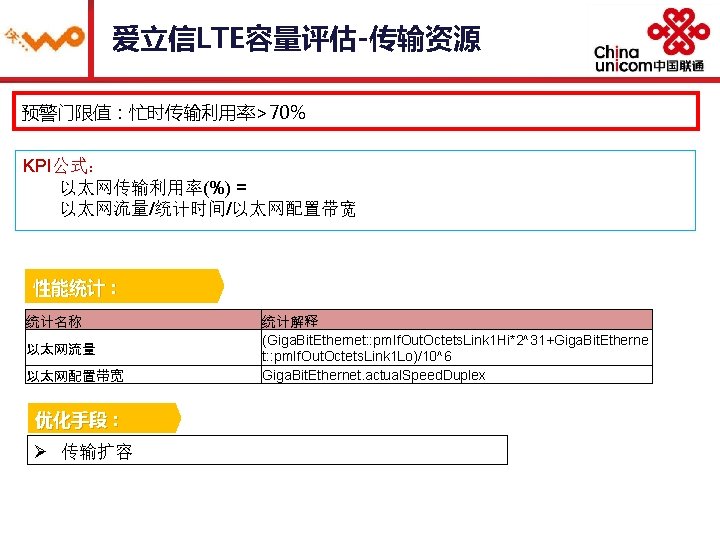
爱立信LTE容量评估-设备资源 u 基带板CPU占用率: CPU负荷状态 >98% 过负荷 90% ~ 98% 超负荷 70% ~ 89% 高负荷 < 70% 正常负荷 Condition: Automatic and continuous measurement, where a sample for the distribution is obtained every 10 seconds. 当前配置: 硬件 DUS 41,目前的硬件配置不会出现主处理器负荷过高问题 性能统计: 统计名称 pm. Processor. Load. Distr PDF ranges: [0]: 0 <= Cpu Load < 20 % [1]: 20 <= Cpu Load < 30 % [2]: 30 <= Cpu Load < 40 % [3]: 40 <= Cpu Load < 50 % [4]: 50 <= Cpu Load < 60 % [5]: 60 <= Cpu Load < 70 % [6]: 70 <= Cpu Load < 80 % [7]: 80 <= Cpu Load < 85 % [8]: 85 <= Cpu Load < 90 % [9]: 90 <= Cpu Load < 95 % [10]: 95 <= Cpu Load 统计解释 pm. Processor. Load. Distr CPU负荷分布


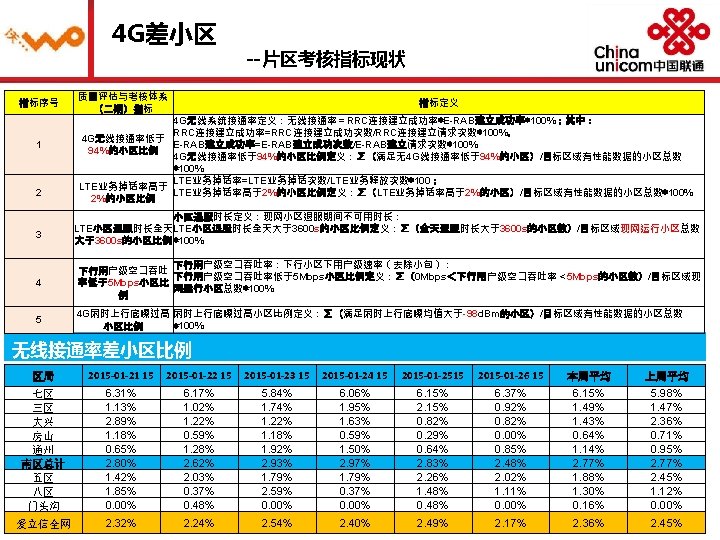
4 G整体指标情况 --无线接通率 q本周南区无线接通率从上周平均97. 85% 上升至 98. 41%,全网无线接通率从上周 平均96. 22%上升至 97. 17% q本周除三区、八区、通州外,其他区局无 线接通率均有所提升 q爱立信整网无线接通率97. 17%,暂落后 于华为的99. 39% 无线接通率 1/22/2015 1/23/2015 1/25/2015 1/26/2015 1/27/2015 1/28/2015 上周平均 本周平均 大兴 房山 七区 三区 通州 五区 八区 门头沟 99. 06% 97. 84% 97. 15% 99. 47% 98. 59% 97. 48% 99. 72% 99. 92% 99. 01% 98. 19% 98. 01% 99. 01% 98. 70% 97. 09% 99. 56% 99. 95% 98. 89% 99. 29% 97. 89% 99. 24% 98. 39% 98. 19% 99. 51% 99. 93% 98. 35% 98. 95% 97. 56% 99. 42% 98. 88% 93. 90% 99. 54% 99. 90% 98. 27% 99. 24% 97. 67% 99. 13% 98. 75% 84. 46% 99. 61% 99. 93% 98. 29% 98. 64% 97. 68% 99. 02% 98. 91% 98. 56% 99. 18% 99. 90% 97. 27% 98. 15% 96. 70% 99. 22% 98. 80% 93. 50% 99. 55% 99. 88% 98. 65% 98. 72% 97. 67% 99. 21% 98. 69% 94. 52% 99. 92% 爱立信南区 98. 26% 98. 51% 98. 52% 98. 44% 98. 38% 98. 35% 97. 85% 98. 41% 华为全网 99. 51% 99. 29% 99. 33% 99. 21% 99. 40% 99. 56% 99. 39% 爱立信全网 98. 07% 98. 49% 96. 90% 93. 34% 98. 43% 96. 22% 97. 17%

4 G整体指标情况 --切换成功率 q本周南区切换成功率从上周平均96. 87% 上升至 97. 25%,全网切换成功率从上周 平均96. 89%上升至 97. 32% q本周除房山、门头沟外,其他区局相比上 周切换成功率均有所提高 q爱立信全网切换成功率97. 32%,暂落后 于华为的98. 93% 切换成功率 1/22/2015 1/23/2015 1/25/2015 1/26/2015 1/27/2015 1/28/2015 上周平均 本周平均 大兴 房山 七区 三区 通州 五区 八区 门头沟 96. 64% 99. 30% 96. 83% 96. 44% 98. 04% 96. 94% 98. 54% 99. 10% 96. 99% 99. 09% 97. 04% 97. 31% 98. 18% 96. 93% 98. 39% 99. 20% 96. 77% 99. 16% 97. 23% 97. 43% 98. 21% 96. 73% 98. 48% 99. 25% 96. 52% 99. 00% 96. 86% 96. 89% 98. 24% 97. 19% 98. 16% 99. 12% 97. 13% 99. 11% 96. 73% 97. 23% 98. 31% 97. 61% 98. 39% 99. 13% 96. 86% 99. 10% 96. 85% 97. 33% 98. 33% 97. 47% 98. 39% 99. 13% 96. 64% 99. 13% 96. 91% 96. 23% 97. 92% 96. 76% 98. 31% 99. 16% 96. 83% 99. 13% 96. 93% 97. 12% 98. 22% 97. 15% 98. 39% 99. 16% 爱立信南区 96. 92% 97. 37% 97. 50% 97. 12% 97. 23% 97. 29% 96. 87% 97. 25% 华为全网 98. 82% 98. 97% 98. 93% 98. 91% 98. 97% 98. 99% 98. 93% 爱立信全网 97. 08% 97. 33% 97. 39% 97. 25% 97. 44% 96. 89% 97. 32%

4 G差小区 --片区考核指标现状 LTE业务掉话率差小区比例 区局 2015 -01 -21 15 2015 -01 -22 15 2015 -01 -23 15 2015 -01 -24 15 2015 -01 -2515 2015 -01 -26 15 本周平均 上周平均 七区 三区 大兴 房山 通州 南区总计 五区 八区 门头沟 6. 97% 0. 92% 2. 89% 0. 00% 0. 86% 2. 84% 2. 72% 1. 85% 0. 00% 5. 84% 0. 82% 1. 63% 0. 30% 0. 43% 2. 32% 2. 50% 2. 22% 0. 00% 7. 28% 0. 72% 3. 67% 0. 30% 1. 07% 3. 00% 2. 03% 0. 74% 0. 00% 6. 39% 1. 13% 3. 27% 0. 30% 0. 64% 2. 76% 2. 38% 0. 74% 0. 00% 6. 92% 0. 92% 3. 67% 0. 00% 0. 85% 2. 89% 2. 61% 0. 74% 0. 00% 6. 48% 0. 72% 2. 04% 0. 29% 0. 43% 2. 52% 2. 61% 1. 48% 0. 00% 6. 65% 0. 87% 2. 86% 0. 20% 0. 71% 2. 72% 2. 48% 1. 30% 0. 00% 6. 22% 0. 91% 2. 83% 0. 08% 0. 95% 2. 62% 3. 31% 0. 90% 0. 14% 爱立信全网 2. 59% 2. 24% 2. 50% 2. 52% 2. 59% 2. 42% 2. 48% 2. 50% LTE退服时长小区比例 区局 2015 -01 -21 15 2015 -01 -22 15 2015 -01 -23 15 2015 -01 -24 15 2015 -01 -2515 2015 -01 -26 15 本周平均 上周平均 七区 三区 大兴 房山 通州 南区总计 五区 八区 门头沟 0. 22% 0. 00% 1. 48% 0. 22% 0. 27% 0. 36% 0. 00% 0. 31% 0. 00% 0. 59% 0. 00% 0. 17% 0. 00% 0. 11% 0. 00% 0. 82% 0. 00% 0. 21% 0. 14% 0. 00% 0. 11% 0. 00% 0. 82% 0. 00% 0. 10% 0. 00% 1. 11% 1. 44% 0. 00% 0. 20% 0. 00% 0. 07% 0. 12% 0. 00% 0. 33% 0. 10% 0. 00% 0. 21% 0. 17% 0. 12% 0. 74% 0. 00% 0. 13% 0. 10% 0. 27% 0. 34% 0. 11% 0. 15% 0. 10% 0. 31% 0. 24% 0. 17% 0. 00% 0. 13% 0. 09% 0. 11% 0. 14% 0. 37% 0. 00% 爱立信全网 0. 25% 0. 12% 0. 09% 0. 21% 0. 07% 0. 18% 0. 15% 0. 12%

4 G差小区 --片区考核指标现状 下行低速率小区比例 区局 2015 -01 -21 15 2015 -01 -22 15 2015 -01 -23 15 2015 -01 -24 15 2015 -01 -2515 2015 -01 -26 15 本周平均 上周平均 七区 三区 大兴 房山 通州 南区总计 五区 八区 门头沟 2. 10% 0. 92% 0. 41% 0. 59% 1. 26% 0. 12% 1. 48% 0. 96% 0. 66% 0. 92% 2. 04% 0. 30% 2. 14% 1. 06% 0. 83% 2. 22% 0. 96% 0. 77% 1. 33% 0. 82% 1. 18% 1. 50% 1. 12% 0. 60% 1. 48% 2. 39% 1. 32% 0. 82% 2. 04% 0. 59% 1. 71% 1. 19% 0. 48% 1. 11% 0. 00% 1. 43% 1. 13% 2. 45% 0. 88% 1. 28% 1. 33% 0. 95% 0. 37% 1. 44% 1. 54% 1. 02% 1. 22% 1. 77% 1. 07% 1. 29% 0. 83% 1. 11% 0. 48% 1. 30% 1. 02% 1. 50% 0. 89% 1. 50% 1. 21% 0. 63% 1. 30% 1. 04% 1. 27% 1. 09% 1. 47% 1. 18% 1. 87% 1. 31% 0. 69% 1. 12% 0. 69% 爱立信全网 1. 02% 1. 06% 1. 09% 0. 97% 1. 18% 1. 15% 1. 08% 1. 13% 底噪高小区比例 区局 2015 -01 -21 15 2015 -01 -22 15 2015 -01 -23 15 2015 -01 -24 15 2015 -01 -2515 2015 -01 -26 15 本周平均 上周平均 七区 三区 大兴 房山 通州 南区总计 五区 八区 门头沟 28. 76% 7. 99% 9. 50% 0. 89% 4. 95% 13. 23% 12. 31% 9. 26% 0. 48% 29. 00% 7. 99% 10. 20% 2. 07% 7. 69% 13. 94% 12. 75% 9. 63% 0. 96% 28. 22% 7. 99% 9. 80% 1. 48% 6. 84% 13. 46% 12. 99% 9. 63% 0. 96% 28. 22% 7. 48% 11. 02% 1. 48% 6. 41% 13. 33% 12. 63% 9. 26% 2. 39% 27. 14% 7. 68% 9. 39% 1. 18% 5. 77% 12. 80% 12. 95% 10. 37% 0. 96% 28. 24% 8. 30% 9. 80% 1. 47% 6. 41% 13. 51% 13. 06% 11. 11% 0. 96% 28. 26% 7. 91% 9. 95% 1. 43% 6. 35% 13. 38% 12. 78% 9. 88% 1. 12% 27. 36% 8. 71% 9. 96% 2. 10% 5. 95% 13. 36% 12. 71% 10. 09% 0. 83% 爱立信全网 12. 04% 12. 67% 12. 30% 11. 98% 12. 53% 12. 32% 12. 27%

- Slides: 62