
KirchhoffInstitut fr Physik Biophotonics I W Petrich Slides
Kirchhoff-Institut für Physik Biophotonics I W. Petrich Slides of lecture #6 November 18 th, 2017 http: //www. kip. uni-heidelberg. de/biophotonik/teaching • Lecture „Biophotonics I“ will be credited with 2 CP subject to successfully passing the exam • There will be a written exam („Klausur“) on February 3 rd 2020 • there will be NO lecture on December 2 nd, 2019 Prof. Dr. Petrich Biophotonics I (WS 2019/20) 1
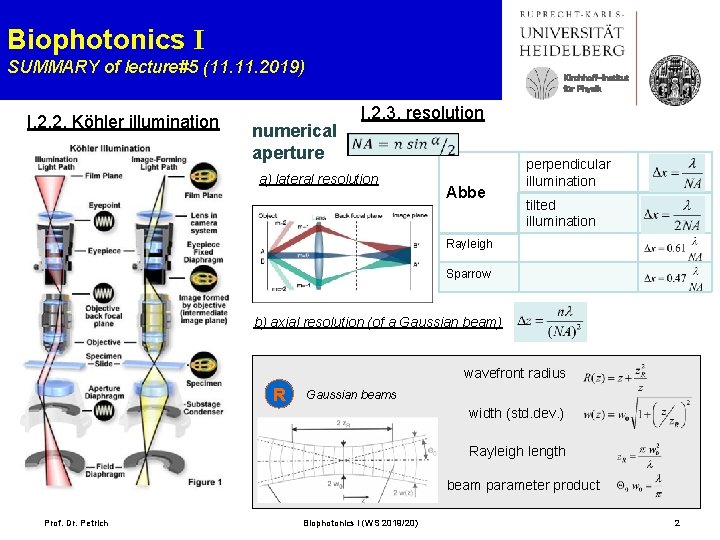
Biophotonics I SUMMARY of lecture#5 (11. 2019) I. 2. 2. Köhler illumination Kirchhoff-Institut für Physik numerical aperture I. 2. 3. resolution a) lateral resolution Abbe perpendicular illumination tilted illumination Rayleigh Sparrow b) axial resolution (of a Gaussian beam) wavefront radius R Gaussian beams width (std. dev. ) Rayleigh length beam parameter product Prof. Dr. Petrich Biophotonics I (WS 2019/20) 2
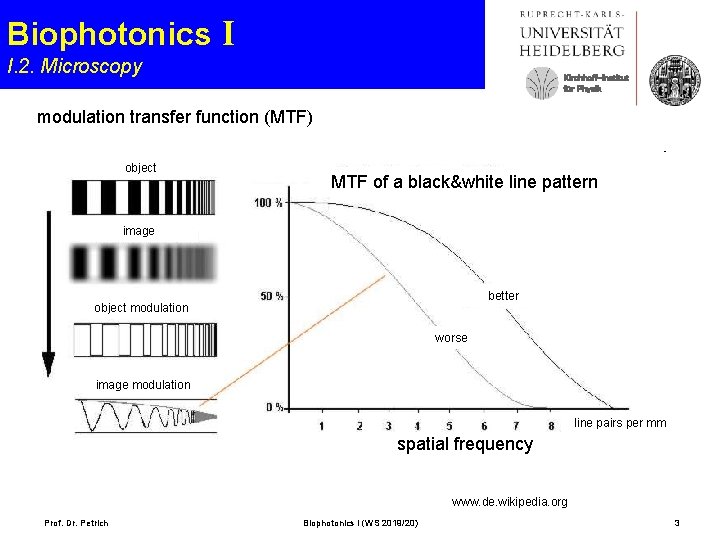
Biophotonics I I. 2. Microscopy Kirchhoff-Institut für Physik modulation transfer function (MTF) object MTF of a black&white line pattern image better object modulation worse image modulation line pairs per mm spatial frequency www. de. wikipedia. org Prof. Dr. Petrich Biophotonics I (WS 2019/20) 3
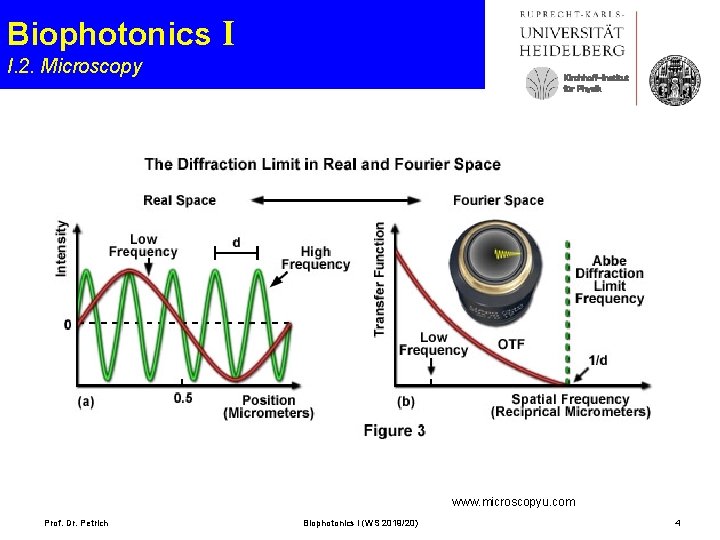
Biophotonics I I. 2. Microscopy Kirchhoff-Institut für Physik www. microscopyu. com Prof. Dr. Petrich Biophotonics I (WS 2019/20) 4
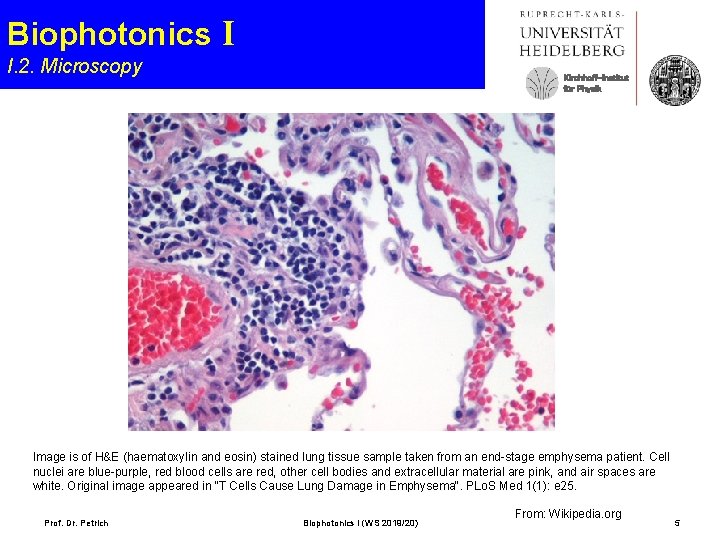
Biophotonics I I. 2. Microscopy Kirchhoff-Institut für Physik Image is of H&E (haematoxylin and eosin) stained lung tissue sample taken from an end-stage emphysema patient. Cell nuclei are blue-purple, red blood cells are red, other cell bodies and extracellular material are pink, and air spaces are white. Original image appeared in "T Cells Cause Lung Damage in Emphysema". PLo. S Med 1(1): e 25. Prof. Dr. Petrich Biophotonics I (WS 2019/20) From: Wikipedia. org 5
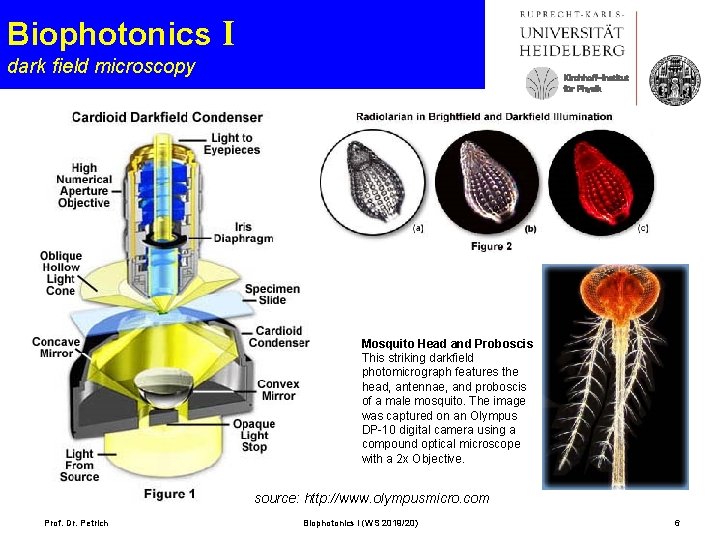
Biophotonics I dark field microscopy Kirchhoff-Institut für Physik Mosquito Head and Proboscis This striking darkfield photomicrograph features the head, antennae, and proboscis of a male mosquito. The image was captured on an Olympus DP-10 digital camera using a compound optical microscope with a 2 x Objective. source: http: //www. olympusmicro. com Prof. Dr. Petrich Biophotonics I (WS 2019/20) 6
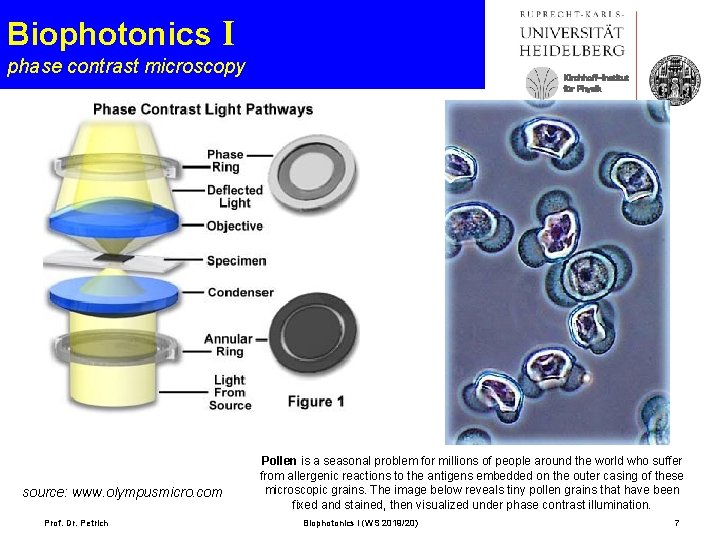
Biophotonics I phase contrast microscopy source: www. olympusmicro. com Prof. Dr. Petrich Kirchhoff-Institut für Physik Pollen is a seasonal problem for millions of people around the world who suffer from allergenic reactions to the antigens embedded on the outer casing of these microscopic grains. The image below reveals tiny pollen grains that have been fixed and stained, then visualized under phase contrast illumination. Biophotonics I (WS 2019/20) 7
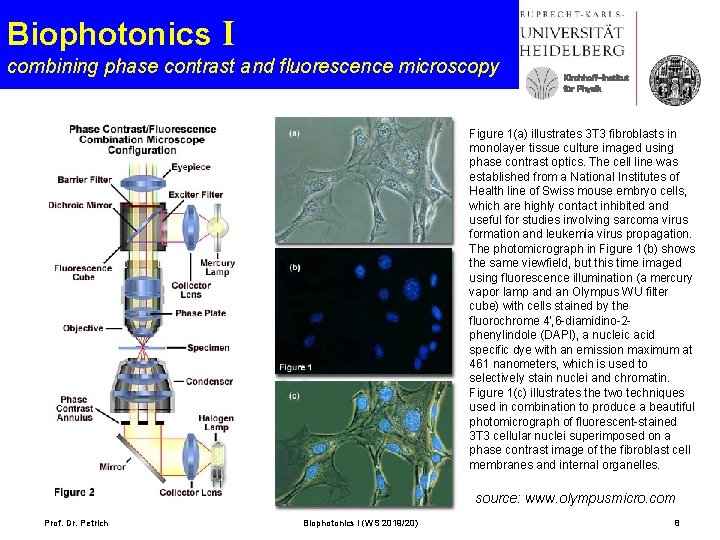
Biophotonics I combining phase contrast and fluorescence microscopy Kirchhoff-Institut für Physik Figure 1(a) illustrates 3 T 3 fibroblasts in monolayer tissue culture imaged using phase contrast optics. The cell line was established from a National Institutes of Health line of Swiss mouse embryo cells, which are highly contact inhibited and useful for studies involving sarcoma virus formation and leukemia virus propagation. The photomicrograph in Figure 1(b) shows the same viewfield, but this time imaged using fluorescence illumination (a mercury vapor lamp and an Olympus WU filter cube) with cells stained by the fluorochrome 4', 6 -diamidino-2 phenylindole (DAPI), a nucleic acid specific dye with an emission maximum at 461 nanometers, which is used to selectively stain nuclei and chromatin. Figure 1(c) illustrates the two techniques used in combination to produce a beautiful photomicrograph of fluorescent-stained 3 T 3 cellular nuclei superimposed on a phase contrast image of the fibroblast cell membranes and internal organelles. source: www. olympusmicro. com Prof. Dr. Petrich Biophotonics I (WS 2019/20) 8
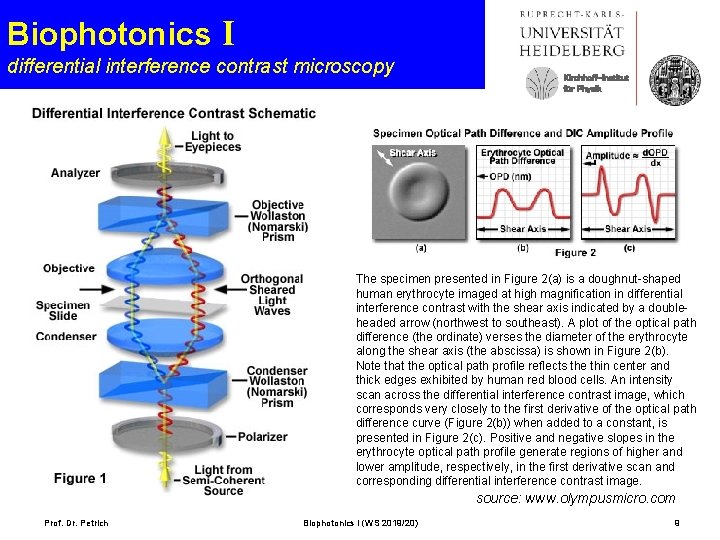
Biophotonics I differential interference contrast microscopy Kirchhoff-Institut für Physik The specimen presented in Figure 2(a) is a doughnut-shaped human erythrocyte imaged at high magnification in differential interference contrast with the shear axis indicated by a doubleheaded arrow (northwest to southeast). A plot of the optical path difference (the ordinate) verses the diameter of the erythrocyte along the shear axis (the abscissa) is shown in Figure 2(b). Note that the optical path profile reflects the thin center and thick edges exhibited by human red blood cells. An intensity scan across the differential interference contrast image, which corresponds very closely to the first derivative of the optical path difference curve (Figure 2(b)) when added to a constant, is presented in Figure 2(c). Positive and negative slopes in the erythrocyte optical path profile generate regions of higher and lower amplitude, respectively, in the first derivative scan and corresponding differential interference contrast image. source: www. olympusmicro. com Prof. Dr. Petrich Biophotonics I (WS 2019/20) 9
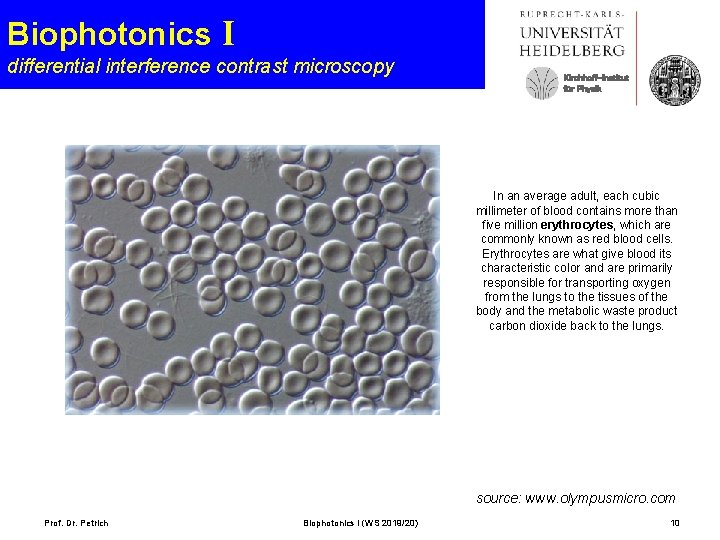
Biophotonics I differential interference contrast microscopy Kirchhoff-Institut für Physik In an average adult, each cubic millimeter of blood contains more than five million erythrocytes, which are commonly known as red blood cells. Erythrocytes are what give blood its characteristic color and are primarily responsible for transporting oxygen from the lungs to the tissues of the body and the metabolic waste product carbon dioxide back to the lungs. source: www. olympusmicro. com Prof. Dr. Petrich Biophotonics I (WS 2019/20) 10
Biophotonics I I. 2. Microscopy Kirchhoff-Institut für Physik source: http: //micro. magnet. fsu. edu/primer Prof. Dr. Petrich Biophotonics I (WS 2019/20) 11 11
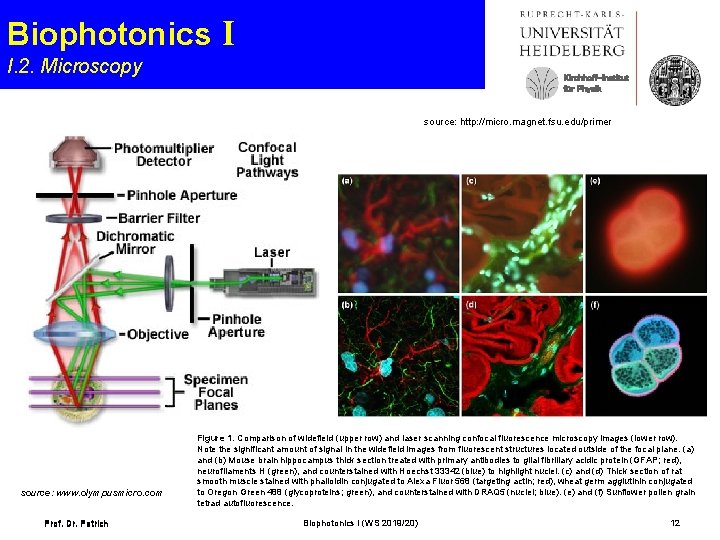
Biophotonics I I. 2. Microscopy Kirchhoff-Institut für Physik source: http: //micro. magnet. fsu. edu/primer source: www. olympusmicro. com Prof. Dr. Petrich Figure 1. Comparison of widefield (upper row) and laser scanning confocal fluorescence microscopy images (lower row). Note the significant amount of signal in the widefield images from fluorescent structures located outside of the focal plane. (a) and (b) Mouse brain hippocampus thick section treated with primary antibodies to glial fibrillary acidic protein (GFAP; red), neurofilaments H (green), and counterstained with Hoechst 33342 (blue) to highlight nuclei. (c) and (d) Thick section of rat smooth muscle stained with phalloidin conjugated to Alexa Fluor 568 (targeting actin; red), wheat germ agglutinin conjugated to Oregon Green 488 (glycoproteins; green), and counterstained with DRAQ 5 (nuclei; blue). (e) and (f) Sunflower pollen grain tetrad autofluorescence. Biophotonics I (WS 2019/20) 12
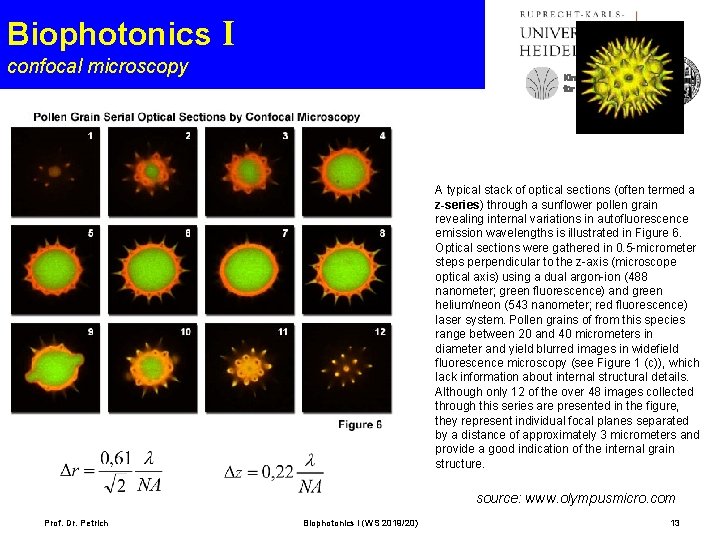
Biophotonics I confocal microscopy Kirchhoff-Institut für Physik A typical stack of optical sections (often termed a z-series) through a sunflower pollen grain revealing internal variations in autofluorescence emission wavelengths is illustrated in Figure 6. Optical sections were gathered in 0. 5 -micrometer steps perpendicular to the z-axis (microscope optical axis) using a dual argon-ion (488 nanometer; green fluorescence) and green helium/neon (543 nanometer; red fluorescence) laser system. Pollen grains of from this species range between 20 and 40 micrometers in diameter and yield blurred images in widefield fluorescence microscopy (see Figure 1 (c)), which lack information about internal structural details. Although only 12 of the over 48 images collected through this series are presented in the figure, they represent individual focal planes separated by a distance of approximately 3 micrometers and provide a good indication of the internal grain structure. source: www. olympusmicro. com Prof. Dr. Petrich Biophotonics I (WS 2019/20) 13
- Slides: 13