
Kinetics of biodegradation of sewage due to addition
Kinetics of biodegradation of sewage due to addition of Chlorides DEPARTMENT OF CIVIL ENGINEERING MALAVIYA NATIONAL INSTITUTE OF TECHNOLOGY JAIPUR PRESENTED BY: Prof A. B. Gupta (Co-author: Sunderramieddy)
Contents: • Introduction • Objectives of the study • Methodology • Results • Conclusions
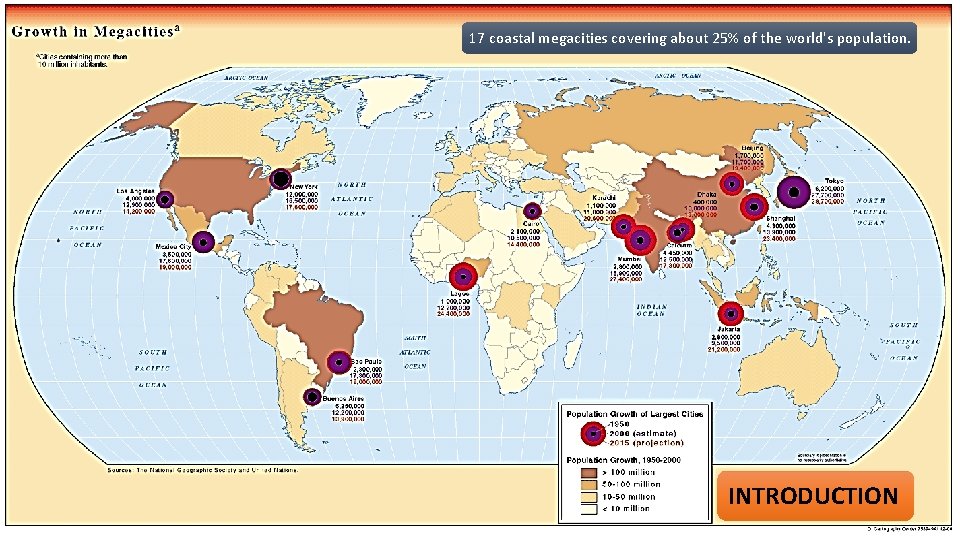
17 coastal megacities covering about 25% of the world's population. INTRODUCTION
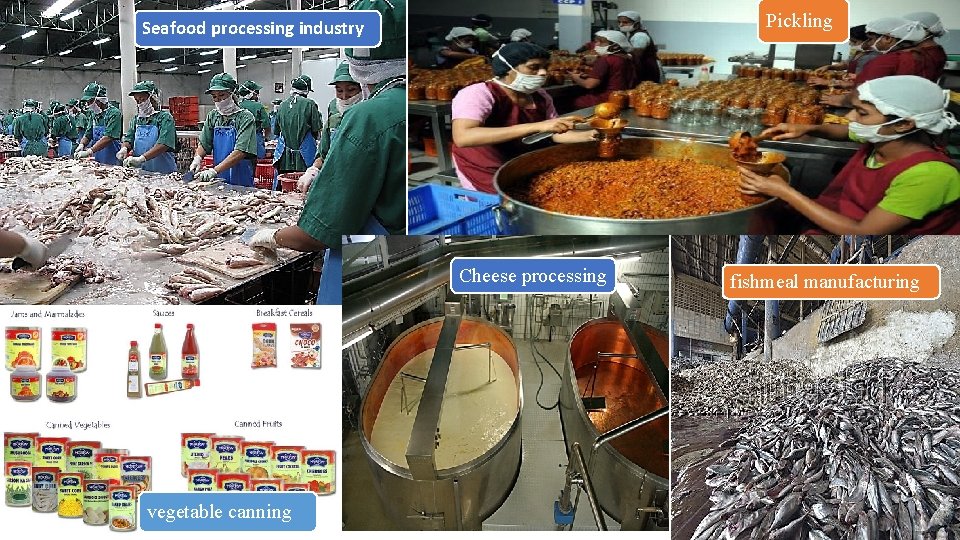
Pickling Seafood processing industry Cheese processing vegetable canning fishmeal manufacturing
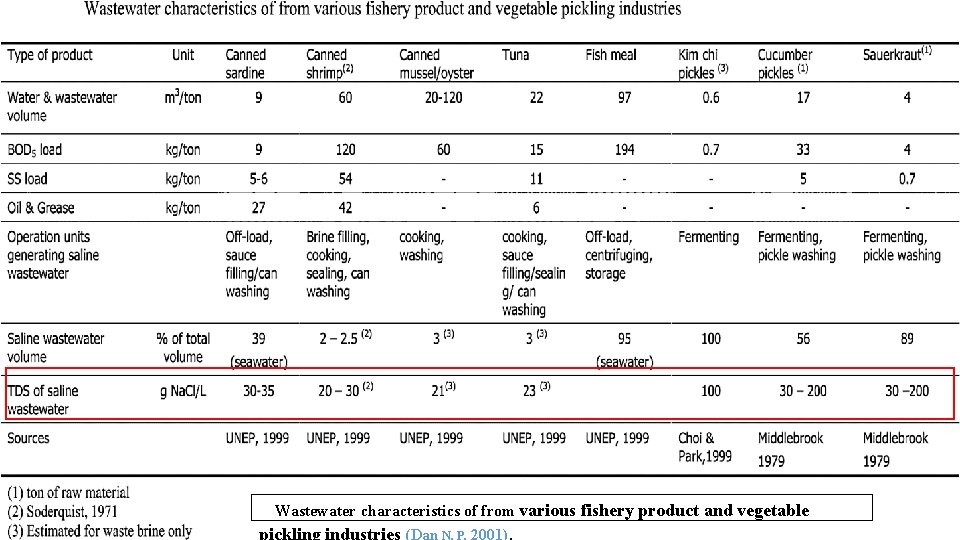
Wastewater characteristics of from various fishery product and vegetable pickling industries (Dan N. P, 2001).
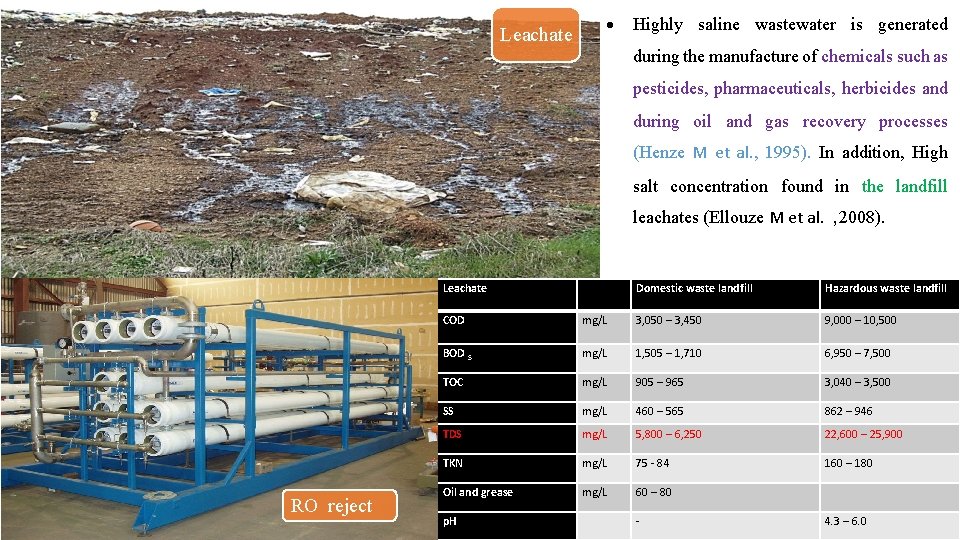
Leachate Highly saline wastewater is generated during the manufacture of chemicals such as pesticides, pharmaceuticals, herbicides and during oil and gas recovery processes (Henze M et al. , 1995). In addition, High salt concentration found in the landfill leachates (Ellouze M et al. , 2008). RO reject Leachate Domestic waste landfill Hazardous waste landfill COD mg/L 3, 050 – 3, 450 9, 000 – 10, 500 BOD 5 mg/L 1, 505 – 1, 710 6, 950 – 7, 500 TOC mg/L 905 – 965 3, 040 – 3, 500 SS mg/L 460 – 565 862 – 946 TDS mg/L 5, 800 – 6, 250 22, 600 – 25, 900 TKN mg/L 75 - 84 160 – 180 Oil and grease mg/L 60 – 80 p. H - 4. 3 – 6. 0
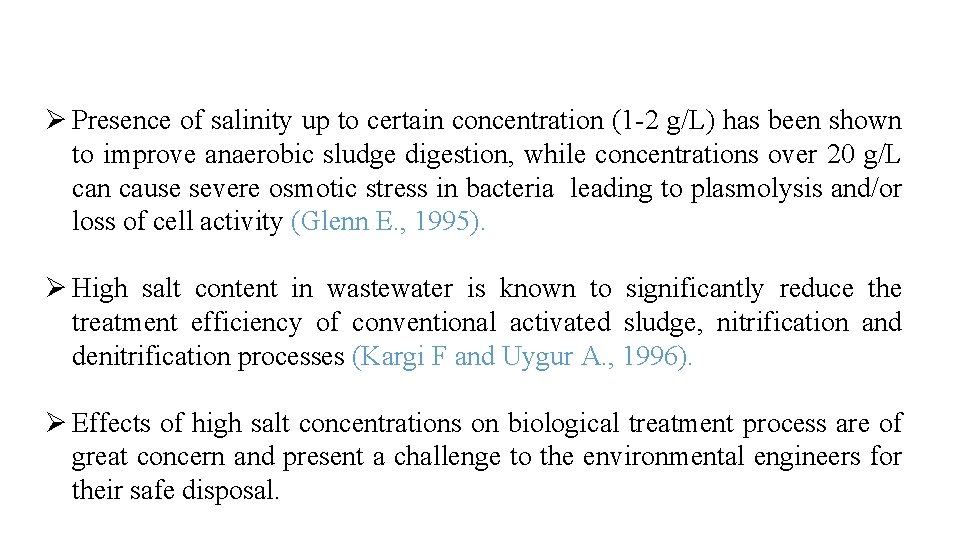
Ø Presence of salinity up to certain concentration (1 -2 g/L) has been shown to improve anaerobic sludge digestion, while concentrations over 20 g/L can cause severe osmotic stress in bacteria leading to plasmolysis and/or loss of cell activity (Glenn E. , 1995). Ø High salt content in wastewater is known to significantly reduce the treatment efficiency of conventional activated sludge, nitrification and denitrification processes (Kargi F and Uygur A. , 1996). Ø Effects of high salt concentrations on biological treatment process are of great concern and present a challenge to the environmental engineers for their safe disposal.
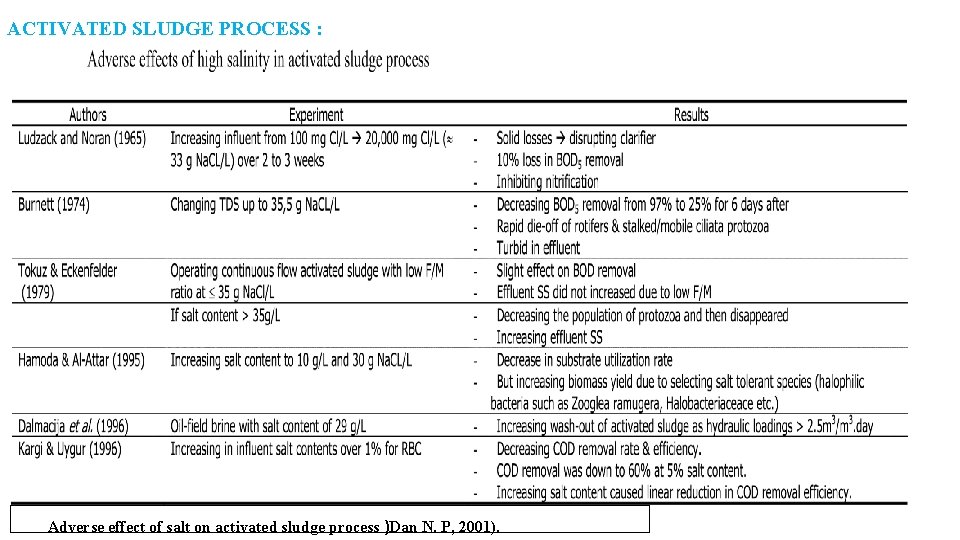
ACTIVATED SLUDGE PROCESS : Adverse effect of salt on activated sludge process )Dan N. P, 2001).
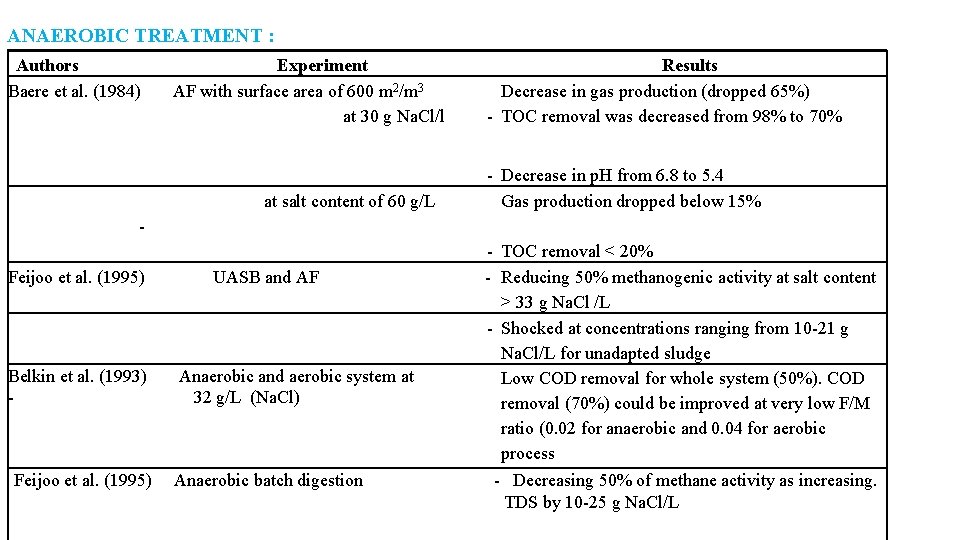
ANAEROBIC TREATMENT : Authors Experiment Baere et al. (1984) AF with surface area of 600 m 2/m 3 at 30 g Na. Cl/l at salt content of 60 g/L - Results Decrease in gas production (dropped 65%) - TOC removal was decreased from 98% to 70% - Decrease in p. H from 6. 8 to 5. 4 Gas production dropped below 15% - TOC removal < 20% Feijoo et al. (1995) UASB and AF - Reducing 50% methanogenic activity at salt content > 33 g Na. Cl /L - Shocked at concentrations ranging from 10 -21 g Na. Cl/L for unadapted sludge Belkin et al. (1993) Anaerobic and aerobic system at Low COD removal for whole system (50%). COD - 32 g/L (Na. Cl) removal (70%) could be improved at very low F/M ratio (0. 02 for anaerobic and 0. 04 for aerobic process Feijoo et al. (1995) Anaerobic batch digestion - Decreasing 50% of methane activity as increasing. TDS by 10 -25 g Na. Cl/L
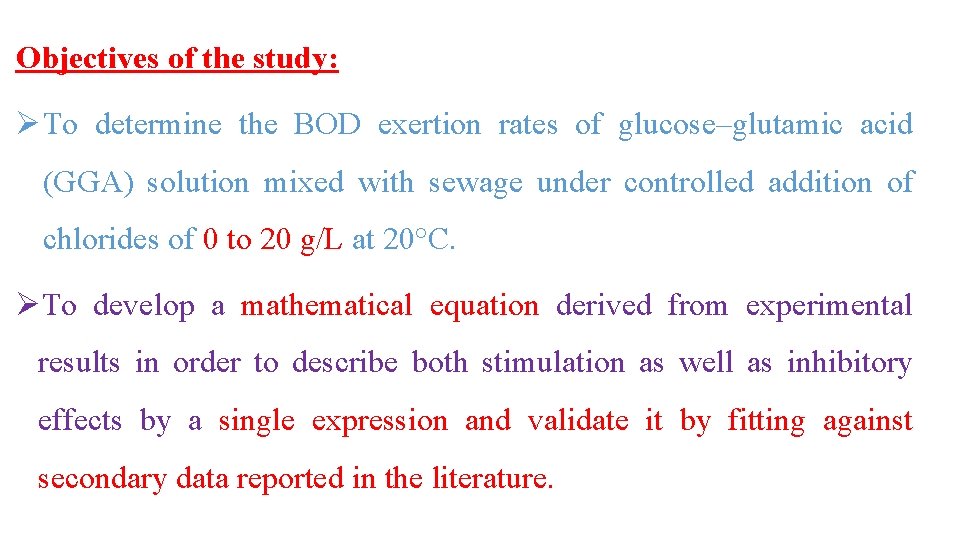
Objectives of the study: Ø To determine the BOD exertion rates of glucose–glutamic acid (GGA) solution mixed with sewage under controlled addition of chlorides of 0 to 20 g/L at 20°C. ØTo develop a mathematical equation derived from experimental results in order to describe both stimulation as well as inhibitory effects by a single expression and validate it by fitting against secondary data reported in the literature.
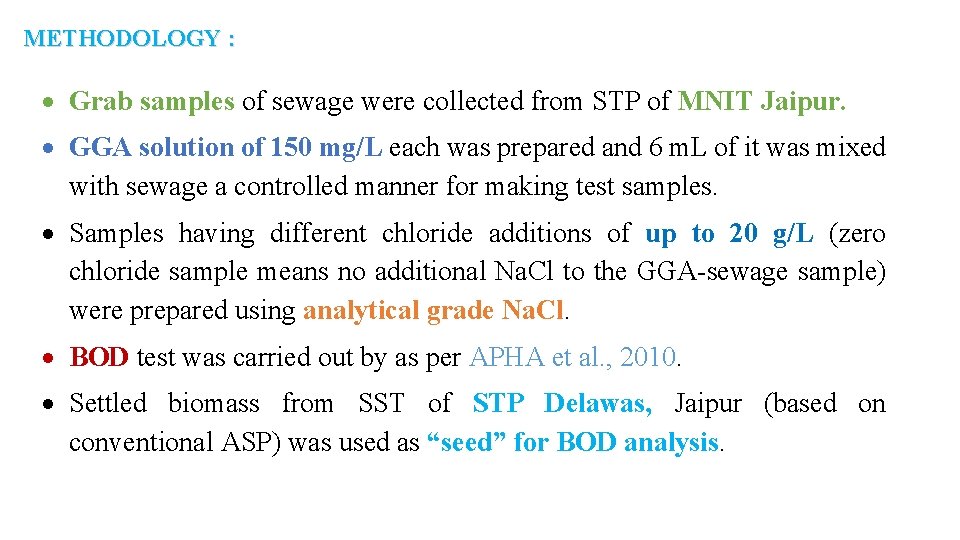
METHODOLOGY : Grab samples of sewage were collected from STP of MNIT Jaipur. GGA solution of 150 mg/L each was prepared and 6 m. L of it was mixed with sewage a controlled manner for making test samples. Samples having different chloride additions of up to 20 g/L (zero chloride sample means no additional Na. Cl to the GGA-sewage sample) were prepared using analytical grade Na. Cl. BOD test was carried out by as per APHA et al. , 2010. Settled biomass from SST of STP Delawas, Jaipur (based on conventional ASP) was used as “seed” for BOD analysis.
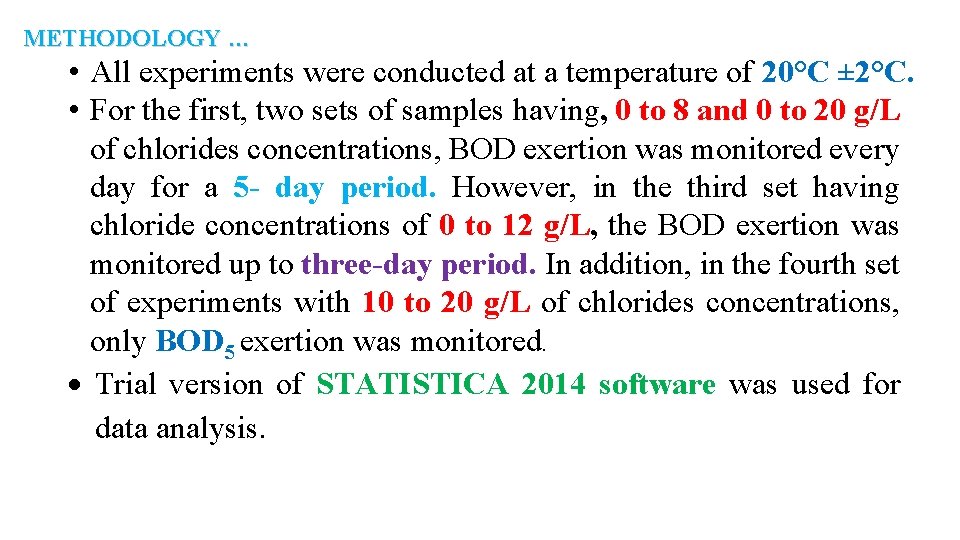
METHODOLOGY … • All experiments were conducted at a temperature of 20°C ± 2°C. • For the first, two sets of samples having, 0 to 8 and 0 to 20 g/L of chlorides concentrations, BOD exertion was monitored every day for a 5 - day period. However, in the third set having chloride concentrations of 0 to 12 g/L, the BOD exertion was monitored up to three-day period. In addition, in the fourth set of experiments with 10 to 20 g/L of chlorides concentrations, only BOD 5 exertion was monitored. Trial version of STATISTICA 2014 software was used for data analysis.

Calculation of Kinetic coefficient K 1) THEORETICAL CALCULATIONS OF BOD 3) ULTIMATE BOD CALCULATIONS: = Y=L 0 (1 -10 -(kt/2. 303)) • COD of sewage sample was considered as its ultimate BOD. • The theoretical COD of 373 mg/L as determined from the chemical formula of GGA solution was considered as its ultimate BOD. (373 mg/L * 6 m. L) + (COD of sample mg/L* m. L of Sample) (m. L of GGA (6) + m. L of sample taken)
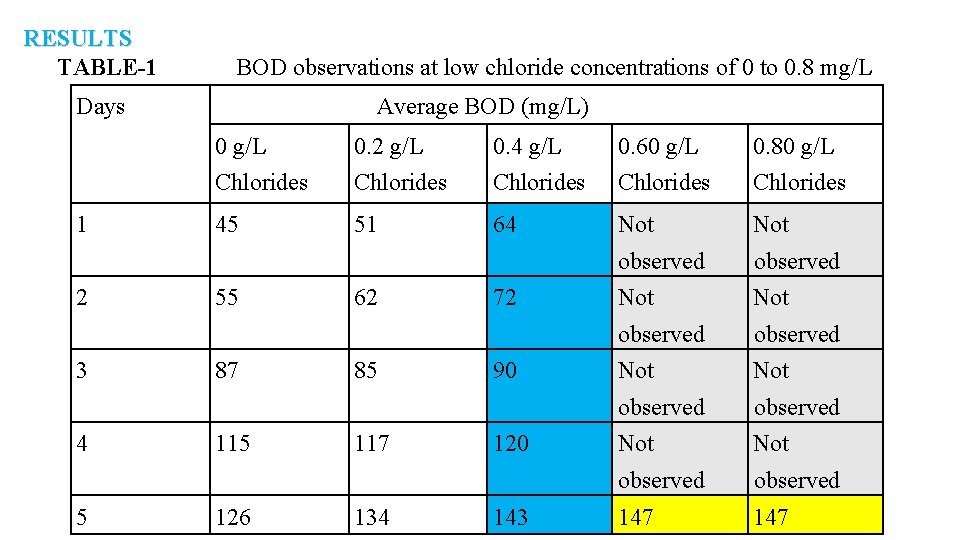
RESULTS TABLE-1 BOD observations at low chloride concentrations of 0 to 0. 8 mg/L Days 1 2 3 4 5 Average BOD (mg/L) 0 g/L 0. 2 g/L 0. 4 g/L 0. 60 g/L 0. 80 g/L Chlorides Chlorides 45 51 64 Not observed Not observed 147 55 87 115 126 62 85 117 134 72 90 120 143
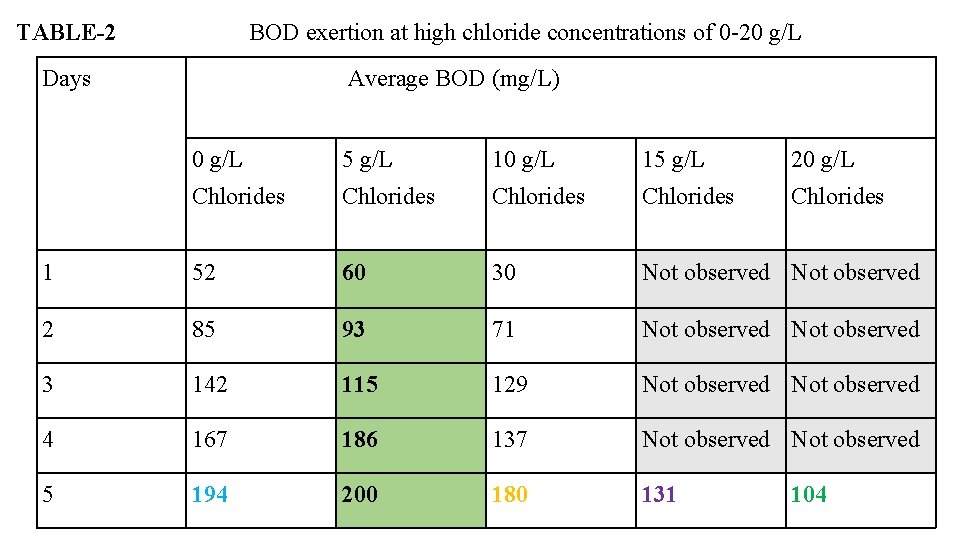
TABLE-2 Days BOD exertion at high chloride concentrations of 0 -20 g/L Average BOD (mg/L) 0 g/L 5 g/L 10 g/L 15 g/L 20 g/L Chlorides Chlorides 1 52 60 30 Not observed 2 85 93 71 Not observed 3 142 115 129 Not observed 4 167 186 137 Not observed 5 194 200 180 131 104
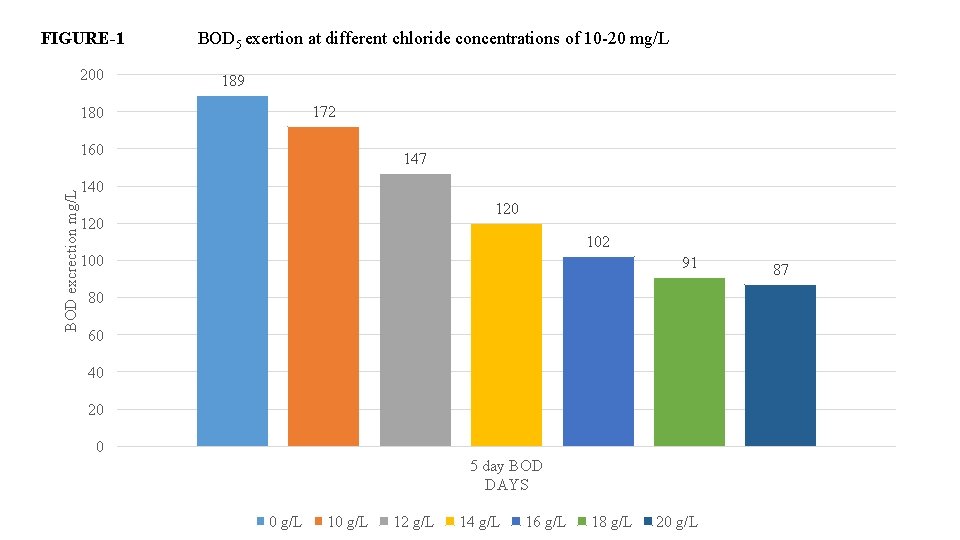
FIGURE-1 200 BOD 5 exertion at different chloride concentrations of 10 -20 mg/L 189 172 180 BOD excrection mg/L 160 147 140 120 102 100 91 80 60 40 20 0 5 day BOD DAYS 0 g/L 12 g/L 14 g/L 16 g/L 18 g/L 20 g/L 87
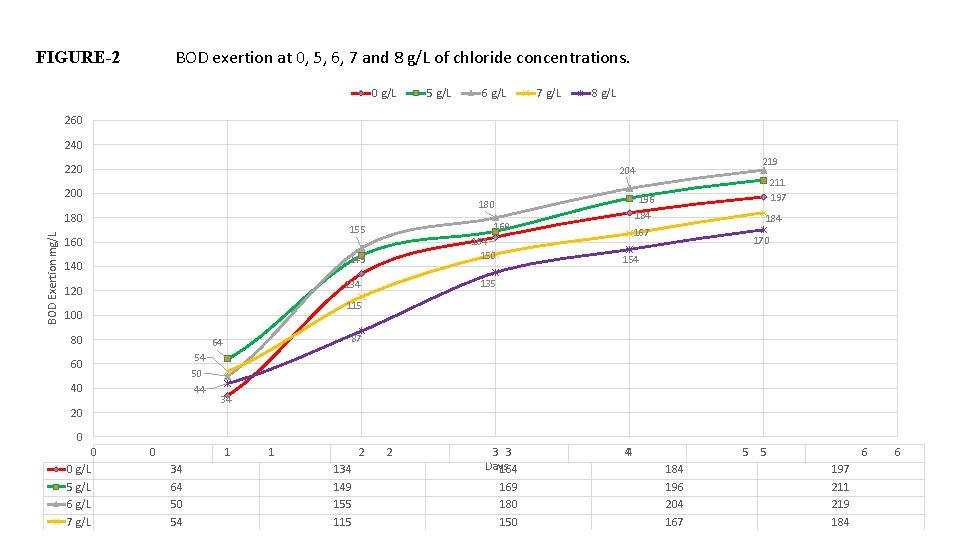
BOD exertion at 0, 5, 6, 7 and 8 g/L of chloride concentrations. FIGURE-2 0 g/L 5 g/L 6 g/L 7 g/L 8 g/L 260 240 220 200 169 155 160 164 150 149 140 184 167 170 154 135 134 120 211 197 196 180 BOD Exertion mg/L 219 204 115 100 80 87 64 54 60 50 44 40 20 34 0 0 0 g/L 5 g/L 6 g/L 7 g/L 1 0 34 64 50 54 2 1 134 149 155 115 2 3 3 Days 164 169 180 150 44 5 5 184 196 204 167 6 197 211 219 184 6
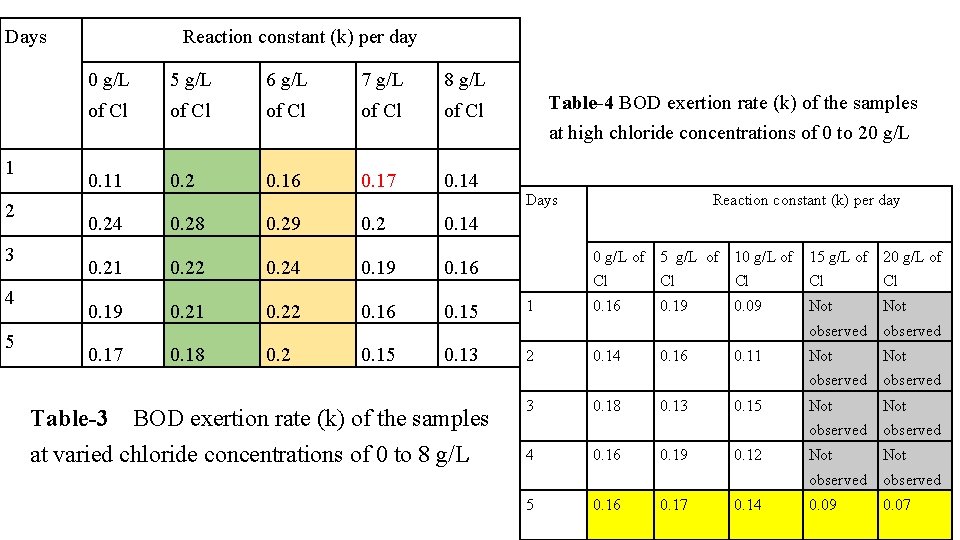
Days 1 2 3 4 5 Reaction constant (k) per day 0 g/L 5 g/L 6 g/L 7 g/L 8 g/L of Cl of Cl 0. 11 0. 2 0. 16 0. 17 0. 14 0. 28 0. 29 0. 2 0. 14 0. 21 0. 22 0. 24 0. 19 0. 16 0. 19 0. 21 0. 22 0. 16 0. 15 1 0. 17 0. 18 0. 2 0. 15 0. 13 2 Table-3 BOD exertion rate (k) of the samples at varied chloride concentrations of 0 to 8 g/L Table-4 BOD exertion rate (k) of the samples at high chloride concentrations of 0 to 20 g/L Days Reaction constant (k) per day 0 g/L of 5 g/L of 10 g/L of 15 g/L of 20 g/L of 3 4 5 Cl Cl Cl 0. 16 0. 19 0. 09 Not observed Not observed 0. 09 0. 07 0. 14 0. 18 0. 16 0. 13 0. 19 0. 17 0. 11 0. 15 0. 12 0. 14
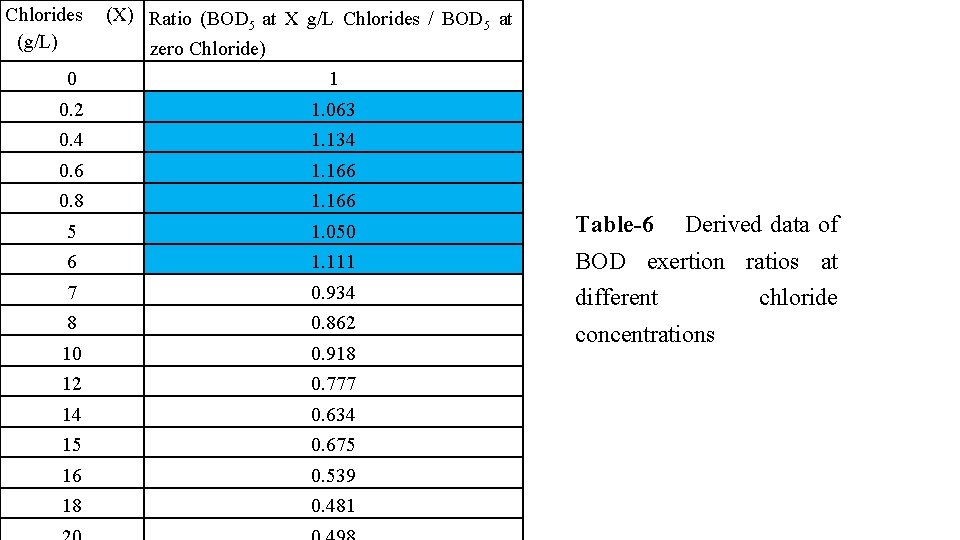
Chlorides (X) Ratio (BOD 5 at X g/L Chlorides / BOD 5 at (g/L) zero Chloride) 0 1 0. 2 1. 063 0. 4 1. 134 0. 6 1. 166 0. 8 1. 166 5 1. 050 Table-6 6 1. 111 BOD exertion ratios at 7 0. 934 different 8 0. 862 10 0. 918 concentrations 12 0. 777 14 0. 634 15 0. 675 16 0. 539 18 0. 481 Derived data of chloride
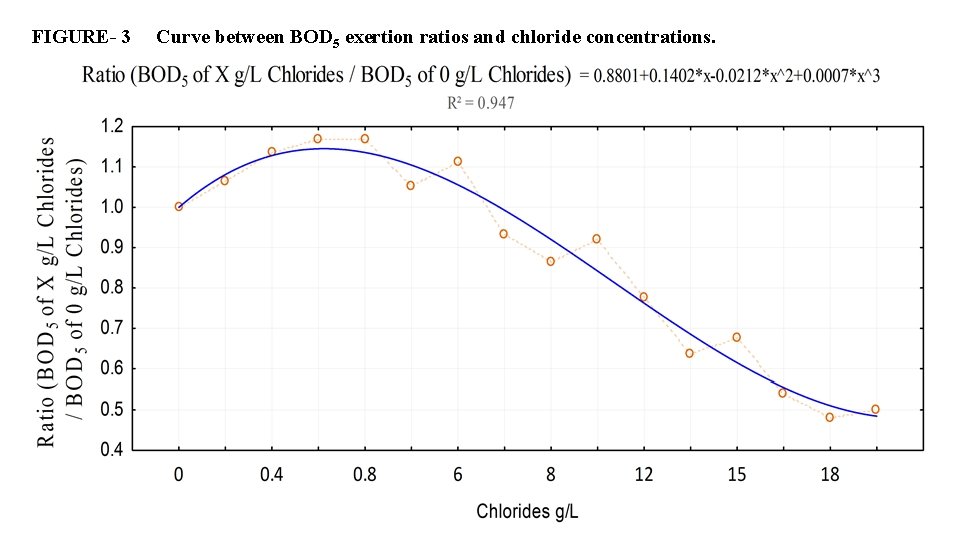
FIGURE- 3 Curve between BOD 5 exertion ratios and chloride concentrations.
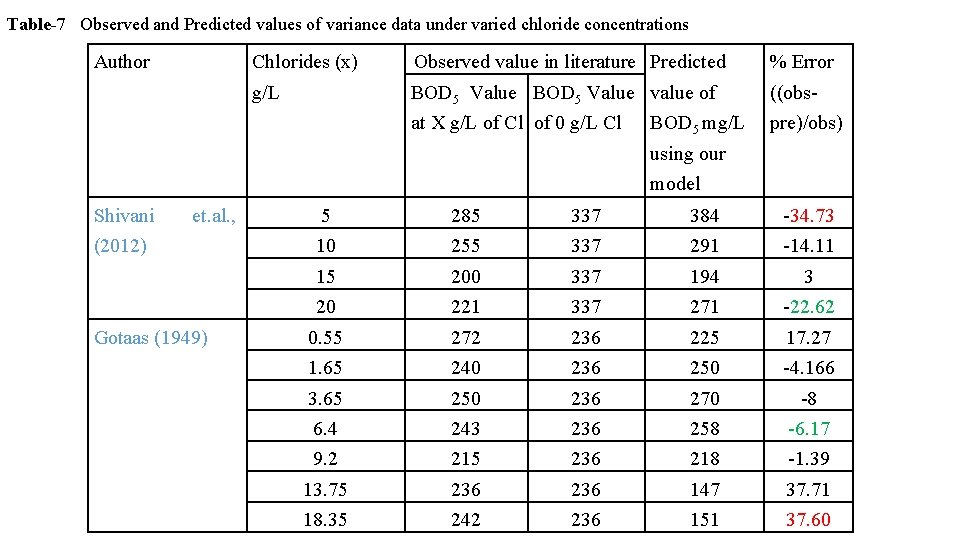
Table-7 Observed and Predicted values of variance data under varied chloride concentrations Author Chlorides (x) Observed value in literature Predicted % Error g/L BOD 5 Value value of ((obs- at X g/L of Cl of 0 g/L Cl BOD 5 mg/L pre)/obs) using our model Shivani et. al. , 5 285 337 (2012) 10 255 15 Gotaas (1949) -34. 73 337 384 291 200 337 194 3 20 221 337 271 -22. 62 0. 55 272 236 225 17. 27 1. 65 240 236 250 -4. 166 3. 65 250 236 270 -8 6. 4 243 236 258 -6. 17 9. 2 215 236 218 -1. 39 13. 75 236 147 37. 71 18. 35 242 236 151 37. 60 -14. 11
CONCLUSIONS • Chloride concentrations of up to 0. 8 g/L showed stimulation of biodegradation process • Concentrations from 0. 8 - 6. 0 g/L showed no inhibition of biodegradation. This may perhaps be due to the fact up to this salinity, the cells exhibit a higher activity than in the freshwater medium. Microbiological studies for supporting the hypothesis are underway. • Further increase in salinity (7 to 20 g/L of chlorides) restricts the osmo-regulatory processes responsible for the breakdown of organic compounds within the cells of microorganisms. As a result, the kinetic reaction rates of decomposition reactions suffer and show continuous inhibition. • A single third order polynomial curve was able to represent both the stimulation as well as inhibition of the biological process due to the concentration of salt up to 20 g/L. • The results may help formulate strategy for environmentally safe Co-disposal of RO rejects as well as high salt containing industrial wastewaters with sewage.
References 1. APHA, WPCF, AWWA (2010). Standard methods for the examination of water and wastewater. American Public Health Association, WPCF, AWWA. 21 st Ed. NW, DC 2005. 2. Baere, D. L. A. , Devocht, M. , Van Assche, P. , and Verstraete, W. (1984). Influence of high Na. Cl and NH 4 Cl salt levels on methanogenic associations. Water Res. , 18 (5) 543 -548. 3. Belkin, S. , Brenner, A. and Abeliovich, A. (1993). Biological treatment of a high salinity chemical industrial wastewater. Wat. Sci. Tech. , 27 (7 -8), 105 -112. 4. Dan, N. P. (2001). “Biological Treatment of High Salinity Wastewater Using Yeast and Bacterial Systems, ” Ph. D Thesis, Asian Institute of Technology, Bangkok, Thailand. 5. Ellouze, M. , Aloui, F. and Sayadi, S. (2008). Detoxification of Tunisian landfill leachates by selected fungi, J. Hazard. Mater, 150, 642– 648. 6. Feijoo, G. , Soto, M. , Méndez, R. and Lema, J. M. (1995). Sodium inhibition in the anaerobic digestion process: Antagonism and adaptation phenomena. Enzyme and Microbial Technology, 17, 180 -188. 7. Glenn, E. , (1995). Effects of salinity on growth and evapotranspiration of Typha domingensis Pers. Aquatic Botany, 52, 75– 91. 8. Gotaas, H. B. (1949) the effect of sea water on the bio-chemical oxidation of domestic wastewater. Domestic Wastewater Works Journal, 21(5). 9. Henze, M. , Harremoës, P. , Jansen J. and Arvin, E. (1995). Wastewater treatment Biological and Chemical Processes. Springer-Verlag, Berlin, Heidelberg, New York. 10. Kargi F. and Dincer A. R. (1996). Effect of salt content on biological treatment of saline Wastewater by fed-batch operation. Enzyme & Microbial Technology, 19, 529537 11. Pirbazari. (1996) Hybrid membrane filtration process for leachate treatment. Wat. Res. , 30, 2691 -2706. 12. Shivani, S. , Dhage&Amita, A. , Dalvi& Damodar, V. and Prabhu. (2012). Reaction kinetics and validity of BOD test for domestic wastewater released in marine ecosystems. Environ Monit Assess, 184, 5301– 5310.

- Slides: 24