KINEMATICS LESSON 2 AVERAGE SPEED VS AVERAGE VELOCITY


, the")


- Slides: 22
KINEMATICS: LESSON 2
AVERAGE SPEED VS. AVERAGE VELOCITY Example: At a track meet at Redwater School, a runner does one complete 800 metre lap in 1. 5 minutes. Assuming she starts and stops at the same point: a. What was her average speed during this lap? b. What was her average velocity for this lap? First let's convert minutes to seconds: 1. 5 min * (60 sec ) = 90 seconds 1 min Physics 20
AVERAGE SPEED VS. AVERAGE VELOCITY a. The total distance covered was 800 metres. The total time was 90 seconds. The average speed = 800 m = 8. 9 m/s. 90 s Physics 20
AVERAGE SPEED VS. AVERAGE VELOCITY Example: b. What was her average velocity for this lap? b. The total displacement was zero. She returned to the starting point! The total time was 90 seconds. The average velocity = 0 m/s 90 s Physics 20
POSITION-TIME GRAPHS & UNIFORM MOTION What is the golf ball’s displacement after each second? Physics 20
TABLE AND GRAPH OF GOLF PUTT Physics 20
DISCUSSION OF GOLF PUTT: TABLE AND GRAPH Notice that the graph is a straight line. A straight line has a constant slope. What does constant slope tell you about the ball’s motion? Physics 20
CALCULATING SLOPE OF THE GRAPH The equation for slope : • A change in position is displacement. Physics 20
DISCUSSION OF SLOPE OF THE GRAPH Notice that the units of the slope are m/s. These units indicate speed or velocity. The slope of a position-time graph gives us velocity. change in position per unit time. called average velocity Physics 20
DOES DIRECTION AFFECT VELOCITY? Physics 20
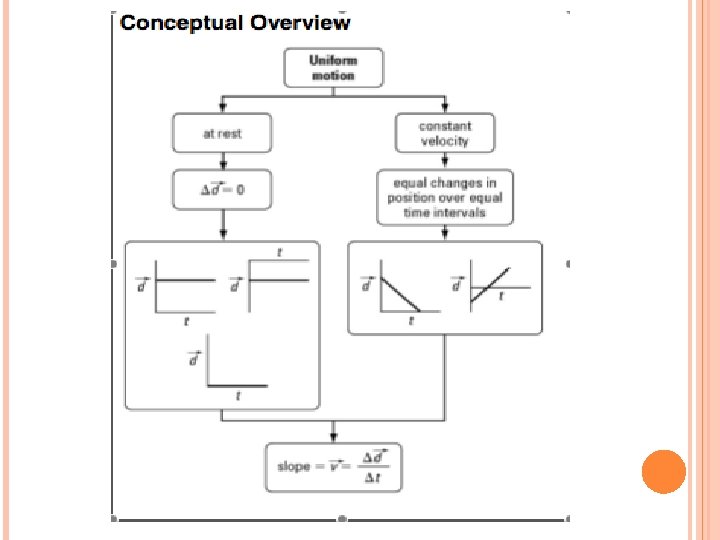
UNIFORM MOTION If an object moves at constant velocity (constant magnitude and direction), the object is undergoing : uniform motion. A position-time graph for an object at rest is: a horizontal line. Physics 20
CHANGING THE FRAME OF REFERENCE If we were to designate the hole as the origin (rather than start point of ball), your data table would start at 5. 0 m at time 0. 0 s. Physics 20
TABLE AND GRAPH OF GOLF PUTT: NEW FRAME OF REFERENCE Physics 20
CALCULATING SLOPE OF THE GRAPH: NEW FRAME OF REFERENCE Physics 20
SUMMARY: The slope of a position-time graph represents velocity. The velocity is the average velocity for the time interval. Your choice of reference frame affects the direction (sign) of your answer. A straight line on a position-time graph represents uniform motion. Physics 20
EXAMPLE Physics 20
EXAMPLE Physics 20
EXAMPLE Physics 20
EXAMPLE Physics 20
EXAMPLE 1. 4 Physics 20
HOMEWORK: Text: Read Page 11 – 20 Workbook: Physics 20