Kinase inhibitor residence time curve fitting Sam Hoare

Kinase inhibitor residence time curve fitting Sam Hoare, Ph. D sam. hoare@pharmechanics. com August 28 2019

Background • Binding kinetics of kinase inhibitors is of great interest in drug discovery. • The inhibitor residence time is frequently measured using a washout protocol: Methods Mol Biol 2019, 1888: 45 -71 (Figs 8 & 13) Promega webinar (slides 20 & 21) Aurelia Bioscience examples

New regression model • A new equation for fitting the washout method data, that estimates the residence time, has been loaded into Graph. Pad Prism in a custom template designed by Pharmechanics.

Washout experiment protocol Pre-incubate enzyme & compound See J Recept Signal Transduct Res 2009, 29: 84 -93

Washout experiment protocol Pre-incubate enzyme & compound Wash out unbound compound See J Recept Signal Transduct Res 2009, 29: 84 -93

Washout experiment protocol Pre-incubate enzyme & compound Wash out unbound compound Add tracer ligand Measure at various times See J Recept Signal Transduct Res 2009, 29: 84 -93

Washout experiment protocol Pre-incubate enzyme & compound Wash out unbound compound Add tracer ligand % bound at 0 min Measure at various times 0 (Control) 10 50 80 90 See J Recept Signal Transduct Res 2009, 29: 84 -93
![Loading the new equation into Prism • Download “[Pharmechanics] Competitor washout kinetics” from here:](http://slidetodoc.com/presentation_image_h2/3bc46e4768ab14a0bd8d2c27fae7f62b/image-8.jpg "Loading the new equation into Prism • Download “[Pharmechanics] Competitor washout kinetics” from here:")
Loading the new equation into Prism • Download “[Pharmechanics] Competitor washout kinetics” from here: • Open file and follow instructions on the following slides.

Loading the new equation into Prism Click on Nonlin fit tab

Loading the new equation into Prism Click this icon

Loading the new equation into Prism This process loads the equation into the “User-defined equations” list. It only needs to be done once. After that, the new equation will be available every time you open Prism. Click OK then close file
 to determine the")
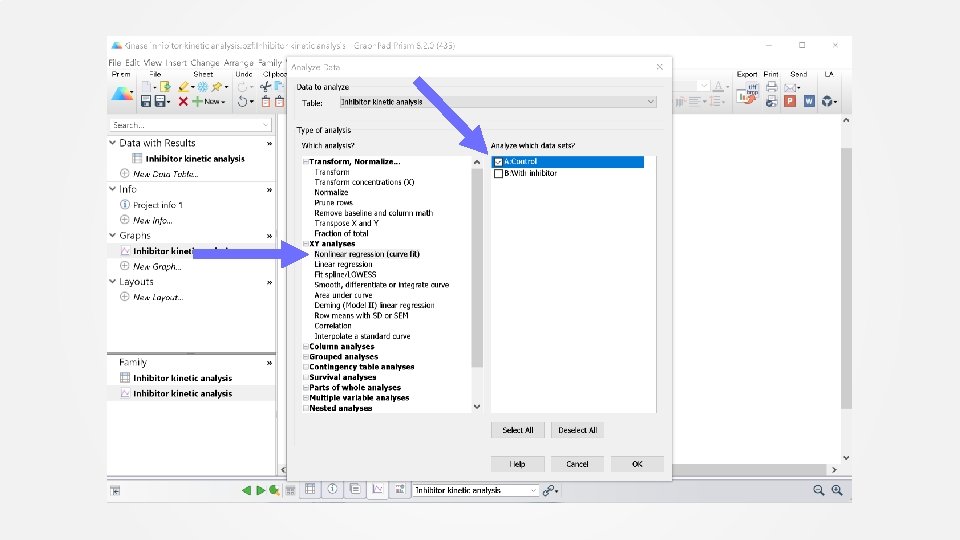
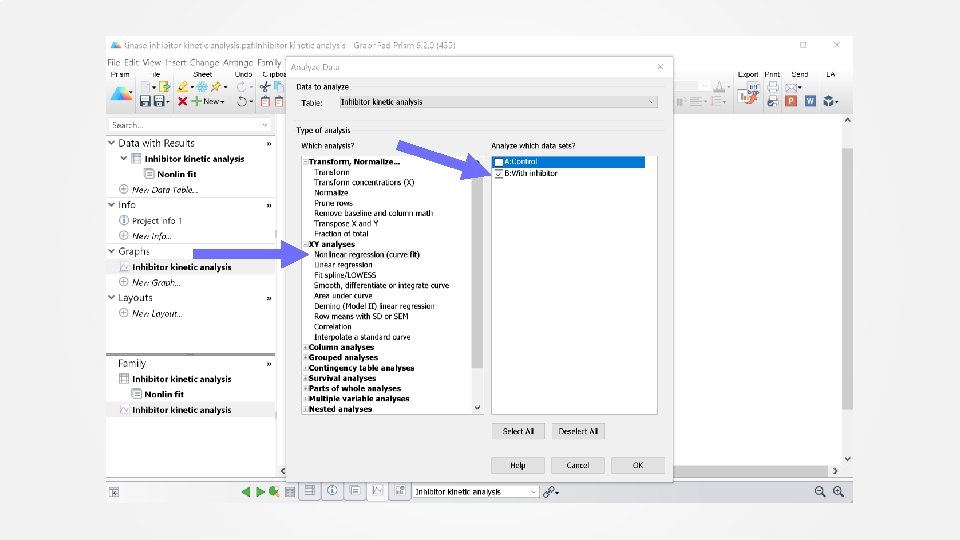
Data analysis Step 1: Control Fit the control data (no inhibitor) to determine the observed association rate constant of the tracer. Use built-in “One phase association” equation. See screen shots on next slides.

Open your file

Select “One phase association” equation

Constrain Y 0 to zero if nonspecific binding has been subtracted.

Curve fit

K is the observed association rate constant of the tracer. This value will be needed for the inhibitor analysis.

Data analysis Step 2: Inhibitor Fit the inhibitor data to determine the dissociation rate constant of the inhibitor. User-defined equation “[Pharmechanics] Competitor washout kinetics” See screen shots on next slides.
![Select “[Pharmechanics] competitor washout kinetics” equation from User defined equations list Click Details for](http://slidetodoc.com/presentation_image_h2/3bc46e4768ab14a0bd8d2c27fae7f62b/image-21.jpg "Select “[Pharmechanics] competitor washout kinetics” equation from User defined equations list Click Details for")
Select “[Pharmechanics] competitor washout kinetics” equation from User defined equations list Click Details for information on the equation
 for technical support on the equation. Koff is the")
Contact Pharmechanics (not Graph. Pad) for technical support on the equation. Koff is the dissociation rate constant of the inhibitor

Click “Constrain” tab
 value from the control")
Enter Kobs. This is the observed association rate constant (K) value from the control analysis

Curve fit

Koff is the dissociation rate constant of the inhibitor Koff Tau is the residence time of the inhibitor (1 / Koff) Koff half time is the dissociation half time of the inhibitor (0. 693 / Koff)

Summary and further information • An equation has been loaded into Prism for analyzing inhibitor washout kinetics experiments commonly used for kinase targets. Equation derivation Washout kinetics examples Methods Mol Biol 2019, 1888: 45 -71 (Figs 8 & 13) Promega webinar (slides 20 & 21) Aurelia Bioscience examples Contact & website sam. hoare@pharmechanics. com www. pharmechanics. com
- Slides: 27