Kim Lewers USDAAgricultural Research Service Beltsville Maryland Plugs

Kim Lewers, USDA-Agricultural Research Service Beltsville, Maryland
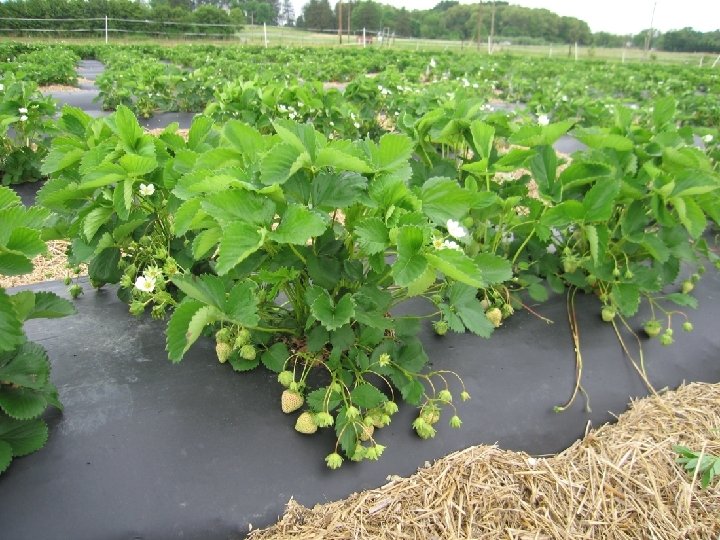

• Plugs are made from end of June to 4 July. • Plugs are planted in the field the first half of August. • The field is fertigated with ~12 lbs/A of nitrogen after one week, every week to 3 rd week of September, to a total of ~75 lbs/A. • The beds are covered with straw mid-December to mid. March.

• Frost protection is a combination of misters at 34 F and Rainbirds at 32. 1 F. • The field is fertigated with ~5 lbs/A of nitrogen per week in April, to between 20 -30 lbs/A. • Plots are harvested twice weekly from mid-May through mid -June. • Rotation is ‘Essex’ rape - strawberry – corn or sudex – soybeans, with rye-vetch winter covers.

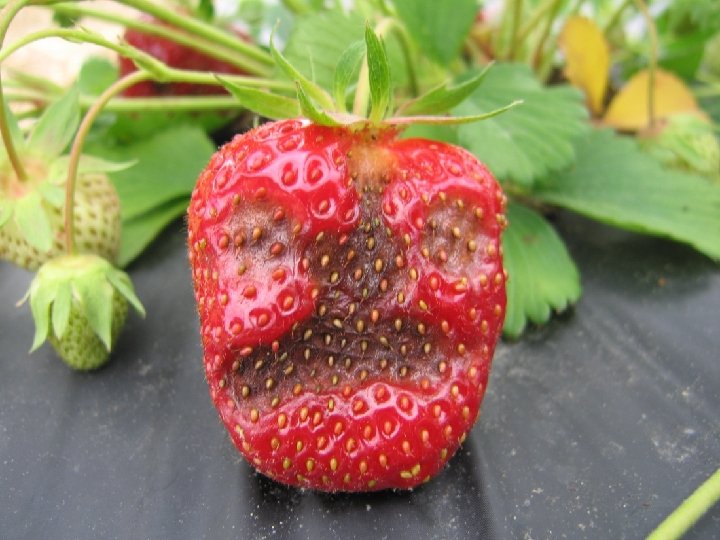
Influence of Nitrogen, Phosphorus, and Potassium on the Severity of Strawberry Anthracnose Crown Rot B. J. Smith United States Department of Agriculture, Agricultural Research Service Southern Horticultural Laboratory, Small Fruit Research Unit Poplarville, MS 39470 USA Seven (7) nitrogen sources at three (3) rates: • Higher N rates led to more anthracnose. • Among plants getting higher N rates, those treated with Ca(NO 3)2 were the most disease tolerant. • Plants treated with nitrate nitrogen sources, including NH 4 NO 3, had less severe anthracnose symptoms than plants receiving nitrogen from other ammonium sources. Take-home: Nitrate forms mean less anthracnose than ammonium forms.

‘Earliglow’

‘Allstar’

‘Ovation’

B 1033

3000 2500 2000 early Earliglow mid B 1033 Lbs. /A. 1500 mid Chandler 1000 mid-late Allstar late Ovation 500 0 12 May 16, 19 May 23, 26 May Strawberry harvest dates, 2011 31 May, 2 June 6, 9 June

Hand-outs to take home… Field rot % is calculated by harvesting the good fruit and rotten fruit into two buckets and weighing them separately. Post-harvest rot % is calculated from the number of total berries that are rotted after two weeks at storage in clamshells at 41 F. The average berry size for each harvest was recorded. “Average berry size” is the average of all those averages. “Large berry size” is the largest of those averages.

USDA-ARS Beltsville strawberry breeding yield gain 50 000 45 000 40 000 35 000 30 000 25 000 20 000 15 000 10 000 5 000 0 2002 High yield Average yield Low yield 2003 2004 2005 2006 2007 2008 2009 2010 2011

John Enns George Meyers Thank you! Want to visit? Kim. Lewers@ ARS. USDA. gov Office: 301 -504 -6768 Cell: 240 -463 -5654
- Slides: 14