
Keynote presentation at the Academy of Medical Sciences



- Slides: 23
Keynote presentation at the Academy of Medical Sciences Joint Workshop Advancing research to tackle multimorbidity: the UK perspective Methodological approaches to multimorbidity research Sylvia Richardson MRC Biostatistics Unit Thanks to Jessica Barrett, Steven Kiddle, Kirsty Rhodes, Li Su & Brian Tom (MRC Biostatistics Unit) Simon Griffin (MRC Epidemiology Unit) and Emanuele Di Angelantonio (Cardiovascular Epidemiology Unit) for fruitful discussions MRC Biostatistics Unit ©MRC Biostatistics Unit, 20 June 2018
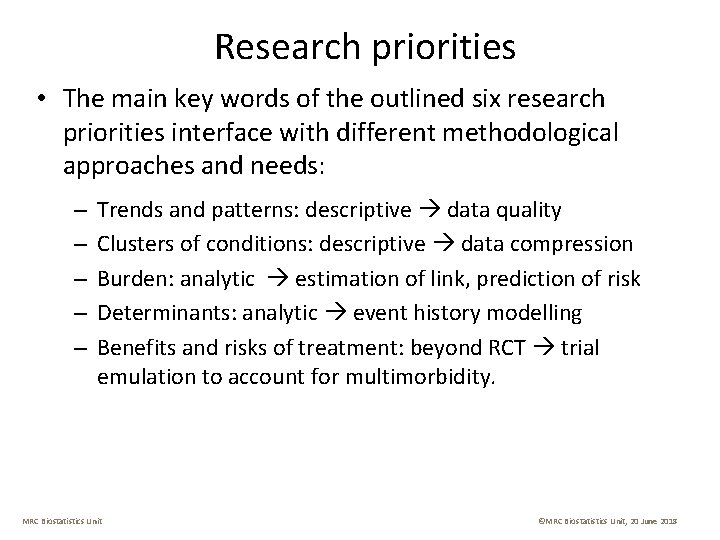
Research priorities • The main key words of the outlined six research priorities interface with different methodological approaches and needs: – – – Trends and patterns: descriptive data quality Clusters of conditions: descriptive data compression Burden: analytic estimation of link, prediction of risk Determinants: analytic event history modelling Benefits and risks of treatment: beyond RCT trial emulation to account for multimorbidity. MRC Biostatistics Unit ©MRC Biostatistics Unit, 20 June 2018
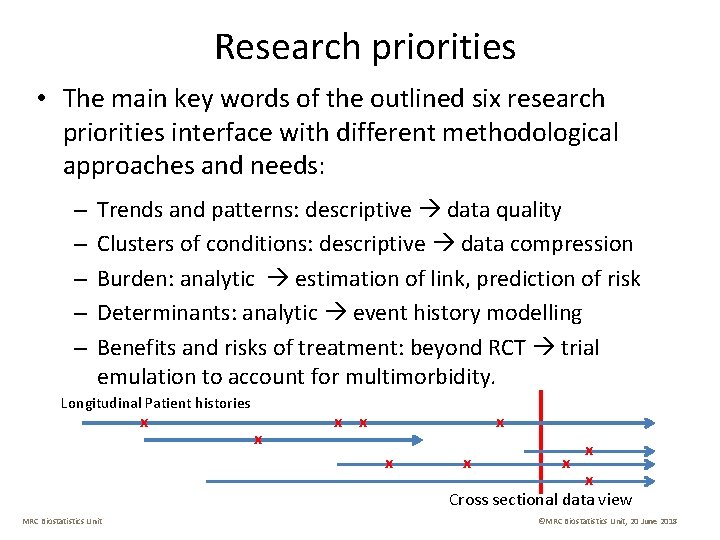
Research priorities • The main key words of the outlined six research priorities interface with different methodological approaches and needs: – – – Trends and patterns: descriptive data quality Clusters of conditions: descriptive data compression Burden: analytic estimation of link, prediction of risk Determinants: analytic event history modelling Benefits and risks of treatment: beyond RCT trial emulation to account for multimorbidity. Longitudinal Patient histories x x x MRC Biostatistics Unit x x Cross sectional data view ©MRC Biostatistics Unit, 20 June 2018
1 Data issues • Central issue of adopting a coherent definition of comorbidity has been highlighted in the report. • Much of the descriptive research is cross-sectional and utilises large primary care databases. • A recent Danish study used their national patient registry of all hospitals. • UK studies have relied on GPs recording conditions, by giving patients diagnosis codes or by prescribing medications. Issues that have been discussed – inconsistent labelling of conditions, choice of granularity, – Under reporting, differential validity in assessment of conditions, – How representative are the sample of GP practices that are used (e. g. CPRD)? MRC Biostatistics Unit ©MRC Biostatistics Unit, 20 June 2018
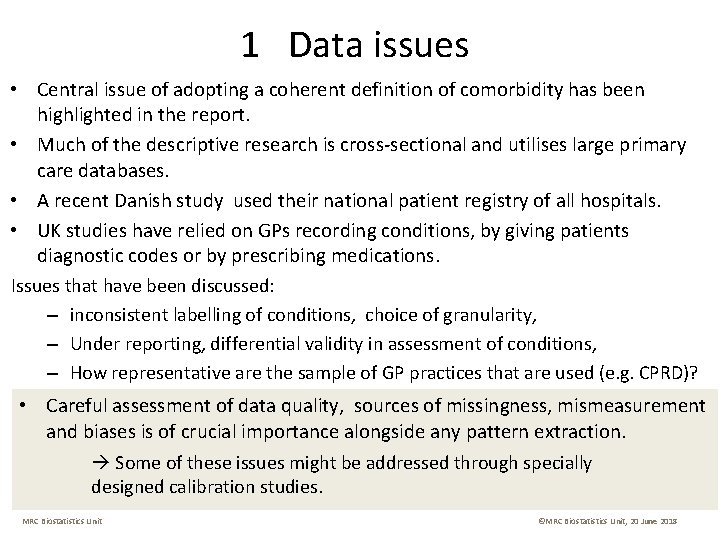
1 Data issues • Central issue of adopting a coherent definition of comorbidity has been highlighted in the report. • Much of the descriptive research is cross-sectional and utilises large primary care databases. • A recent Danish study used their national patient registry of all hospitals. • UK studies have relied on GPs recording conditions, by giving patients diagnostic codes or by prescribing medications. Issues that have been discussed: – inconsistent labelling of conditions, choice of granularity, – Under reporting, differential validity in assessment of conditions, – How representative are the sample of GP practices that are used (e. g. CPRD)? • Careful assessment of data quality, sources of missingness, mismeasurement and biases is of crucial importance alongside any pattern extraction. Some of these issues might be addressed through specially designed calibration studies. MRC Biostatistics Unit ©MRC Biostatistics Unit, 20 June 2018
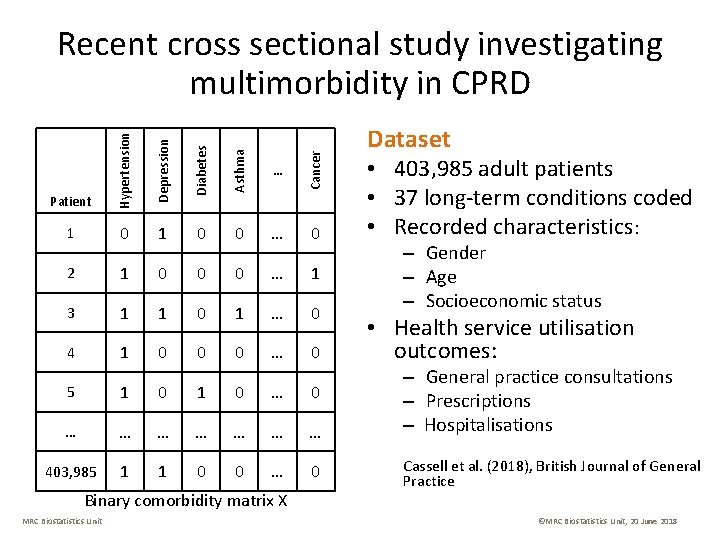
Diabetes Asthma 1 0 0 … 0 2 1 0 0 0 … 1 3 1 1 0 1 … 0 4 1 0 0 0 … 0 Cancer Depression … Patient Hypertension Recent cross sectional study investigating multimorbidity in CPRD 5 1 0 … 0 … … … … 403, 985 1 1 0 0 … 0 Binary comorbidity matrix X MRC Biostatistics Unit Dataset • 403, 985 adult patients • 37 long-term conditions coded • Recorded characteristics: – Gender – Age – Socioeconomic status • Health service utilisation outcomes: – General practice consultations – Prescriptions – Hospitalisations Cassell et al. (2018), British Journal of General Practice ©MRC Biostatistics Unit, 20 June 2018
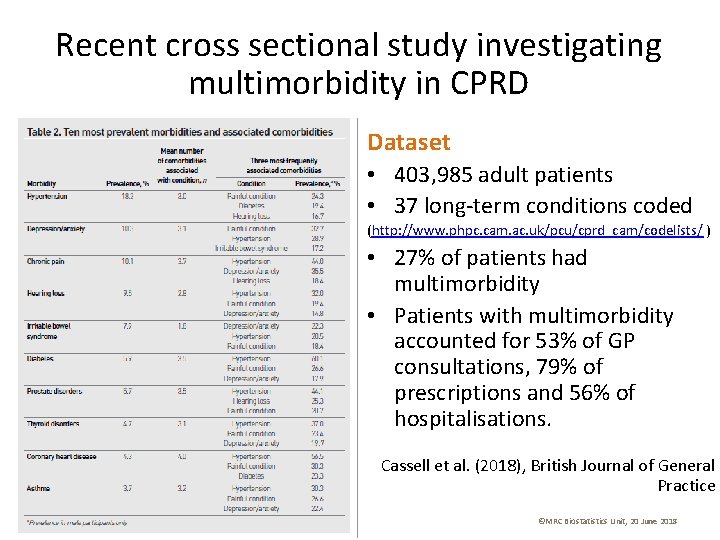
Recent cross sectional study investigating multimorbidity in CPRD Dataset • 403, 985 adult patients • 37 long-term conditions coded (http: //www. phpc. cam. ac. uk/pcu/cprd_cam/codelists/ ) • 27% of patients had multimorbidity • Patients with multimorbidity accounted for 53% of GP consultations, 79% of prescriptions and 56% of hospitalisations. Cassell et al. (2018), British Journal of General Practice MRC Biostatistics Unit ©MRC Biostatistics Unit, 20 June 2018
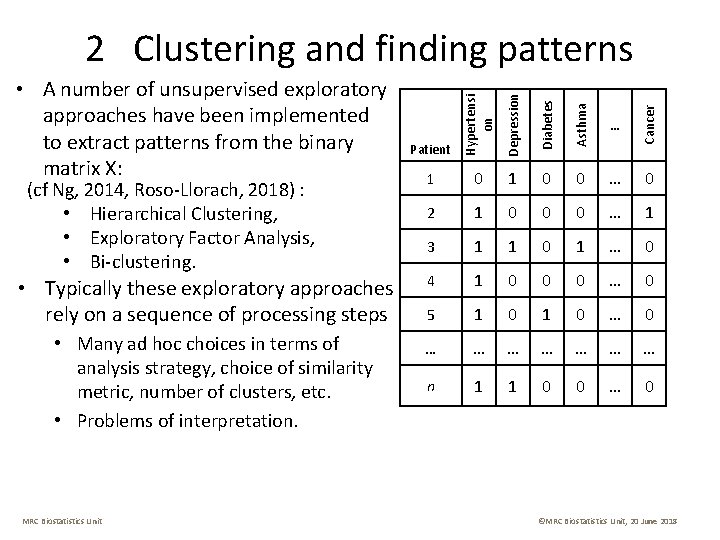
• Many ad hoc choices in terms of analysis strategy, choice of similarity metric, number of clusters, etc. • Problems of interpretation. MRC Biostatistics Unit 1 0 0 … 0 2 1 0 0 0 … 1 3 1 1 0 1 … 0 4 1 0 0 0 … 0 5 1 0 … 0 … … … … n 1 1 0 0 … 0 Cancer Asthma • Typically these exploratory approaches rely on a sequence of processing steps Diabetes (cf Ng, 2014, Roso-Llorach, 2018) : • Hierarchical Clustering, • Exploratory Factor Analysis, • Bi-clustering. … Patient Depression • A number of unsupervised exploratory approaches have been implemented to extract patterns from the binary matrix X: Hypertensi on 2 Clustering and finding patterns ©MRC Biostatistics Unit, 20 June 2018
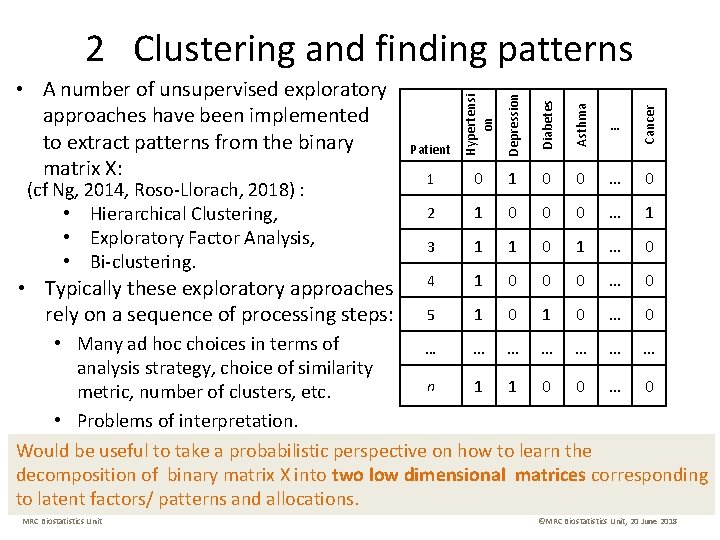
1 0 0 … 0 2 1 0 0 0 … 1 3 1 1 0 1 … 0 4 1 0 0 0 … 0 5 1 0 … 0 Cancer Asthma • Typically these exploratory approaches rely on a sequence of processing steps: Diabetes (cf Ng, 2014, Roso-Llorach, 2018) : • Hierarchical Clustering, • Exploratory Factor Analysis, • Bi-clustering. … Patient Depression • A number of unsupervised exploratory approaches have been implemented to extract patterns from the binary matrix X: Hypertensi on 2 Clustering and finding patterns • Many ad hoc choices in terms of … … … … analysis strategy, choice of similarity n 1 1 0 0 … 0 metric, number of clusters, etc. • Problems of interpretation. Would be useful to take a probabilistic perspective on how to learn the decomposition of binary matrix X into two low dimensional matrices corresponding to latent factors/ patterns and allocations. MRC Biostatistics Unit ©MRC Biostatistics Unit, 20 June 2018
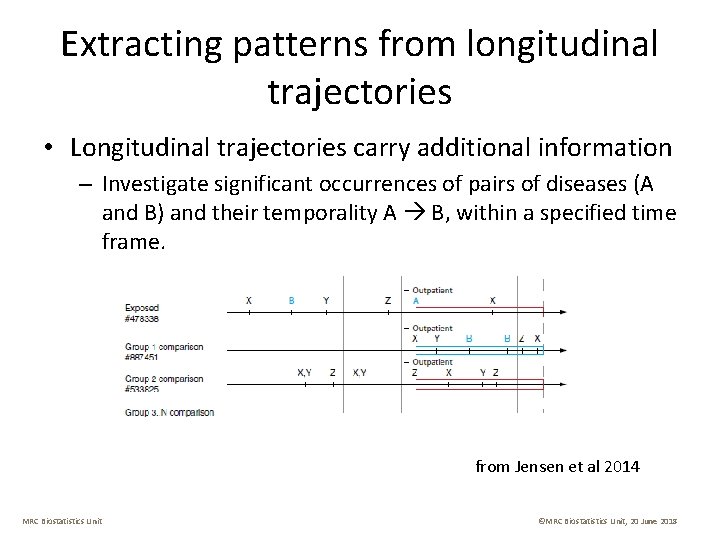
Extracting patterns from longitudinal trajectories • Longitudinal trajectories carry additional information – Investigate significant occurrences of pairs of diseases (A and B) and their temporality A B, within a specified time frame. from Jensen et al 2014 MRC Biostatistics Unit ©MRC Biostatistics Unit, 20 June 2018
Extracting patterns from longitudinal trajectories • Longitudinal trajectories carry additional information: – Investigate significant occurrences of pairs of diseases (A and B) and their temporality A B, within a specified time frame. – Investigate significant occurrences of A B C, within a specified time frame. – Quickly becomes unwieldy “combinatorially” cluster the trajectories directly? – Main issue: defining relevant “distance function” between the trajectories to tease out meaningful patterns and groupings. Specific context and aims should inform the choice of distance. MRC Biostatistics Unit ©MRC Biostatistics Unit, 20 June 2018
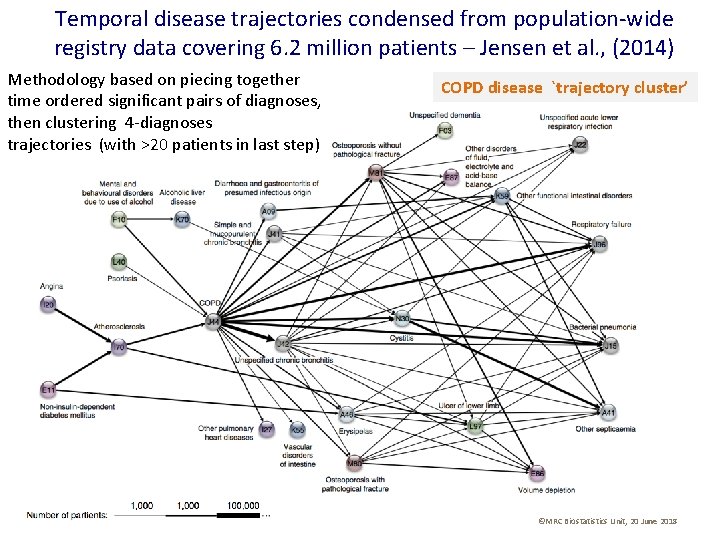
Temporal disease trajectories condensed from population-wide registry data covering 6. 2 million patients – Jensen et al. , (2014) Methodology based on piecing together time ordered significant pairs of diagnoses, then clustering 4 -diagnoses trajectories (with >20 patients in last step) MRC Biostatistics Unit COPD disease `trajectory cluster’ ©MRC Biostatistics Unit, 20 June 2018
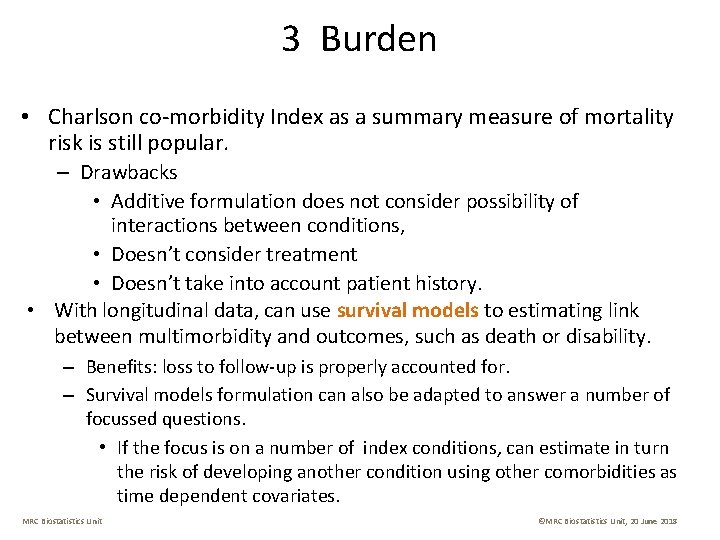
3 Burden • Charlson co-morbidity Index as a summary measure of mortality risk is still popular. – Drawbacks • Additive formulation does not consider possibility of interactions between conditions, • Doesn’t consider treatment, • Doesn’t take into account patient history. MRC Biostatistics Unit ©MRC Biostatistics Unit, 20 June 2018
3 Burden • Charlson co-morbidity Index as a summary measure of mortality risk is still popular. – Drawbacks • Additive formulation does not consider possibility of interactions between conditions, • Doesn’t consider treatment • Doesn’t take into account patient history. • With longitudinal data, can use survival models to estimating link between multimorbidity and outcomes, such as death or disability. – Benefits: loss to follow-up is properly accounted for. – Survival models formulation can also be adapted to answer a number of focussed questions. • If the focus is on a number of index conditions, can estimate in turn the risk of developing another condition using other comorbidities as time dependent covariates. MRC Biostatistics Unit ©MRC Biostatistics Unit, 20 June 2018
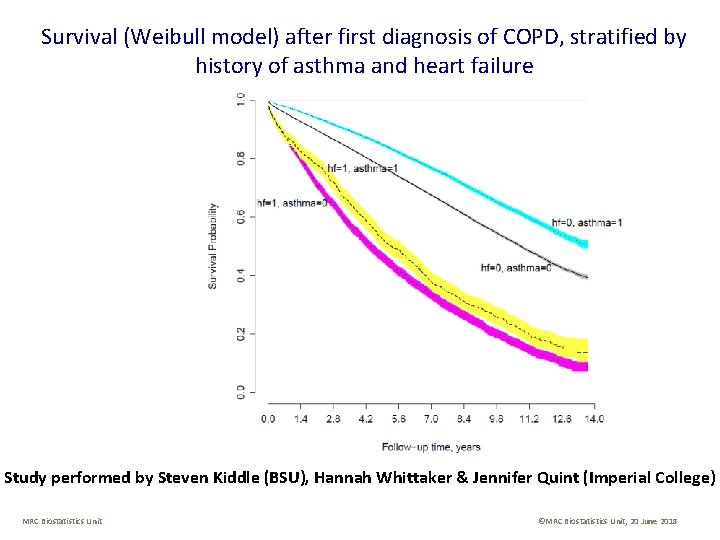
Survival (Weibull model) after first diagnosis of COPD, stratified by history of asthma and heart failure Study performed by Steven Kiddle (BSU), Hannah Whittaker & Jennifer Quint (Imperial College) MRC Biostatistics Unit ©MRC Biostatistics Unit, 20 June 2018
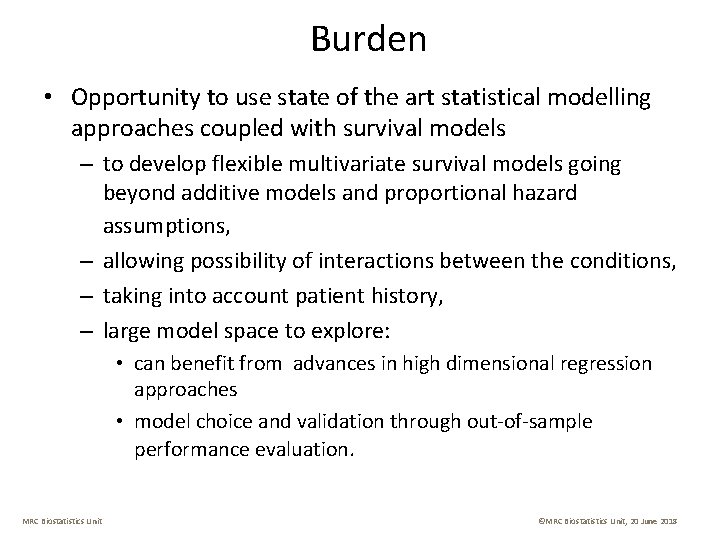
Burden • Opportunity to use state of the art statistical modelling approaches coupled with survival models – to develop flexible multivariate survival models going beyond additive models and proportional hazard assumptions, – allowing possibility of interactions between the conditions, – taking into account patient history, – large model space to explore: • can benefit from advances in high dimensional regression approaches • model choice and validation through out-of-sample performance evaluation. MRC Biostatistics Unit ©MRC Biostatistics Unit, 20 June 2018
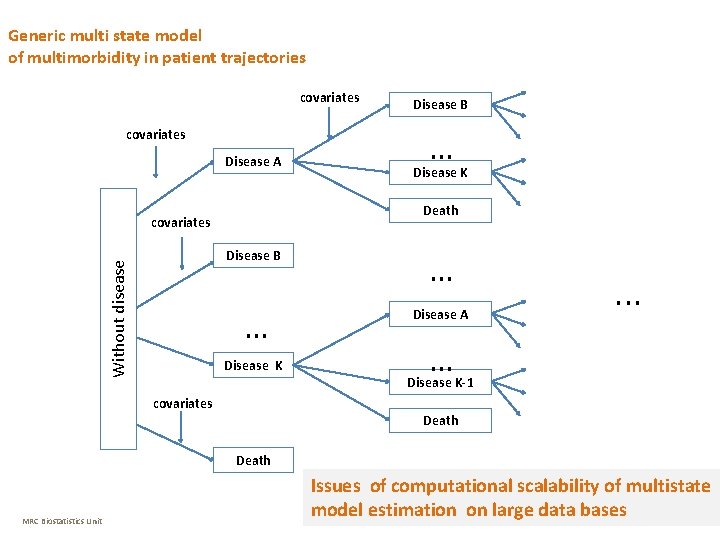
4 Determinants • Best investigated using event history analysis tools, considering full history. • In particular, multi-state models with estimation of transition rates and covariate effects on these transitions is a framework which would provide interpretable quantities. MRC Biostatistics Unit ©MRC Biostatistics Unit, 20 June 2018
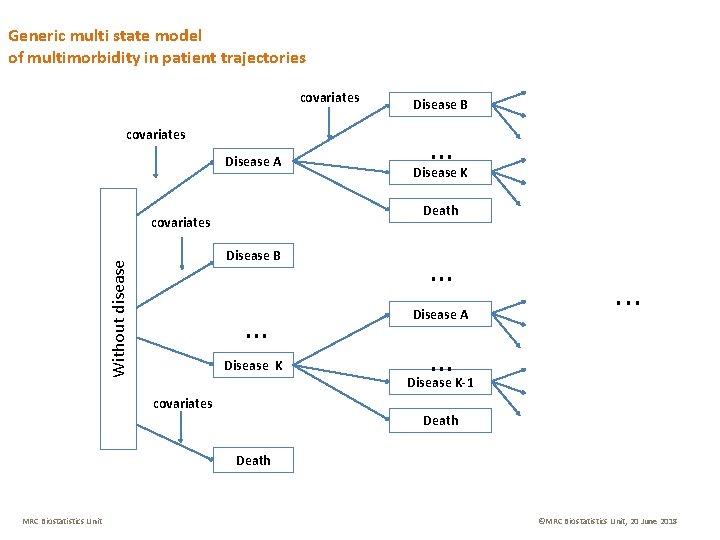
Generic multi state model of multimorbidity in patient trajectories covariates Disease A … Disease K Death covariates Without disease Disease B … … Disease A Disease K covariates . . . … Disease K-1 Death MRC Biostatistics Unit ©MRC Biostatistics Unit, 20 June 2018
Generic multi state model of multimorbidity in patient trajectories covariates Disease A … Disease K Death covariates Without disease Disease B … … Disease A Disease K covariates . . . … Disease K-1 Death MRC Biostatistics Unit Issues of computational scalability of multistate model estimation on large ©MRC data bases Biostatistics Unit, 20 June 2018
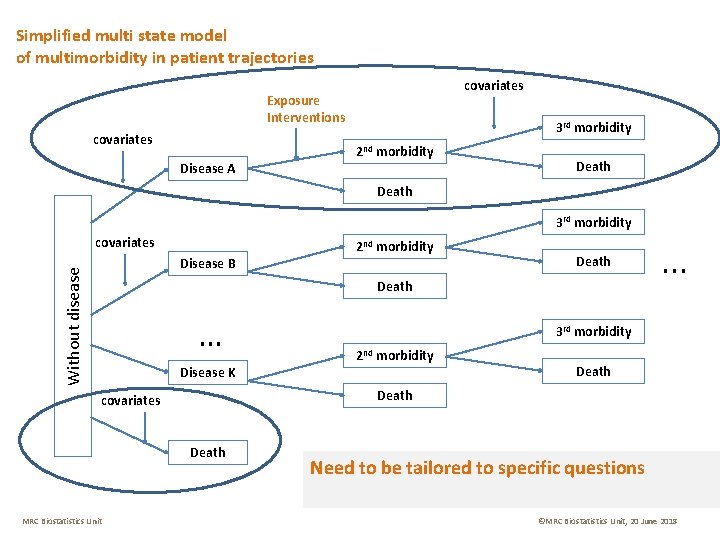
Determinants • Best investigated using event history analysis tools, considering full history. • In particular, multi-state models with estimation of transition rates and covariate effects on these transitions is a framework which would provide interpretable quantities. • Important issue: defining meaningful “states” and allowable transitions between these. this has to be linked closely to epidemiological and medical context. • Potential formulating causal hypotheses to be investigated further. MRC Biostatistics Unit ©MRC Biostatistics Unit, 20 June 2018
Simplified multi state model of multimorbidity in patient trajectories covariates Exposure Interventions covariates Disease A 3 rd morbidity 2 nd morbidity Death 3 rd morbidity covariates Without disease Disease B 2 nd morbidity Death … Disease K 3 rd morbidity 2 nd morbidity Death covariates Death MRC Biostatistics Unit . . . Need to be tailored to specific questions ©MRC Biostatistics Unit, 20 June 2018
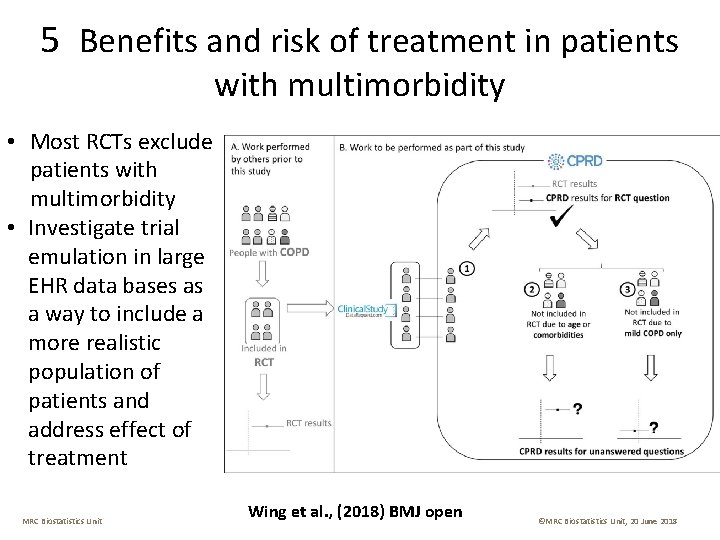
5 Benefits and risk of treatment in patients with multimorbidity • Most RCTs exclude patients with multimorbidity • Investigate trial emulation in large EHR data bases as a way to include a more realistic population of patients and address effect of treatment MRC Biostatistics Unit Wing et al. , (2018) BMJ open ©MRC Biostatistics Unit, 20 June 2018
In summary • Rich range of methodological approaches can be tailored to characterise patterns of comorbidities, and to estimate burden and disease processes. – Important to take into account limitations of the data, – Important to confront generic statistical approaches with specific research questions to derive coherent analysis strategies. • Longitudinal analysis is key to dig deeper into processes and determinants. • Need to prioritize important health questions related to multimorbidity that can be reasonably tackled with large electronic data bases. MRC Biostatistics Unit ©MRC Biostatistics Unit, 20 June 2018