Keynote Lecture GeneEnvironment Interaction Paul W Franks Ph


 x environment interactions on blood pressure in 20 -30 yr")
 Biologic")
")


 Environmental")

 Waist (cm) Physical activity (PAL)")

 - Polyunsaturated fats (PUFA) Physical activity ? ? ? PPAR γ")
")
")


 Nick Wareham FRCP Ph.")
- Slides: 27
Keynote Lecture: Gene-Environment Interaction Paul W Franks Ph. D MPhil MS Assoc. Prof. Experimental Medicine Genetic Epidemiology & Clinical Research Group Department of Public Health & Clinical Medicine Umeå University Hospital Sweden ICPAPH Amsterdam - 2008
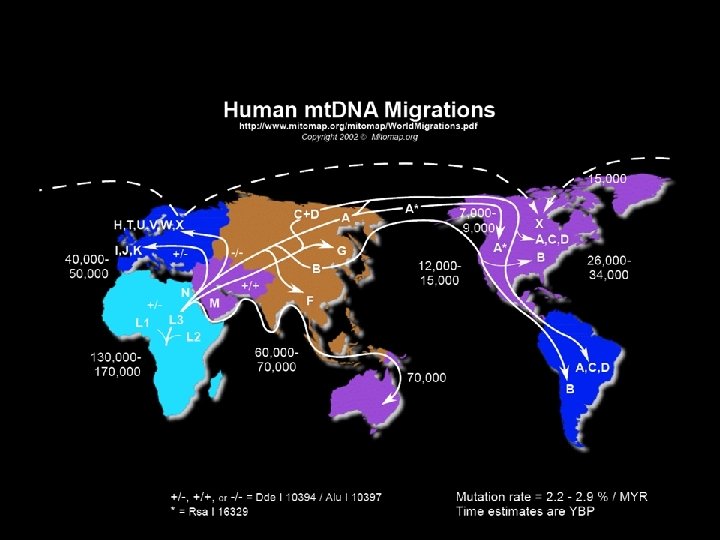
“Genes load the gun and the environment pulls the trigger” Anonymous >99. 9% of modern human evolution <0. 1% of modern human evolution (>1000 s of generations) (~5 generations)
How have evolutionary pressures influenced the adaptation of the human genome and how does this affect disease risk? Genotypes that maximise immunity, fertility & earlylife survival in a physically demanding environment will have been selected for Adipose tissue is integral to fertility and immunity and, because it is highly energetic, was advantagous in early life Logical that our genome is enriched with genes that protect against leanness, promote fatness, and requires energetic stress to function properly
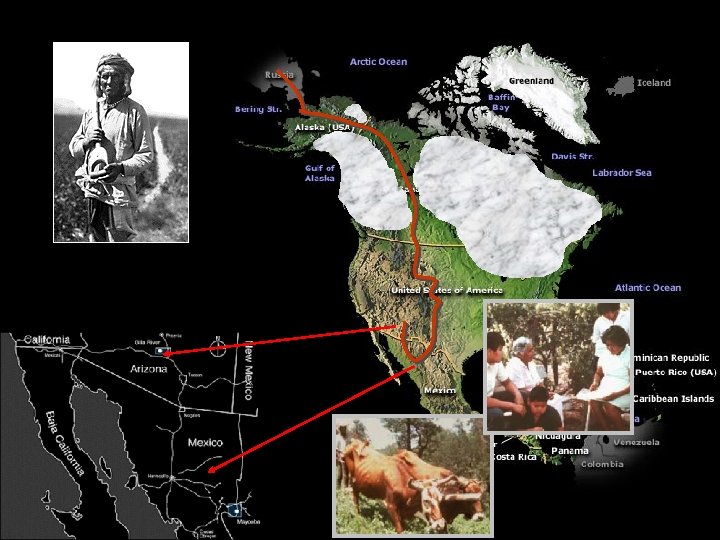
Global prevalence of type 2 diabetes in selected populations Adapted from: King & Rewers (Diab Care, 1993)
Type 2 diabetes incidence in Pimas born to women with varying levels of gestational glucose tolerance Mothers’ gestational 2 hr glucose levels Franks PW, et al. (Diabetes. 2006)
Childhood predictors of type 2 diabetes in Pima Indians Perfect prediction 100 Waist circ. 90 ROC AUC (%) BMI, Hb. A 1 c, 2 hr gluc. Waist, Hb. A 1 c, 2 hr gluc. 80 70 60 Zero prediction 50 5 -9 yrs 10 -15 yrs Age 15 -20 yrs All predictor traits combined: BMI, waist circumference, fasting glucose, 2 hr glucose, Hb. A 1 c, fasting insulin, triglycerides, HDL-C, SBP, DBP Franks PW, et al. (Diabetes. 2007)
Gene (11 BHSD 1) x environment interactions on blood pressure in 20 -30 yr old Pima Indians born in different eras (Total exams = 4, 764) 110 Main effect p=0. 0006 Gene x time interaction p= 0. 01 105 Mean Arterial Pressure (mm. Hg) GG GA 100 AA 95 90 85 80 70 1940 -50 1950 -60 1960 -70 1970 -80 Birth-era Time = environmental change Franks PW, et al (Hypertension, 2004)
The history of type 2 diabetes molecular genetics Risk of diabetes (Odds ratio) Biologic candidate approach Positional cloning Hypothesis-free approach 1. 40 TCF 7 L 2 1. 35 1. 30 1. 25 PPARG 1. 20 CDKN 2 A-2 B FTO HHEX-IDE SLC 30 A 8 CDKAL 1 IGF 2 BP 2 WFS 1 KCNJ 11 1. 15 1. 10 1. 05 1. 00 TCF 2 1998 1999 2000 2001 2002 2003 Year 2004 2005 2006 2007
DIAGRAM Consortium, Nat Genet (Epub 2008)
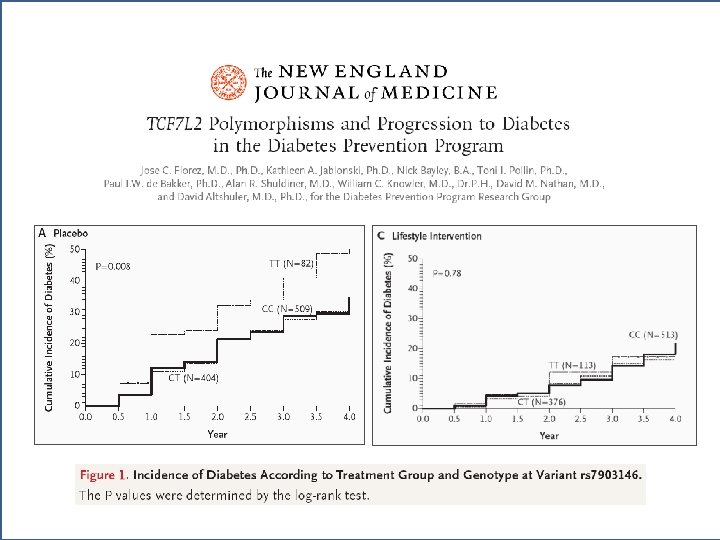
Replication of the TCF 7 L 2 genotype association with type 2 diabetes in the Diabetes Prevention Program • • • Individuals at high risk of diabetes (IGT and overweight/obese) Randomized to placebo, metformin or lifestyle intervention (or troglitazone) Followed for 3. 2 years – longitudinal analysis 68% women, 32% men ~3400 subjects genotyped Hispanic American 508 (16%) Asian/Pacific Islander 142 (4%) American Indian 171 (5%) African American 645 (20%) European American 1768 (55%) Knowler et al. NEJM, 2002 • Max weight loss was at 1 year into the trial
A gene-lifestyle interaction occurs when the effect of a lifestyle exposure on a disease trait differs in magnitude between genetic subgroups Disease trait Genotype Physical activity level
Thinking through the mechanisms before testing the hypotheses (the biologic candidate gene approach) Environmental exposures Lifestyle exposures high risk genotype Hormone flux Substrate flux Hypoxia Ca 2+ charge n ion tio ir pt a l c s m. RNA ans an r r T T Shear stress Mechanical stretch Energy charge Oxidative stress Nutrients Pharmacotherapy wildtype Disease Risk
Selecting candidate genes for interactions A candidate gene for interaction should: 1. encode a protein necessary for the development of the disease phenotype (or regulate other such genes or proteins) 2. be characterized by functional variation within its nucleotide sequence 3. be induced or repressed when exposed to the lifestyle factor N. B. : the “interaction” between genes and lifestyle factors that are not on the same causal pathway is highly improbable (additive effects predicted)
Gln 27 Gln Glu 27 X BMI (kg/m 2) Waist (cm) Physical activity (PAL) Sedentary Physically active
Meta-analysis of association between Pro 12 Ala genotype and BMI P<0. 05 Tönjes et al. , Diab Care (2006)
- Thiazolidinediones (TZD) - Polyunsaturated fats (PUFA) Physical activity ? ? ? PPAR γ RA Adipocyte differentiation Insulin sensitivity RXR PPRE Lipid & glucose metabolism Inflammation Muller & Kersten, Nat Rev Genet (2003) Deeb et al. , Nat Genet (1998) Luan et al. , Diabetes (2001)
Franks et al. , Diabetologia (2007)
Franks et al. , Diabetologia (2007)
Heritability of obesity ~80% Obesity BMI-z per risk allele: 1 -1. 5 kg increase in weight 16% Homozygous for risk allele 30% increased risk for obesity 40% Heterozygous for risk allele Slide courtesy of Ruth Loos
Andreasen et al Diabetes 2008
Summary Bona fide GEIs: • are informative of the molecular mechanisms of disease • help refine the search for ‘risk’ genes • enable subgroups of the population that are susceptible to disease in specific environments to be identified • may help define why some respond well to exercise intervention and others respond poorly
What might the future hold? • Genome-guided treatment ? (see: Roth SM, J Appl Physiol, 2008; Hunter DJ, NEJM, 2008) • Increased treatment effectiveness? • Fewer unnecessary side-effects? • Improved patient adherence? Now is the time to initiate translational research
Acknowledgments • • William Knowler MD Dr. PH (NIH, Phoenix) Nick Wareham FRCP Ph. D (MRC, Cambridge) Jose Florez MD Ph. D (Harvard, Boston) Many others Genetic Epidemiology & Clinical Research Group, Umeå: • Frida Renström, Anna Söderberg, Ema Brito, Monica Holmgren, Nicklas Fridberg, Lotta Parkstad • • Swedish Diabetes Association Swedish Heart-Lung Foundation Novo Nordisk Västerbotten’s Health Authority National Institutes of Health European Union Medical Research Council paul. franks@medicin. umu. se