Key terms Correlation Positive correlation Negative correlation No


 Grade achieved A*-U Amount of revision (in hours) 0")
 Grade achieved A*-U We can then use the scatter")


- Slides: 31
Key terms • • Correlation Positive correlation Negative correlation No correlation Task: Define each of these key terms. REVVING UP
Component 01 Research Methods 2/12/2022 Correlations L. O: To identify and describe different correlations and how a correlation co-efficient is calculated.
Progress Criteria GOING STRONG ACCELERATING REVVING UP How will you know that you have made progress this lesson? I can create a scatter graph to represent a set of correlational data. I can distinguish positive, negative and no correlations. I can define a correlation and identify the difference between correlation as a technique and a method.
Correlations • Correlation: a measure of how strongly two or more variables are related to each other: • Height is positively correlated to shoe size • The taller someone is, the larger their shoe size tends to be. • Like Self Report and Observation, there is no manipulation of data, conditions or groups in correlations. • No IV or DV, just to co-occurring variables (co-variables). Stretch & Challenge: If there is no IV, what can’t we establish? REVVING UP
• Unlike experiments there is no IV, just two variables that occur together as ‘co-variables. ’ • As there is no IV to manipulate we cannot establish cause and effect • We don’t know which variable is causing the other, we just know there is a relationship between them. Correlation Co. V ? Co. V NO CAUSE & EFFECT REVVING UP
Correlations • Still use the sampling methods: – Volunteer, self selected, random, snowball • Still consider the same ethical issues: – How many of the ethical issues can you identify? Give an example of how each ethical issue may need to be considered in a correlation. REVVING UP
Correlations can be both the primary method or secondary technique. • Self reports and observations can both be used as a way to gather data on variables, and then see if there is a relationship between them. • Experiments can compare the data between two groups using correlations. • I find out men have a stronger correlation between age and time spent looking in the mirror than women. Primary method: Correlations Secondary technique: Self report/Observation Primary method: Experiment Secondary technique: Correlation Stretch and Challenge: which core study uses experiment as the method and correlation as the technique?
Task • Activity 1: Identify other possible correlations we could investigate for age and sleep. • Extension: Identify any two variables you would find interesting to investigate (you will be expected to conduct your own investigation at a later stage). ACCELERATING
Positive and negative correlations • • • Positive Correlation: as one variable increases, so does the other. Negative Correlation: as one variable increases, the other decreases. No Correlation: there is no relationship between the variables. ACCELERATING Stretch and Challenge: The more revision is done, the higher the final grade is. Is this a positive or negative correlation?
Positive, negative and no correlations • Perfect Positive Relationship • No relationship • Perfect Negative Relationship ACCELERATING
Scatter diagrams • We can display correlation data in scatter diagrams. • One variable (amount of revision done) along one axis and another variable (final grade) along the other. • Each ‘point’ on the scatter diagram represents one participant: how much revision they put in and what their final grade was. GOING STRONG
Amount of revision (in hours) Grade achieved A*-U Amount of revision (in hours) 0 2 5 7 10 Final grade U E C B A*
Amount of revision (in hours) Grade achieved A*-U We can then use the scatter diagram to describe the relationship between the variables
Task • Plot one variable on the x axis and one on the y axis. • Plot using dots or crosses. • Remember to include: Title Clearly labelled both axes (including measurements when possible). GOING STRONG
Component 01 Research Methods 2/12/2022 Correlations L. O: To identify and describe different correlations and how a correlation co-efficient is calculated.
Progress Criteria GOING STRONG ACCELERATING REVVING UP How will you know that you have made progress this lesson? I can evaluate the strengths and weaknesses of correlations. I can explain what a correlation coefficient is and how to calculate a correlation co-efficient. I can define a different types of hypothesis.
Hypotheses • • Unlike Observation and Self Report we can generate hypotheses for Correlation Research. Recap: Null Hypothesis Alternate hypothesis (one tailed or two tailed). What is the difference between a one tailed and a two tailed hypothesis? REVVING UP
Hypotheses • Correlations can’t show cause and effect • Can’t mention the effect one variable will have on the other so we talk about the ‘relationship’ between two variables • Still using the term significant • Still must clearly state the variables and how they have been operationalised • NEVER using the words cause, effect or difference. REVVING UP
Hypotheses • • Null hypothesis: there will be no relationship There will be no significant relationship between V 1 and V 2. Alternate hypothesis: One tailed: There will be a significant positive/negative relationship between V 1 and V 2 Two tailed: there will be a significant relationship between V 1 and V 2. Which word(s) must you NEVER use in a correlational hypothesis? REVVING UP
Identify the type of hypothesis in each of these examples There will be a significant positive relationship One tailed alternate between number of pets owned and the amount hypothesis of money spent on pet food per week. There will be no significant relationship Nullmood hypothesis between a person’s and the amount of chocolate they consume. There will be a significant negative relationship between the amount of time One tailed alternate spent watching reality TV shows and hypothesis final exam grades. REVVING UP There will be a significant relationship Two tailed alternate between amount of exercise in hours per hypothesis week and weight in kilos.
• A psychologist is researching whethere is a relationship between the amount of time listening to music and self-esteem. She gives participants a questionnaire with two items: how many hours they spend listening to music per week on average, and a likert scale question asking them to rate their selfesteem from one to ten (where one is low and ten is high). Write three hypotheses for the research above: Ø Alternate one tailed hypothesis Ø Alternate two tailed hypothesis Ø Null hypothesis REVVING UP
Correlation Co-efficient • We can measure the strength of the relationship, by using inferential statistics. • Spearman's Rank Test is used with correlations. • Correlation Coefficient: a number between -1 and +1 that tells us how strong the relationship is. ACCELERATING
Correlation Co-efficient +1. 0 +0. 8 +0. 5 +0. 3 0 -0. 3 -0. 5 -0. 8 -1. 0 perfect positive correlation strong positive correlation moderate positive correlation weak positive correlation no correlation weak negative correlation moderate negative correlation strong negative correlation perfect negative correlation ACCELERATING
Spearman’s Rank • Spearman's RHO is a non-parametric statistical test and is used to find out whethere is a relationship between two variables. The criteria used are: Ø Ø Two variables with an ordinal or interval level of measurement. Design of the research is a correlation Looking for a relationship between two variables. Two sets of pairs scores are used. ACCELERATING
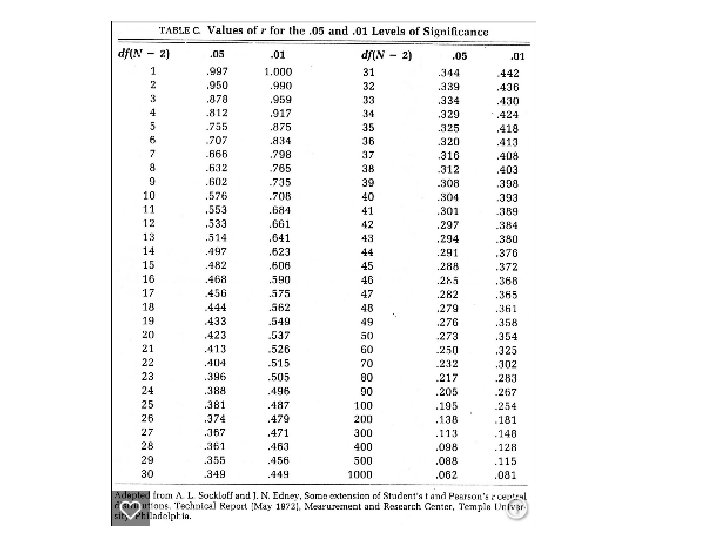
Formula • The formula for Spearman’s Rho produced the correlation coefficient. It is then compared to the critical value. Ø N: the number of participants (or pairs of scores) Ø Alternative hypothesis: directional (one-tailed or non-directial (two tailed) Ø Level of significance: the ‘p’ value. E. g p<0. 05 • If the observed value is greater than the critical value then the relationship is significant, so the null hypothesis is rejected and the alternative hypothesis accepted. • If the observed value is less than the critical values then the relationship is not significant so the null hypothesis is accepted and the alternative hypothesis is rejected. ACCELERATING
Task • Complete Activity 3. • Calculate the co-efficient for the data sets given. • What can we conclude from the correlation coefficient from this data? • Watch the video and then attempt the example: https: //www. youtube. com/watch? v=0 q. LKf. Mm 45 -4 ACCELERATING
What are the potential problems with correlations? • http: //www. buzzfeed. com/kjh 2110/the-10 most-bizarre-correlations. • Identify some possible explanations of the results. What interpretations could there be and why may the results may be misleading? GOING STRONG
Strengths of Correlations Makes a good pilot study to generate a hypothesis for an experiment. ü Can research variables that would be unethical to manipulate. ü Can understand the relationship between two variables (positive/negative, weak/strong). GOING STRONG
Weaknesses of Correlations do not show causation. They have the same weakness as whatever method was used to gather the data (observation/self report). Tell us nothing about other variables that may be the real cause Often correlations are misleading: NEVER USE DIFFERENCE, EFFECT OR CAUSE when describing a correlation. GOING STRONG
Write your own correlation Step 1: Decide on the variables that you want to measure (remember that the data you collect must be quantitative and at least ordinal level). Step 2: Decide on the method you are going to use to measure your variables. Remember, if you choose to use self-report, you will need to devise a questionnaire, containing two critical questions and filler questions. If you are using an observation, decide on event / time sampling and create a coding scheme. Step 3: Collect your data (minimum 10 participants). Step 4: Use your data to draw a scatter graph. Step 5: Decide if there is a correlation between the variables you have chosen to measure. Step 6: Produce your report for peer review.