
Key Findings and Deliverables Talent Pool Training Qualifications
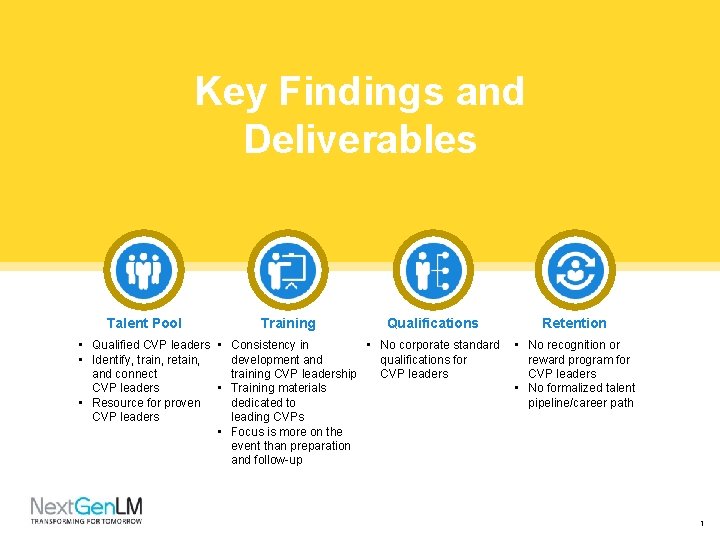
Key Findings and Deliverables Talent Pool Training Qualifications • Qualified CVP leaders • Consistency in • No corporate standard • Identify, train, retain, development and qualifications for and connect training CVP leadership CVP leaders • Training materials • Resource for proven dedicated to CVP leaders leading CVPs • Focus is more on the event than preparation and follow-up Retention • No recognition or reward program for CVP leaders • No formalized talent pipeline/career path 1

Subject: xxx Presenter: xxx Date: xxx June 2016 3
2016 CSBD Leadership Academy Action Learning Project (ALP Team #3) Executive Outbrief October 12, 2016 4
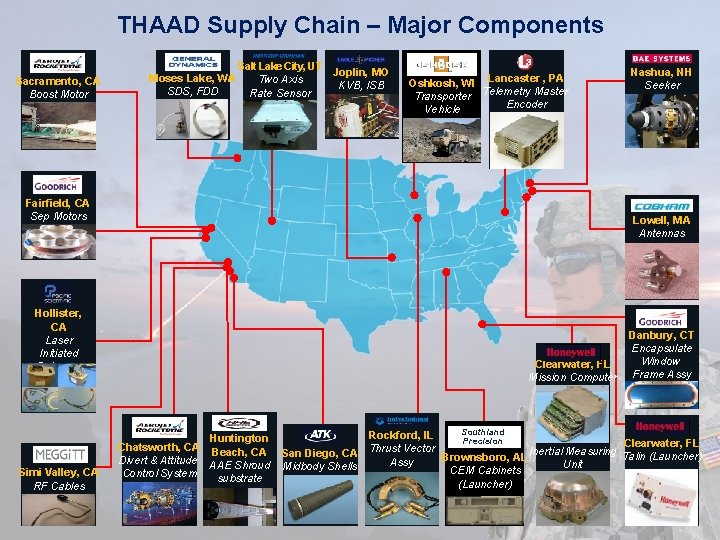
THAAD Supply Chain – Major Components Sacramento, CA Boost Motor Moses Lake, WA SDS, FDD Salt Lake City, UT Joplin, MO Two Axis KVB, ISB Rate Sensor Oshkosh, WI Lancaster , PA Transporter Telemetry Master Encoder Vehicle Fairfield, CA Sep Motors Lowell, MA Antennas Hollister, CA Laser Initiated Ordnance System, TIVS Simi Valley, CA RF Cables Nashua, NH Seeker Clearwater, FL Mission Computer Huntington Chatsworth, CA Beach, CA Divert & Attitude AAE Shroud Control System substrate Danbury, CT Encapsulate Window Frame Assy Southland Rockford, IL Precision Clearwater, FL Thrust Vector Inertial Measuring San Diego, CA Talin (Launcher) Brownsboro, AL Assy Unit Midbody Shells CEM Cabinets (Launcher)

Terminal High Altitude Area Defense (THAAD) Lockheed Martin Missile Orientation for New Hires June 2016 6
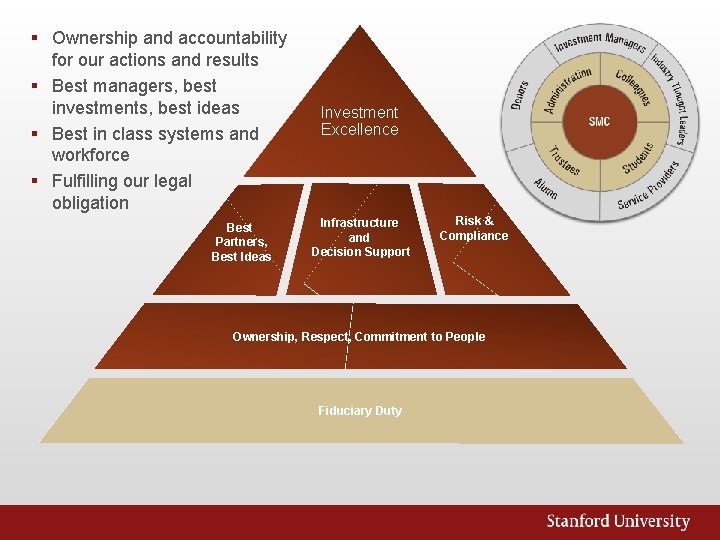
§ Ownership and accountability for our actions and results § Best managers, best investments, best ideas § Best in class systems and workforce § Fulfilling our legal obligation Best Partners, Best Ideas Investment Excellence Infrastructure and Decision Support Risk & Compliance Ownership, Respect, Commitment to People Fiduciary Duty
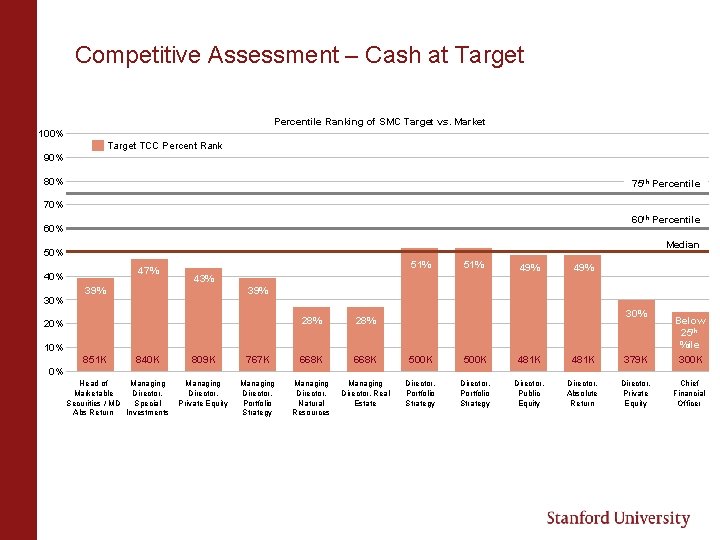
Competitive Assessment – Cash at Target Percentile Ranking of SMC Target vs. Market 100% Target TCC Percent Rank 90% 80% 75 th Percentile 70% 60 th Percentile 60% Median 50% 47% 40% 30% 51% 43% 39% 49% 39% 20% 28% 30% 10% 851 K 840 K Below 25 th %ile 809 K 767 K 668 K 500 K 481 K 379 K 300 K Managing Director, Private Equity Managing Director, Portfolio Strategy Managing Director, Natural Resources Managing Director, Real Estate Director, Portfolio Strategy Director, Public Equity Director, Absolute Return Director, Private Equity Chief Financial Officer 0% Head of Managing Marketable Director, Securities / MD Special Abs Return Investments
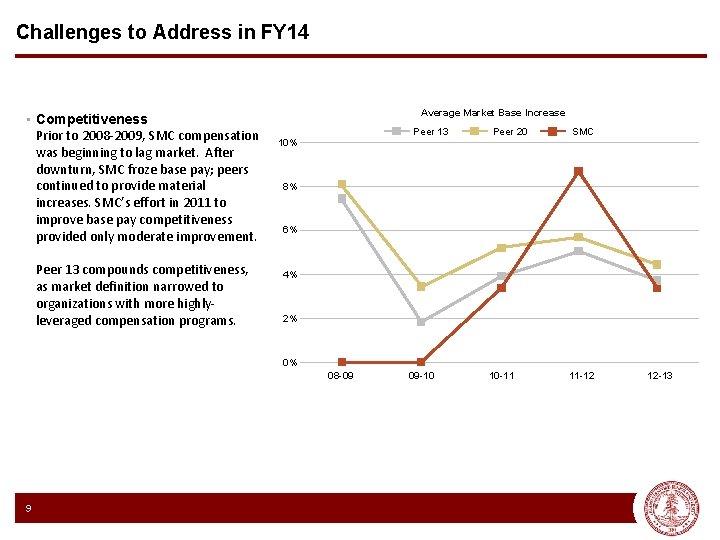
Challenges to Address in FY 14 • Competitiveness Prior to 2008 -2009, SMC compensation was beginning to lag market. After downturn, SMC froze base pay; peers continued to provide material increases. SMC’s effort in 2011 to improve base pay competitiveness provided only moderate improvement. Peer 13 compounds competitiveness, as market definition narrowed to organizations with more highlyleveraged compensation programs. Average Market Base Increase Peer 13 10% Peer 20 SMC 8% 6% 4% 2% 0% 08 -09 9 09 -10 10 -11 11 -12 12 -13

The Top 237 Tips • Be Prepared • Act Professional • Don’t Waste anybody’s time • You can add the next 234 to the list. . . Tips
Be Consistent – BUT be Unique • IF you are always presenting the same product or service build a consistent presentation. • BUT you always want to customize it to make the attendees feel special, and the meeting to NOT feel like it is a cookie cutter presentation Unique
JD Edwards Enterprise. One Release Enhancements Technology From Xe through Release 8. 11
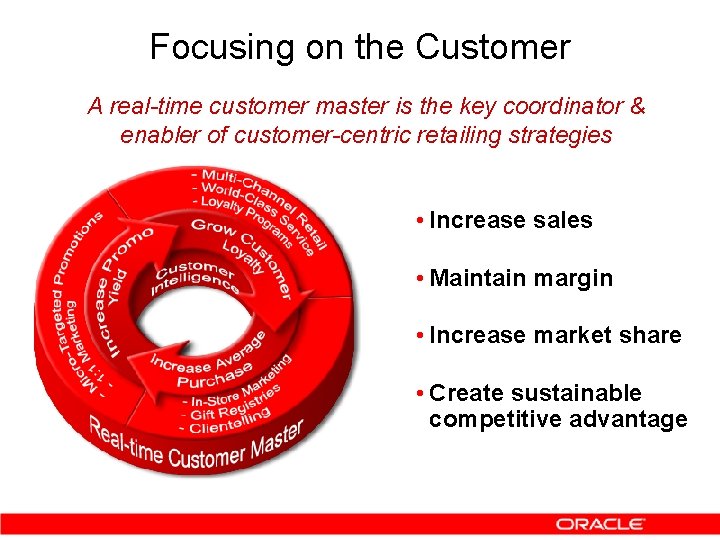
Focusing on the Customer A real-time customer master is the key coordinator & enabler of customer-centric retailing strategies • Increase sales • Maintain margin • Increase market share • Create sustainable competitive advantage Oracle Confidential – Do Not Distribute
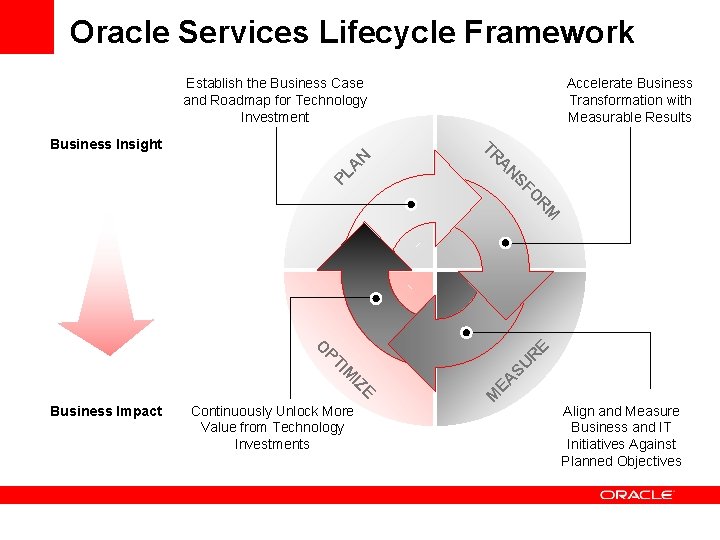
Oracle Services Lifecycle Framework Establish the Business Case and Roadmap for Technology Investment A N PL SF N A TR Business Insight Accelerate Business Transformation with Measurable Results O E M R SU EA E Continuously Unlock More Value from Technology Investments M IZ IM PT R O Business Impact Align and Measure Business and IT Initiatives Against Planned Objectives
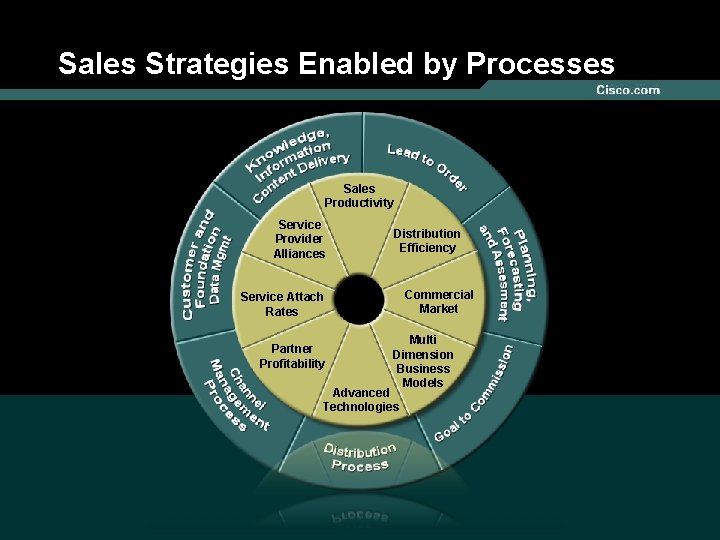
Sales Strategies Enabled by Processes Sales Productivity Service Provider Alliances Distribution Efficiency Commercial Market Service Attach Rates Partner Profitability Multi Dimension Business Models Advanced Technologies 16
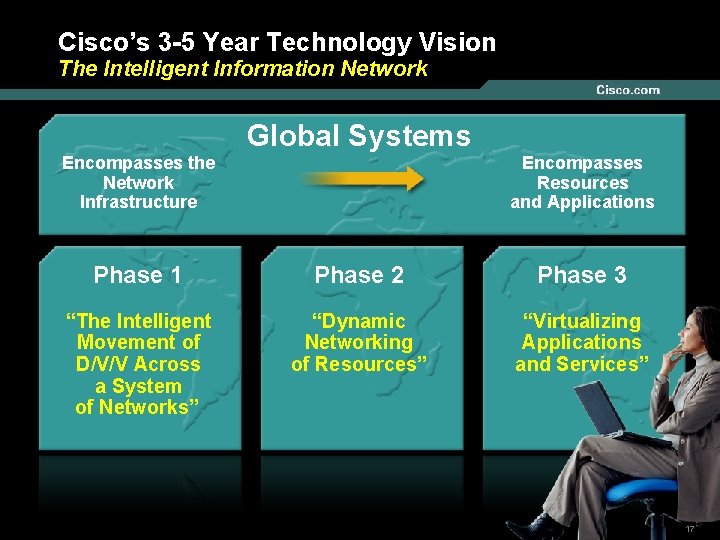
Cisco’s 3 -5 Year Technology Vision The Intelligent Information Network Global Systems Encompasses the Network Infrastructure Encompasses Resources and Applications Phase 1 Phase 2 Phase 3 “The Intelligent Movement of D/V/V Across a System of Networks” “Dynamic Networking of Resources” “Virtualizing Applications and Services” 17
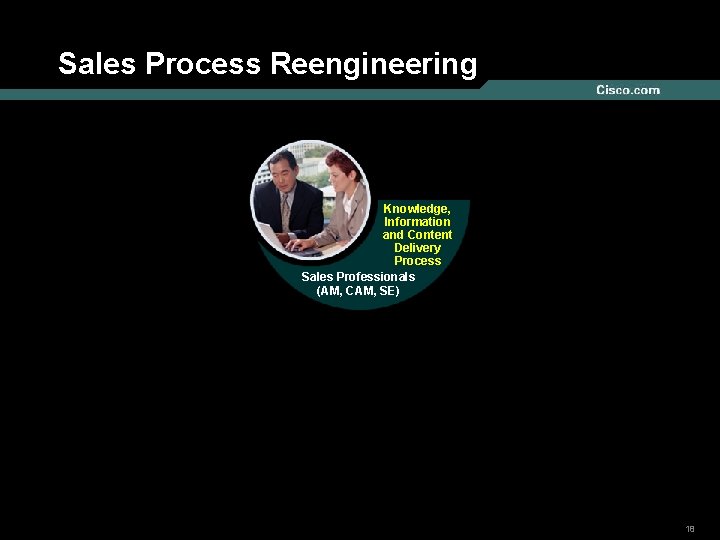
Sales Process Reengineering BUSINESS SUPPORT PROCESSES Planning, Forecasting & Assessment Processes Goal to Commission Process Knowledge, Distribution Information Process and Content Delivery Process Sales Professionals Channel (AM, CAM, SE) Management Process DATA/ INFORMATION Lead to Order Process Sales Business Manager (OD, AVP, Partner CEO) Customer & Foundation Data Management Process 18
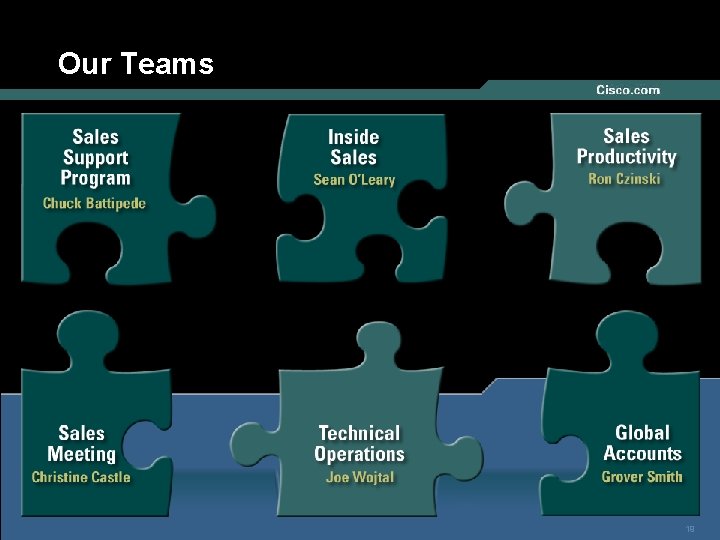
Our Teams 19
“Cisco Has No Competitors” • Response: Cisco Has Many Competitors § Traditional telecom equipment vendors like Lucent, NEC, Nortel, Alcatel, Ericsson, Siemens: have decades of relationships with large telcos § Point-product competitors: Juniper, Extreme, Ciena, Netscreen, Avaya § Low-cost entrants: Dell, Huawei § Venture-funded startups 20
Agenda • Then and Now • We Hear You • Overall Business Climate • Solutions • What Is Working • Our Focus Presentation_ID © 2003 Cisco Systems, Inc. All rights reserved. 21

- Slides: 22