Key Definitions Program design is the part of


 (CD_title) {Required} (CD_artist) {Required} (CD_category) {Required}")

- Slides: 29
Key Definitions Program design is the part of the design phase during which analysts create instructions for the programmers about how code needs to be written and how pieces of code need to fit together to form a program. The top-down modular approach begins with understanding the “big picture” and organizing it into discreet and understandable smaller pieces. 1 Power. Point Presentation for Dennis & Haley Wixom, Systems Analysis and Design Copyright 2000 © John Wiley & Sons, Inc. All rights reserved.
The Top-Down Modular Approach 2 Power. Point Presentation for Dennis & Haley Wixom, Systems Analysis and Design Copyright 2000 © John Wiley & Sons, Inc. All rights reserved.
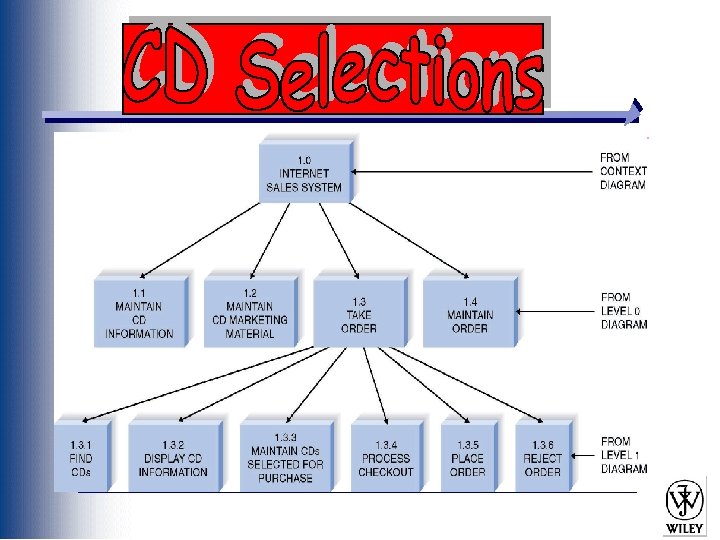
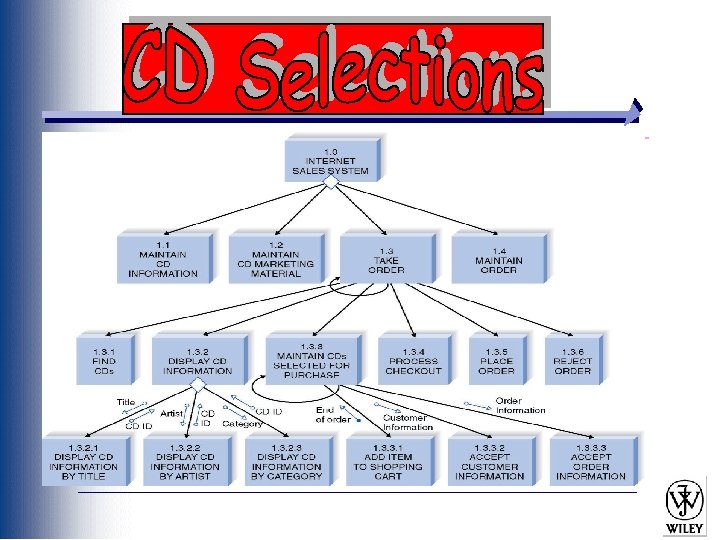
Structure Chart Slide 3 Power. Point Presentation for Dennis & Haley Wixom, Systems Analysis and Design Copyright 2000 © John Wiley & Sons, Inc. All rights reserved.
The Structure Chart Shows all components of code in a hierarchical format Sequence Selection Iteration 4 Power. Point Presentation for Dennis & Haley Wixom, Systems Analysis and Design Copyright 2000 © John Wiley & Sons, Inc. All rights reserved.
Structure Chart Elements 5 Power. Point Presentation for Dennis & Haley Wixom, Systems Analysis and Design Copyright 2000 © John Wiley & Sons, Inc. All rights reserved.
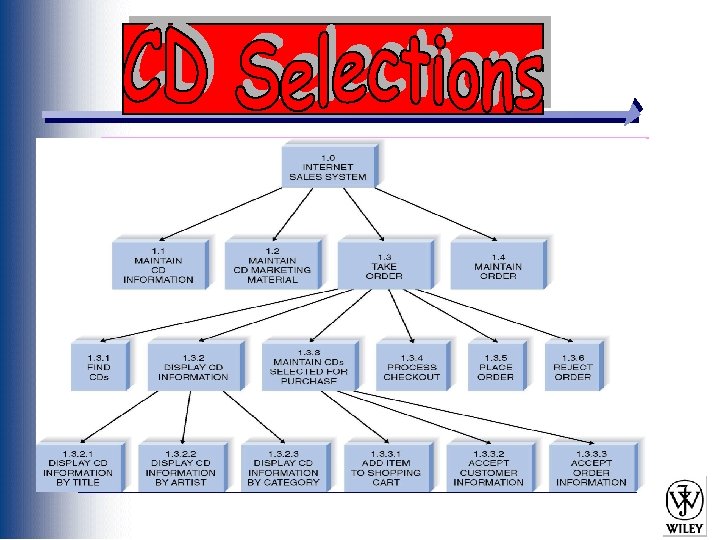
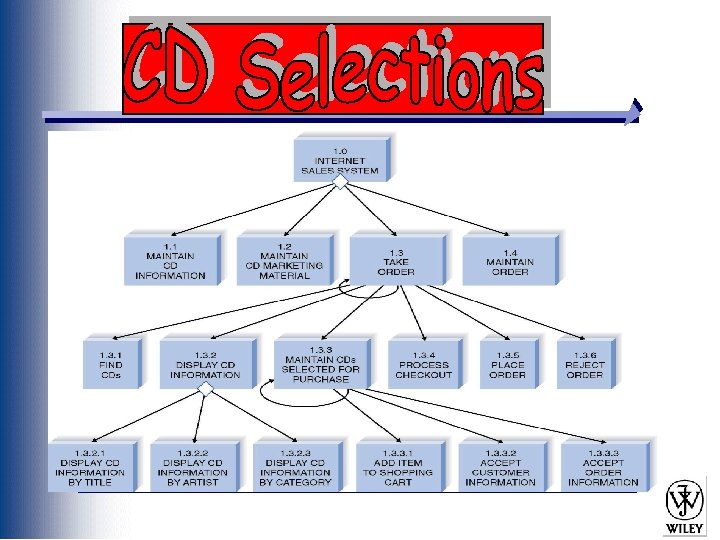
Revised Structure Chart Example 6 Power. Point Presentation for Dennis & Haley Wixom, Systems Analysis and Design Copyright 2000 © John Wiley & Sons, Inc. All rights reserved.
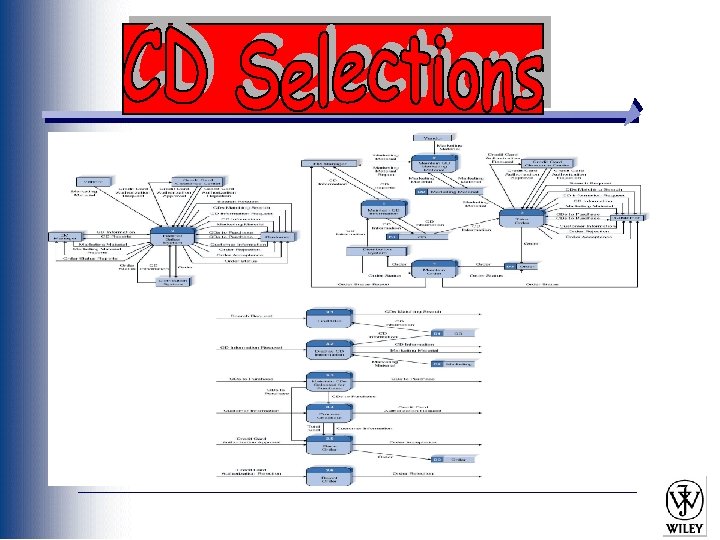
Building the Structure Chart Processes in the DFD tend to represent one module on the structure chart The DFD levelling can correspond to the structure chart hierarchy 7 Power. Point Presentation for Dennis & Haley Wixom, Systems Analysis and Design Copyright 2000 © John Wiley & Sons, Inc. All rights reserved.
Steps in Building the Structure Chart 1. Identify top level modules and decompose them into lower levels 2. Add control connections 3. Add couples 4. Review and revise again and again until complete 8 Power. Point Presentation for Dennis & Haley Wixom, Systems Analysis and Design Copyright 2000 © John Wiley & Sons, Inc. All rights reserved.
Typical Structures Transaction structures Control modules that send work to subordinates for various processing work Often one inflow and several outflows on DFD Transform structure Modules that work together to perform a task Often one inflow that is changed into another sort of outflow on DFD 9 Power. Point Presentation for Dennis & Haley Wixom, Systems Analysis and Design Copyright 2000 © John Wiley & Sons, Inc. All rights reserved.
Transaction Structure 10 Power. Point Presentation for Dennis & Haley Wixom, Systems Analysis and Design Copyright 2000 © John Wiley & Sons, Inc. All rights reserved.
Design Guidelines High quality structure charts result in programs that are modular, reusable and easy to implement. Measures include: Cohesion Coupling Appropriate levels of fan-in and fan-out 16 Power. Point Presentation for Dennis & Haley Wixom, Systems Analysis and Design Copyright 2000 © John Wiley & Sons, Inc. All rights reserved.
Types of Cohesion Functional Sequential Communicational Procedural Temporal Logical Coincidental 17 What Would Be an Example of Each? Power. Point Presentation for Dennis & Haley Wixom, Systems Analysis and Design Copyright 2000 © John Wiley & Sons, Inc. All rights reserved.
Example of Low Cohesion 18 Power. Point Presentation for Dennis & Haley Wixom, Systems Analysis and Design Copyright 2000 © John Wiley & Sons, Inc. All rights reserved.
Cohesion Decision Tree Adapted from Page-Jones, 1980 19 Power. Point Presentation for Dennis & Haley Wixom, Systems Analysis and Design Copyright 2000 © John Wiley & Sons, Inc. All rights reserved.
Factoring Separates tasks into different modules Reduces use of control flags 20 Power. Point Presentation for Dennis & Haley Wixom, Systems Analysis and Design Copyright 2000 © John Wiley & Sons, Inc. All rights reserved.
Types of Coupling Data Stamp Control Common Content 21 What Would Be an Example of Each? Power. Point Presentation for Dennis & Haley Wixom, Systems Analysis and Design Copyright 2000 © John Wiley & Sons, Inc. All rights reserved.
Examples of Fan-in and Fanout 22 Power. Point Presentation for Dennis & Haley Wixom, Systems Analysis and Design Copyright 2000 © John Wiley & Sons, Inc. All rights reserved.
Quality Checklist 1. Library modules have been created where ever possible 2. The diagram has a high fan-in structure 3. Control modules have no more than 7 subordinates 4. Each module performs only one function (high cohesion) 5. Modules sparingly share information (loose coupling) 6. Data couples that are passed are actually used by the accepting module 7. Control couples are passed from “low to high” 8. Each module has a reasonable amount of code associated with it 23 Power. Point Presentation for Dennis & Haley Wixom, Systems Analysis and Design Copyright 2000 © John Wiley & Sons, Inc. All rights reserved.
Program Specification Slide 24 Power. Point Presentation for Dennis & Haley Wixom, Systems Analysis and Design Copyright 2000 © John Wiley & Sons, Inc. All rights reserved.
Program Specifications Content No standard approach Include program information Note events that trigger actions List inputs and outputs Include pseudocode Present additional notes and comments 25 Power. Point Presentation for Dennis & Haley Wixom, Systems Analysis and Design Copyright 2000 © John Wiley & Sons, Inc. All rights reserved.
Program Specification Form 26 Power. Point Presentation for Dennis & Haley Wixom, Systems Analysis and Design Copyright 2000 © John Wiley & Sons, Inc. All rights reserved.
Pseudocode Example (Get CD-info Accept Return 27 module) (CD_title) {Required} (CD_artist) {Required} (CD_category) {Required} (CD_length) Power. Point Presentation for Dennis & Haley Wixom, Systems Analysis and Design Copyright 2000 © John Wiley & Sons, Inc. All rights reserved.
Summary The structure chart shows all of the functional components needed in the program at a high level. Components of the structure chart show sequence, selection, and iteration Follow design guidelines regarding cohesion, coupling, and fan-in/fan-out. Prepare detailed specifications to programmers including pseudocode to show important programming structures. 29 Power. Point Presentation for Dennis & Haley Wixom, Systems Analysis and Design Copyright 2000 © John Wiley & Sons, Inc. All rights reserved.