Ketone and NEFA testing as diagnostic tools in


")
 in early lactation is associated")

 Milk Keto-Test Urine")
 Test PV + PV- Apparent Prevalence")


 or plasma (purple top) • Avoid hemolysis •")


")
 •")
- Slides: 33
Ketone and NEFA testing as diagnostic tools in assessing transition dairy cows Stephen Le. Blanc OABP/OABA meeting April 14, 2005
Monitoring Programs for Transition Cows 1. Monitor Current Transition Cow Program – HERD LEVEL – – Track success and compliance with existing program Early detection of problems – Early treatment to prevent clinical disease 2. Monitor for Subclinical Disease - INDIVIDUAL LEVEL • Helps to quantify problems and direct investigation
Options for Monitoring or Investigating • Clinical disease incidence • Milk production • DMI – Why doesn’t it get done? ? – Group average; distribution within group – Target > 12 kg DMI average in close-up (heifers & cows; 3 weeks before due) – Fresh group • Metabolic tests
Daily Dry Matter Intake Around Calving CALVING *
Propionate AA Glycerol Gluconeogenesis Glucose NEFA Completely oxidized energy BHB Incompletely oxidized ketones Acetoacetate Acetone Re-esterified triglyceride Fetus Mammary gland Stored in liver Exported in VLDL
Propionate AA Gluconeogenesis Glucose NEFA Completely oxidized energy Unsuccessful response to NEB – Ketosis and Fatty liver BHB Incompletely oxidized ketones Acetoacetate Acetone Re-esterified triglyceride Fetus Mammary gland Stored in liver Exported in VLDL
Typical patterns of DMI and NEFA Overton/Burhans, 2001
Associations with health and performance • Pre-partum NEFA associated with: – ~ 4 X increased risk of LDA (Cameron et al, 1998; Le. Blanc et al, 2005) – ~ 1. 5 X increased risk of RP (Dyk, 1995; Le. Blanc et al, 2004) – 2 – 3 X increased risk of subclinical ketosis (Osborne, 2003; Gooijer et al, 2004)
Incidence of Subclinical Ketosis Median time to diagnosis of clinical ketosis = 11 DIM Duffield, 2000
Prevalence of Subclinical Ketosis Oetzel, 2003 Duffield et al 1998
Clinical ketosis treatment rate is a poor estimate of ketosis (Duffield et al 1998)
Associations with health and performance • BHB (subclinical ketosis) in early lactation is associated with: – 4 -8 X increased risk of LDA (Geishauser, 2000; Le. Blanc et al, 2005) – Decreased milk production (Duffield, 2000) – Increased severity of mastitis (Suriyasathaporn et al, 2000) – 50% decrease in pregnancy at first AI (Walsh et al, 2004)
Effect of subclinical ketosis in week 2 on CR at 1 st AI (Walsh et al, 2004)
Cow-side tests for ketosis (relative to serum BHB ≥ 1400 µmol/L) Milk Keto-Test Urine Ketostix (read at 5 • 100 µmol/L – Sensitivity = 83% – Specificity = 82% • 200 µmol/L – Sensitivity = 54% – Specificity = 94% Oetzel, 2004 • Powder lacks sensitivity seconds) • “small” (15µmol/L) – Sensitivity = 79% – Specificity = 96% Carrier et al, 2004 • Acetest tablet lacks specificity
Subclinical Ketosis Monitoring Programs (True Prevalence = 20%) Test PV + PV- Apparent Prevalence Keto-Test (100 umol/L) 62% 93% 23% Keto-Test (200 umol/L) 80% 87% 11% Ketocheck (Milk) 90% 86% 8% Acetest(Urine) 38% 100% 53%
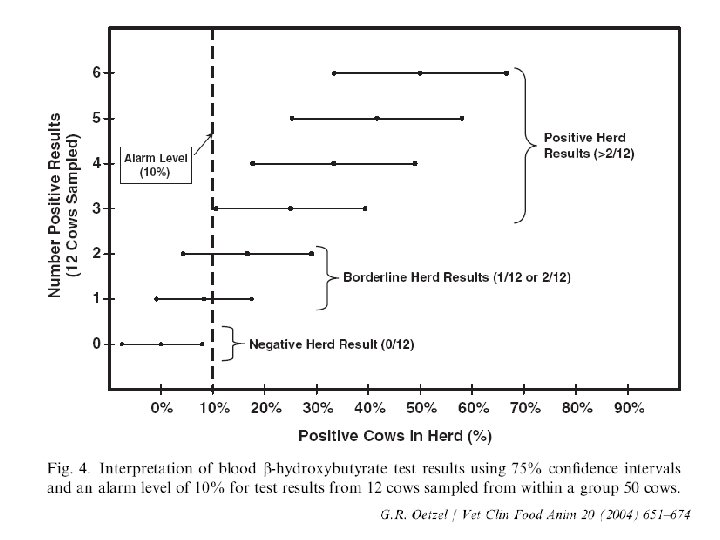
Sampling logistics • In a herd with 50 to 1000 cows, if a prevalence of “positive” tests – e. g. NEFA ≥ 0. 5 or BHB ≥ 1400 • And ≥ 10% is the threshold of interest • And you wish to be 75% confident of detecting this level of problem, then… • 13 samples are required • Oetzel proposes using 12 samples for NEFA and BHB blood testing for investigations
Metabolic Predictors of LDA • • 1184 animals in 20 herds Weekly visit by technician Same day, same time (AM) Cows enrolled 4 - 10 d prior to expected calving • Sampled weekly until the week after calving (Total of 2 - 4 samples) Le. Blanc et al, 2005
Le. Blanc et al, 2005
Le. Blanc et al, 2005
Prepartum DA model • Among all variables measured in last week before calving: OR 95% CI P NEFA 0. 5 m. Eq/L 3. 5 1. 9 – 7. 1. 0001 Sensitivity = 64% Specificity = 66% Le. Blanc et al, 2005
Simple Association of NEFA 4 -10 d before DUE with LDA NEFA OR Se Sp LR 0. 3 2. 3 63 56 1. 4 0. 4 2. 6 50 72 1. 8 0. 5 4. 1 46 82 2. 6 0. 6 3. 0 30 89 2. 6 0. 8 2. 6 17 93 2. 5 1. 0 4. 1 15 96 3. 8 Le. Blanc et al, 2005
Simple Association of NEFA 4 -10 d before DUE with LDA NEFA OR OR* Se Se* Sp Sp* LR LR* 0. 3 2. 6 63 61 56 61 1. 4 1. 6 0. 4 2. 6 2. 9 50 47 72 77 1. 8 2. 0 0. 5 4. 1 5. 1 46 43 82 87 2. 6 3. 3 0. 6 3. 0 3. 7 30 26 89 92 2. 6 3. 2 0. 8 2. 6 3. 0 17 12 93 96 2. 5 3. 1 1. 0 4. 1 5. 1 15 12 96 98 3. 8 5. 2 Le. Blanc et al, 2005 * Excluding cows within 2 days of actual calving
Postpartum DA model Variable OR 95% CI P RP 1. 7 1. 1 – 2. 7 . 01 Metritis 4. 8 2. 0 – 11. 2. 0003 BHB per 100 mol/L * 1. 08 1. 06 – 1. 1 . 0001 NEFA per 1. 0 m. Eq/L * 2. 4 1. 4 – 4. 3 . 002 Season, parity, MF, twins all NS Minimum significant cut-points in the model: BHB 1000 mol/L ; NEFA 0. 6 m. Eq/L Le. Blanc et al, 2005
Postpartum Simple Associations with DA Test NEFA BHB Cutpoint OR Se Sp LR 0. 6 4. 8 86 43 1. 5 0. 8 3. 9 68 64 1. 9 1. 0 4. 8 56 79 2. 6 1000 6. 3 69 74 2. 6 1200 8. 0 63 82 3. 5 1400 8. 0 53 88 4. 3 Le. Blanc et al, 2005
Postpartum Simple Associations with DA Test Cutpoint OR Se Sp LR Milk BHB 100 2. 8 64 62 1. 7 200 3. 4 48 80 2. 4 Le. Blanc et al, 2005
Sample handling • Serum (red top) or plasma (purple top) • Avoid hemolysis • Ideal: keep chilled, separate within a few hours, ship chilled to arrive at lab in 1 -2 days • Serum can be frozen for at least 1 month • What you could get away with: delay of < 24 h to separate; serum at room temp for < 24 h or in fridge for < 3 days (Stokol & Nydam, 2004)
Monitoring Energy Metabolism in Transition Cows • Pre-Calving - NEFA • Post-Calving - Ketones – Routine monitoring (milk or urine)
Monitoring Energy Metabolism in Transition Cows • Helps to direct investigation – What is the problem? – Where/when is the problem? • Rarely answers “WHY? ” – Need to look further and test hypotheses
Evaluation of a Rapid, On. Site Serum NEFA Test • • • 10 Guelph-area farms Prepartum blood sample (-7 to – 4 days) Harvested serum and aliquoted Measure NEFA concentrations: – Animal Health Laboratory (Hitachi 911 analyzer) – DVM NEFA Gooijer et al, ICPD 2004
Correlation between tests Pearson’s r = 0. 89 Gooijer et al, ICPD 2004
Test Characteristics of DVM NEFA (Gold Standard = AHL > 0. 4 m. Eq/L) AHL NEFA 0. 5 <0. 5 DVM NEFA >0. 4 133 7 140 0. 4 25 185 210 158 192 350 Sensitivity = 84% Specificity = 96% Gooijer et al, ICPD 2004
Maintaining Peripartum DMI • Fresh feed daily • Adequate bunk space (>60 cm) • > 100 ft 2/cow of pack • < 100% stocking • Separate heifer groups • Moderate BCS (3. 5) • Adaptation to new rations (3 -4 weeks) • Adequate e. NDF • Minimize group/pen changes • Heat abatement – THI > 72 – T > 27 C • Free choice water • 0. 5 – 0. 75% BW in concentrates • 60: 40 Forage: concentrate • Rumensin CRC