Kernel Tracing David Ferry Chris Gill CSE 522
- Slides: 8

Kernel Tracing David Ferry, Chris Gill CSE 522 S - Advanced Operating Systems Washington University in St. Louis, MO 63143 1

Class Notes Piazza page: – Search for CSE 522 under classes – Will become a class FAQ for subsequent semesters Extra readings on class page: – Not always intended to be read in full – Won’t have specific test questions from these CSE 522 S – Advanced Operating Systems 2

Debugging Linux Debuggers exist: –gdb –kgdb But have serious limitations: –Full debugging requires specialized, two machine setup –Limited ability to do execution stepping –Can still do breakpoints –Can still inspect memory contents –Can still inspect call stack Instead, tracing is used. CSE 522 S – Advanced Operating Systems 3

Simplest Tracer: printk() prints information to the system log – Messages stored in circular buffer – Can be read with dmesg – Eight possible log levels (set with dmesg –n) Example: printk(KERN_ALERT “bad thing %ld”, bad_thing); – Uses same format as printf() – Note there is no comma after log level CSE 522 S – Advanced Operating Systems 4

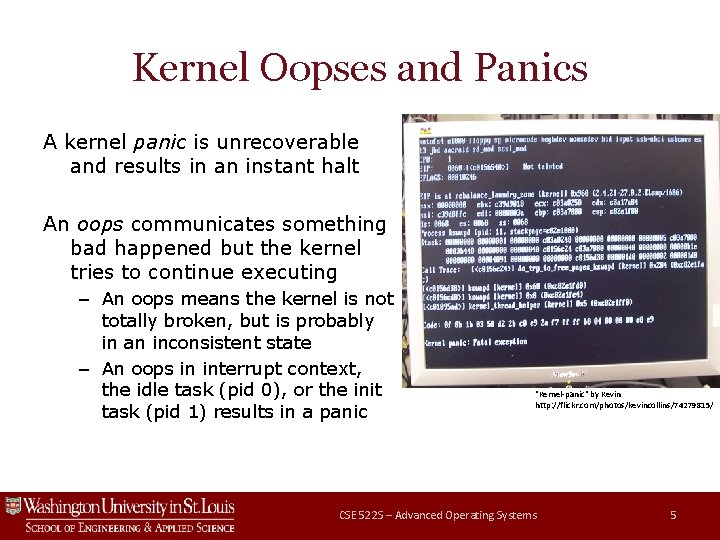
Kernel Oopses and Panics A kernel panic is unrecoverable and results in an instant halt An oops communicates something bad happened but the kernel tries to continue executing – An oops means the kernel is not totally broken, but is probably in an inconsistent state – An oops in interrupt context, the idle task (pid 0), or the init task (pid 1) results in a panic "Kernel-panic" by Kevin http: //flickr. com/photos/kevincollins/74279815/ CSE 522 S – Advanced Operating Systems 5

Ftrace – the Function Tracer Not just functions! Many features: – – – Event tracepoints (scheduler, interrupts, etc. ) Trace any kernel function Call graphs Kernel stack size Latency tracing • How long interrupts disabled • How long preemption disabled Has a user interface called trace-cmd Very nice graphical trace browser called Kernelshark CSE 522 S – Advanced Operating Systems 6

Ftrace Internals When tracing is enabled, the kernel maintains: – Per-CPU ring buffer for holding events – Per-CPU kernel thread that empties ring buffer If readers can’t keep up, data is lost Tracepoints in kernel: – Kernel maintains list of tracepoint locations – Locations normally converted to no-ops (ftrace_make_nop()) – Trace code is runtime-patched into kernel code when activated (ftrace_make_call()) CSE 522 S – Advanced Operating Systems 7

Userspace Tracing: Strace Allows one userspace process (tracer) to inspect the system calls made by another thread (tracee). 1. Tracer calls ptrace() on tracee 2. Tracee halts at every system call, system call return, and signal (except SIGKILL) 3. Tracer records info, and releases tracee to continue Note: • Tracing is per-thread • Seriously warps program timings CSE 522 S – Advanced Operating Systems 8