KEGIATAN BELAJAR 2 PENYAJIAN DATA KUANTITATIF Distribusi frekuensi

KEGIATAN BELAJAR 2 PENYAJIAN DATA KUANTITATIF

Distribusi frekuensi • Apa itu distribusi frekuensi?

• Suatu cara penyusunan data kedalam beberapa kelompok dan kemudian dihitung banyaknnya data yang masuk dalam penelitian.

Data Kuantitatif • Data kuantitatif berdasarkan pengukuran interval dan rasio – Data dari responden umumnya bervariasi sehingga memerlukan penyederhanaan data dengan cara mengelompokkan data menjadi kelas-kelas dan interval tertentu – Kaidah yang dipakai untuk penyederhanaan data biasanya menggunakan kaidah sturgess
 • Distribusi frekuensi – Pengelompokan data ke dalam beberapa kategori")
Penyederhanaan data (Distribusi Frekuensi) • Distribusi frekuensi – Pengelompokan data ke dalam beberapa kategori yang menunjukan banyaknya data dalam setiap kategori dan setiap data tidak dapat dimasukan ke dalam dua atau lebih kategori • Tujuan – Data menjadi informatif dan mudah dipahami

Distribusi Frekuensi Tunggal • Dalam suatu penelitian tentang Prestasi Statistik Mahasiswa “AMIK Harapan bangsa”, diperoleh data sebagai berikut. • Mata Pelajaran : Matematika • Jenis Kelamin Siswa : Pria • Jumlah Siswa : 72 orang

DEFINISI Pengelompokkan data menjadi tabulasi data dengan memakai kelas-kelas data dan dikaitkan dengan masing-masing frekuensinya

KELEBIHAN DAN KEKURANGAN • Kelebihan Dapat mengetahui gambaran secara menyeluruh • Kekurangan Rincian atau informasi awal menjadi hilang

Contoh distribusi frekuensi • Daftar nilai siswa: 60 60 65 70 75 80 80 65 60 65 80 No Daftar nilai siswa frekuensi 1. 60 -64 3 2. 65 -69 3 3. 70 -74 2 4. 75 -79 2 5. 80 -84 4 6. 85 -89 1

Contoh daftar nilai siswa Data mentah penilaian siswa dari kelas: 60 55 65 70 75 70 80 85 75 60 55 60 65 80 50 65 75 75 85 80 70 80 60 65 75

Contoh daftar nilai siswa 50 45 65 70 70 55 70 75 65 80 75 80 60 85 45 50 65 70 75 60 75 55 65 85 85 80 75 80 60 70 60 65 65 65 80

Contoh Soal
 • Mengurutkan data • Membuat ketegori")
Langkah – langkah Penyederhanaan data (Distribusi Frekuensi Bergolong) • Mengurutkan data • Membuat ketegori atau kelas data • Membuat Interval data • Membuat Tabel Frekuensi Melakukan penturusan atau tabulasi, memasukan nilai ke dalam interval kelas

Hasilnya
 terdiri dari : –")
Penyajian data dan interpretasinya • Tabel frekuensi • Diagram (grafik) terdiri dari : – Histogram : sama dengan diagram batang, hanya batangnya menempel (tidak terpisah) karena data yang disajikan bersifat Kontinyu – Poligon Frekuensi : grafik yang dihasilkan dengan menghubungkan puncak dari masing-masing nilai tengah kelas histogram. – Ogive : diagram yang dibuat dari frekuensi kumulatif. Sumbu horizontal menggunakan kelas, sedangkan sumbu vertikal menggunakan frekuensi kumulatif – Stem and leaf diagram (grafik batang daun) : Batang = bilangan, Daun = bilangan sisanya
 ke yang terbesar (Max)")
Langkah Pertama • Mengurutkan data : dari yang terkecil (Min) ke yang terbesar (Max) atau sebaliknya • Tujuan : – Untuk memudahkan dalam melakukan perhitungan pada langkah ketiga

Langkah Pertama Data diurut dari terkecil ke terbesar Nilai terkecil 56 Nilai terbesar 100 No Nama Kecamatan ∑ Masyarakat yang dilayani 1. Wado Setelah diurutkan 2. Ujung Jaya 3. Tomo 4. Darmaraja 5. Conggeang 6. Ganeas 7. Surian 8. Sumedang Selatan 9. Sukasari 10. Situraja 11. Rancakalong 12. Paseh 13. Tanjungmedar 14. Tanjungkerta 15. Jatinunggal 16. Buahdua 17. Cibugel 18. Cimanggu 19. Tanjungsari 20. Jatinangor 94 100 88 81 100 94 100 81 81 94 69 56 63 75 63 81 75 75 56 63 63 69 75 75 75 81 81 81 88 88 94 94 94 100 100

Langkah Kedua • Membuat kategori atau kelas data – Tidak ada aturan pasti, berapa banyaknya kelas ! • Langkah : – Banyaknya kelas/kategori sesuai dengan kebutuhan

Langkah kedua • Gunakan pedoman bilangan bulat terkecil k, dengan demikian sehingga 2 k n atau aturan Sturges Jumlah kategori (k) = 1 + 3, 322 Log n • Contoh n = 20 (k) = 1 + 3, 322 Log 20 l a m i in m h a 5 l (k) = 1 + 3, 322 (1, 301) u m t i u J i ya r o g Kete (k) = 1 + 4, 322 (k) = 5, 322

Langkah ketiga • Tentukan interval kelas : batas kelas nyata dan batas kelas semu. • Interval kelas adalah batas bawah dan batas dari suatu kategori Rumus : Nilai terbesar - terkecil Interval kelas = R /K= Jumlah kelas

Interval Kelas • Batas kelas nyata: antara kelas tidak terdapat loncatan nilai – Range (R)= (Max+0, 5) – (Min-0, 5) – K=kategori/Jumlah kelas – interval=R/K= (Max+0, 5) – (Min-0, 5) /K • Batas kelas semu: antara kelas terdapat loncatan nilai

Contoh • Berdasarkan data – Nilai tertinggi – Nilai terendah • Interval kelas = 100 = 56 : – = [ 100 -56] / 5 – = 8, 8 • Jadi interval kelas 8, 8 yaitu jarak nilai terendah dan nilai tertinggi dalam suatu kelas atau kategori

Interval kelas batas kelas semu Nilai tertinggi : = 56 + 9 = 65 Nilai terendah Kelas ke 2 = 75 + 1 = 76 Ada loncatan nilai antara kelas

Penyajian Data • Batas kelas – Nilai terendah dan tertinggi • Batas kelas dalam suatu interval kelas terdiri dari dua macam : – Batas kelas bawah – lower class limit • Nilai teredah dalam suatu interval kelas – Batas kelas atas – upper class limit • Nilai teringgi dalam suatu interval kelas

Contoh Batas Kelas Batas kelas atas Batas kelas bawah

Distribusi Frekuensi Relatif • Frekuensi setiap kelas dibandingkan dengan frekuensi total • Tujuan ; Untuk memudahkan membaca data secara tepat dan tidak kehilangan makna dari kandungan data
 Frekuensi relatif (%) 1 56")
Contoh Distribusi Frekuensi Relatif Kelas Interval Jumlah Frekuensi (F) Frekuensi relatif (%) 1 56 65 3 15 2 66 75 4 20 3 76 85 5 25 4 86 95 5 25 5 96 105 3 15 Frekuensi relatif (%) = [ 3 / 20 ] x 100 % = 15 %

Nilai Tengah • Tanda atau perinci dari suatu interval kelas dan merupakan suatu angka yang dapat dianggap mewakili suatu interval kelas • Nilai tengah kelasnya berada di tengah-tengah pada setiap interval kelas
![Contoh Nilai Tengah Nilai tengah Kelas ke 1 = [ 56 + 65] /](http://slidetodoc.com/presentation_image_h/20276762584ec6dc989f380c4e743807/image-29.jpg "Contoh Nilai Tengah Nilai tengah Kelas ke 1 = [ 56 + 65] /")
Contoh Nilai Tengah Nilai tengah Kelas ke 1 = [ 56 + 65] / 2 = 60, 5

Nilai Tepi Kelas – Class Boundaries • Nilai batas antara kelas yang memisahkan nilai antara kelas satu dengan kelas lainnya • Penjumlahan nilai atas kelas dengan nilai bawah kelas diantaranya dan di bagi dua
 Nilai Tepi Kelas 1 56 65")
Contoh Nilai Tepi Kelas Interval Jumlah Frekuensi (F) Nilai Tepi Kelas 1 56 65 3 55, 5 2 66 75 4 65, 5 3 76 85 5 75. 5 4 86 95 5 85. 5 5 96 105 3 95. 5 Nilai tepi kelas ke 2 = [ 65 +66 ] / 2 = 65, 5 105. 5

Frekuensi Kumulatif • Menunjukan seberapa besar jumlah frekuensi pada tingkat kelas tertentu • Diperoleh dengan menjumlahkan frekuensi pada kelas tertentu dengan frekuensi kelas selanjutnya • Frekuensi kumulatif terdiri dari ; – Frekuensi kumulatif kurang dari – Frekuensi kumulatif lebih dari

Frekuensi kumulatif kurang dari • Merupakan penjumlahan dari mulai frekuensi terendah sanpai kelas tertinggi dan jumlah akhirnya merupakan jumlah data (n) Kelas Interval Nilai Tepi Kelas Frekuensi kumulatif Kurang dari 1 56 65 55, 5 0 2 66 75 65, 5 3 3 76 85 75, 5 7 4 86 95 85, 5 12 5 96 105 95, 5 17 105, 5 20 0+0=0 0 + 14 = 14
 dengan frekuensi setiap")
Frekuensi kumulatif lebih dari • Merupakan pengurangan dari jumlah data (n) dengan frekuensi setiap kelas dimulai dari kelas terendah dan jumlah akhirnya adalah nol Kelas Interval Nilai Tepi Kelas Frekuensi kumulatif Lebih dari 1 56 65 55, 5 20 2 66 75 65, 5 17 3 76 85 75, 5 13 4 86 95 85, 5 8 5 96 105 95, 5 3 105, 5 0 20 – 0 = 20 20 – 3 = 17

Jadi Frekuensi Kumulatif Kelas Interval Frekuensi kumulatif Kurang dari Lebih dari 1 215 2122 214. 5 0 20 2 2123 4030 2122. 5 14 6 3 4031 5938 4030. 5 17 3 4 5939 7846 5938. 5 18 2 5 7847 9754 7846. 5 19 1 9754. 5 20 0 Nilai Tepi Kelas
 Prosentase(%) 1 2 10")
Tabel Frekuensi Distribusi Frekuensi Relatif n=20 Jumlah Anak Frekuensi (F) Prosentase(%) 1 2 10 2 6 30 3 3 15 4 4 20 5 5 25 Total 20 100 Interpretasi: jumlah anak yang dimiliki bervariasi dan tdk terlihat kecenderungan apakah jumlah anak cenderung besar atas sedikit. hal ini terlihat pada jumlah anak 2 (30%) dan 5 (25%)

Grafik • Grafik dapat digunakan sebagai laporan • Mengapa menggunakan grafik ? – Manusia pada umunya tertarik dengan gambar dan sesuatu yang ditampilkan delam bentuk visual akan lebih mudah diingat dari pada dalam bentuk angka • Grafik dapat digunakan sebagi kesimpulan tanpa kehilangan makna

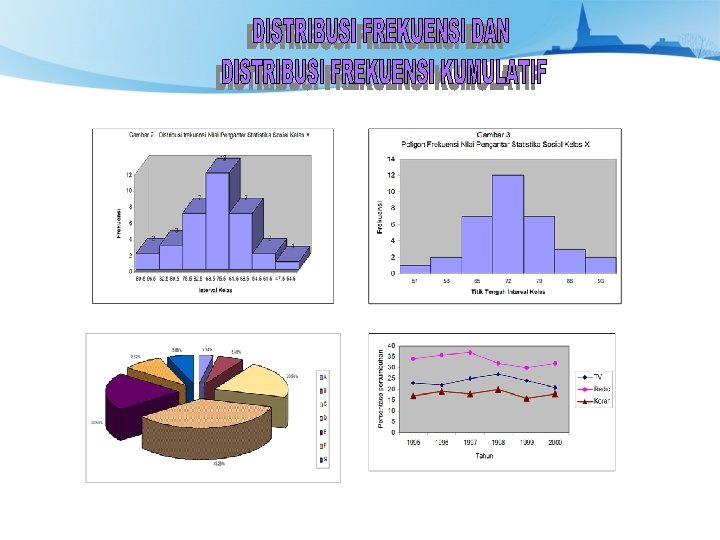
Grafik Histogram • Histogram merupakan diagram balok • Histogram menghubungkan antara tepi kelas interval dengan pada sumbu horizontal (X) dan frekuensi setiap kelas pada sumbu vertikal (Y) Kelas Interval Jumlah Frekuensi (F) 1 56 65 3 2 66 75 4 3 76 85 5 4 86 95 5 5 96 105 3

Histogram Masy yg dilayani

Grafik Polygon • Menggunakan garis yang mengubungkan titik – titik yang merupakan koordinat antara nilai tengah kelas dengan jumlah frekuensi pada kelas tersebut

Polygon

Kurva Ogive • Merupakan diagram garis yang menunjukan kombinasi antara interval kelas dengan frekuensi kumulatif Kelas Interval Nilai Tepi Kelas Frekuensi kumulatif Kurang dari Lebih dari 1 215 2122 214. 5 0 20 2 2123 4030 2122. 5 14 6 3 4031 5938 4030. 5 17 3 4 5939 7846 5938. 5 18 2 5 7847 9754 7846. 5 19 1 9754. 5 20 0

Contoh Kurva Ogive

Stem and leaf diagram

Soal 19 40 38 31 42 23 16 26 30 41 18 27 33 31 27 43 56 45 41 26 30 17 50 62 19 20 27 22 37 42 37 26 28 51 63 42 27 38 42 16 30 37 31 25 18 26 28 39 42 55

Latihan LATIHAN : Berikut dilaporkan sebaran data waktu keterlambatan 50 pegawai yang tidak mengikuti apel pagi (menit Buatlah - Tabel Distribusi Frekuensi Kumulatif

Latihan : Contoh : Data berikut merupakan nilai ujian Mata Kuliah Statistika dari 34 Mahasiswa AMIK Harapan Bangsa 71 68 82 75 75 90 72 75 57 88 62 68 88 71 68 65 64 75 74 68 80 71 79 75 75 81 84 80 82 81 75 90 48 57
- Slides: 48