KDS GLOBAL UBXTM moving at the speed of

KDS GLOBAL UBXTM moving at the speed of thoughts to create knowledge exchange

Table of Contents q Strategic Objectives q Who we are q Current Products & Services – www. kdsglobal. com q q UBXTM: Technology Overview q Prepayment On-Demand Analytics Services q Modeling: Prepayment, Credit, Interest Rates and Forward Curves q MBS Pool and Loan Level Risk Scores(P, R, D, B, &Q) q Long-Range Bid , Short-Range Bid vs. Dealer Ask Price Future Opportunities

q Core technology transfer to achieve the followings: q q AI & ML– Risk Scoring Technology based Products Vertical Mortgage Markets q q q ATOMSTM & Tradable Specified Pool(TSPTM) Index q q q Servicing - MSR valuation and retention advisory Origination - Credit Risk Management Securitization- SCW, Deal libraries, CLC data Buyside - Pricing Benchmark – model driven intrinsic value Trading: ETF / Futures Options Benchmarking MBS transaction business – All-to-All Trading Exchange Platform q Trading platform – benchmark pricing

www. kdsglobal. com q Subscription q q Transaction q q q Prepayment Data and Analytics On-Demand Valuation Services Non. Agency Remittance reporting All-to-All Trading Exchange Partnerships Structured Cashflow Waterfall Deals Advisory q q q Credit Risk Management Prepayment Risk Management MSR Valuation and Retention

q q q Subscription: q annual growth rate 5 -10% average for the next 5 years Transaction: q pricing service offered to broker/dealer, buy/sell side; search engines; annual growth rate 20 -30% in 5 years; Advisory: q principal transaction in issuance, trading, and operation; annual growth rate 25 -35% in 5 years;

Leveraging our core competencies: p p p Agency MBS BIG data infrastructure. Expertise in massive parallel computing for BIG data analytics. Daily MBS long-range & short-range bid price for 1. 5 M cusip universe.

q q Become the “market price benchmark” Generate alpha for our clients via tighter bid/ask, higher liquidity, and greater transparency. Increase market efficiency in the “off-the-run” and specified pools. Entire mortgage market: Pass. Through & Structured Products markets at both the collateral and bond levels >$6 T We want to be here We are here now…

Company Overview

q q q Market leader in prepayment data analytics built on our patented UBXTM high speed virtual pocket sorting and indexing core technologies. Complete Pass. Through & Structured Derivative Products libraries at both collateral and bond levels. AI & ML predictive modeling – developing the “next generation” of risk scoring technologies. UBXTM Matrix Computing Architecture
 q QED Options Pricing")
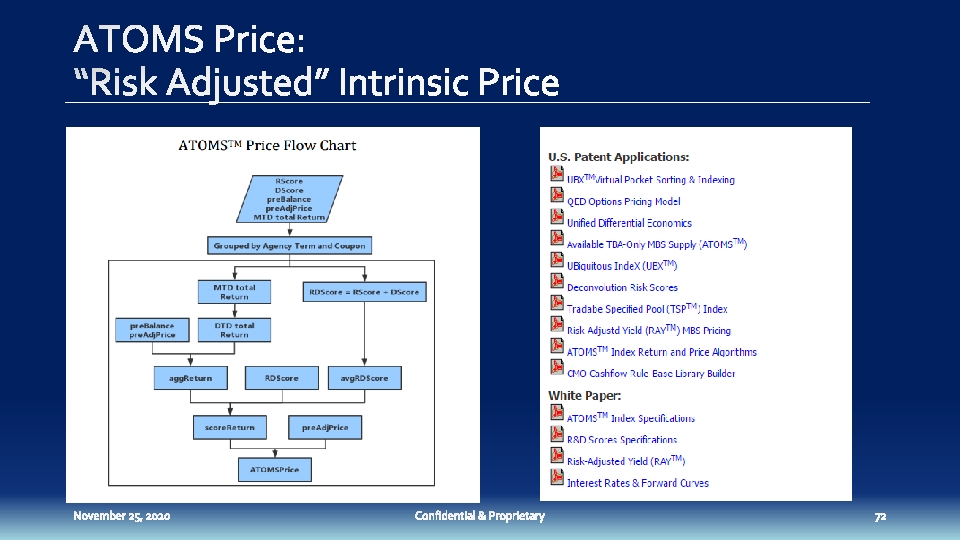
q UBXTM Virtual Pocket Sorting & Indexing (US 005278987 A) q QED Options Pricing Model q Unified Differential Economics q Available TBA-Only MBS Supply (ATOMSTM) q UBiquitous Inde. X (UBXTM) q Deconvolution Risk Scores q Unified TSPTM Index Return and Price Algorithms q Risk-Adjusted Yield (RAYTM) MBS Pricing q Unified ATOMSTM Index Return and Price Algorithms q CMO Cashflow Rule-Base Library Builder
 matrix computing architecture technology (USPTO")
UBX™ Solving BIG DATA Problems UBiquitous inde. X (UBX™) matrix computing architecture technology (USPTO Patent Application Number: 24300156 -622646952690)

www. kdsglobal. com q q q q Prepayment BIG Data and Analytics On-Demand Valuation Services Prepayment and Forward Curve Modeling Non-Agency Remittance reporting ATOMSTM & TSPTM Index Daily Risk Scores for 1. 5 million cusips SDPTM Advisory Service QED Options Trading model

q 2000: Web based prepayment on-demand mortgage analytic services q 2008: Monte Carlo simulations of $30 billion distressed asset acquisition q 2013: QED field effect sell OTM call & put option pricing model q 2015: ATOMS™ Index tracking TBA-Only pricing & returns q 2016: TSP™ Index pricing risk adjust yield, OAS, duration, convexity q 2017: Achieve bid/ask transparency & liquidity via MBS pricing matrix

Technology Overview

UBXTM Enables the Vertical Channel Integration of the Mortgage Markets The BIG DATA v v Agency database, 1988 – today, loan & pool levels, mega/giant/platinum CMO deals fully expanded CAS/STACR deals, Single Family Loan Level Credit data, RPL Data hosted for clients UBX TM
 sorter to")
TM UBX Platform q q Patented and patent pending technologies q O(n) sorter to handle large dataset q Unique ways to handle data extensions UBXTM: massively parallel data analytics platform q Completely designed, developed, and maintained by KDS, in C++ q All data fields are indexed by our patented sorter

Web GUI Excel Plugin CGI API Middleware Sys. Governor Compute Node 1 Sys. Governor Compute Node 2 Sys. Governor Compute Node N

UBX Middleware HTTP REST Services No. SQL data store K++ Machine - request Failover Scripting Learning patterns and Load Engine Algorithm balancing and business logic

q Local/Hybrid Clouds : Massive data history and analytics (3, 000+ CPU and 8 TB high speed RAM 1, 800 TB ) q Patented Technologies q Major market share in Agency Prepayment Data business q AI Predictive Modeling : R & D Scores q Highly Knowledgeable Subject-Matter-Expert Mgmt Team q BIG Data Infrastructure Technology : ATOMS™ Index

Prepayment On-Demand Services
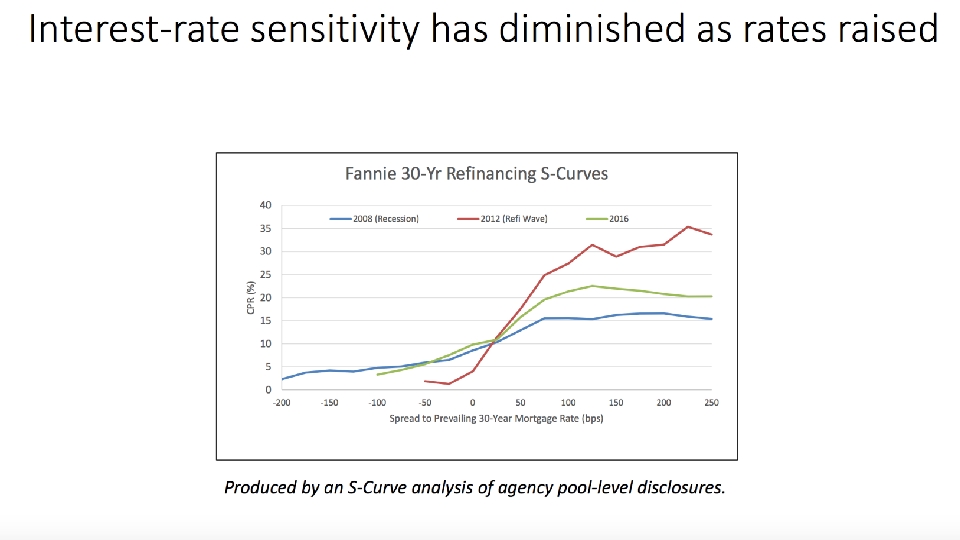

S - Curves Freddie 30 -Year S-Curves By Current LTV (May 2016 – Apr 2017) 80 -85% 85 -90% 90 -95% 95 -100% Conditional Prepayment Rate (%) 25 20 15 10 5 0 -100 -50 0 50 100 Refinancing Incentive (bps) 150 200 250

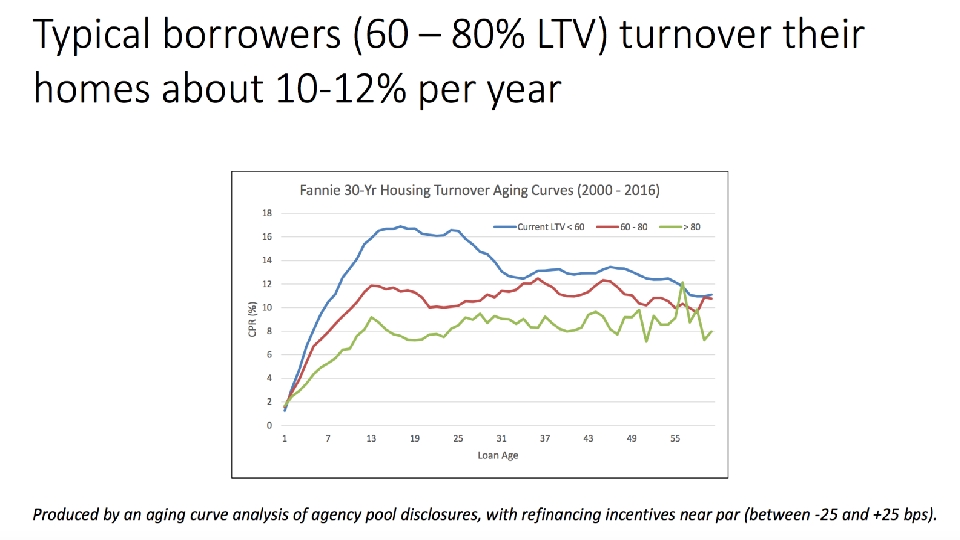
Aging Curves 2014 Conventional 30 -Year Aging Curve by Orig LTV 80 -85 85 -90 90 -95 Conditional Repayment Rate (%) 40 35 30 25 20 15 10 5 0 0 3 6 9 12 15 18 21 24 27 30 33 36
")
Fannie 30 -Year Cumulative Liquidation Rates by Vintage and PMI Coverage Level (Dec 2016) 25% 20% 15% 10% 5% 0% 2003 2004 2005 <10% 2006 10 -20% 2007 20 -30% 2008 >=30% 2009 2010
 60%")
Fannie 30 -Year Loss Severities by Vintage and PMI Coverage Level (Dec 2016) 60% 50% 40% 30% 20% 10% 0% 2003 2004 2005 <10% 2006 10 -20% 2007 20 -30% 2008 >=30% 2009 2010

Prepayment, Credit, and Rates Modeling

Inventory of Models and Analytics q Prepayment & Default Models q Interest Rate/Yield Curve Models q HPA Models q Intex Subroutine based pricing analytics
 Subprime Pay option")
Prepayment/Default/Severity Models q q q FNMA/FHLMC/GNMA Jumbo Alt-A (conforming and non-conforming) Subprime Pay option ARMs (MTA/COFI/Libor)

Prepayment/Default/Severity Models q q Projects monthly prepayment, delinquency, default and loss of new (at purchase) or seasoned (portfolio) loans, and generates collateral cash flows. Based on a proprietary highly non-linear, non-parametric methodology with parameters estimated from agency and non-agency loan-level data. Loan-level model takes into account of loan, borrower and collateral risk characteristics as well as macro economic variables on rates and home prices. Based on a competing risks survivorship model where the prepay & default risk parameters are estimated from historical loan-level data.

Prepayment/Default/Severity Models q Model Inputs q q q Collateral type (e. g. , agency/non-agency, alt-a, non-conforming balance, no prepay penalty) age, note rate, mortgage rate, yield curve slope HPI, (state-level if used as loan-level, otherwise national) loan amount, documentation, purpose, state, fico, LTV, risk grade, occupancy, channel delinquency state (for seasoned default models) Model Outputs q q q prepayment and default probabilities at each time step 60 day+ delinquencies loss severity

20 11 20 /5/15 11 20 /7/15 1 20 1/9/1 11/ 5 20 11/15 12 20 /3/15 12 20 /5/15 12 20 /7/15 1 20 2/9/1 12/ 5 20 11/15 13 20 /3/15 13 20 /5/15 13 20 /7/15 1 20 3/9/1 13/ 5 20 11/15 14 20 /3/15 14 20 /5/15 14 20 /7/15 1 20 4/9/1 14/ 5 20 11/15 15 20 /3/15 15 20 /5/15 15 20 /7/15 1 20 5/9/1 15/ 5 20 11/15 16 20 /3/15 16 20 /5/15 16 20 /7/15 1 20 6/9/1 16 /11 5 20 /15 17 20 /1/15 17/ 3/1 5 cpr(%) Prepayment Model: Backtest 45 Actual vs Model (FN 4. 0 2011) 40 actual model 35 30 25 20 15 10 5 0

HPA Forecast Model q q q A mean-reversion based HPA forecast model Based on a target long term HPA using historical “mean” mean-reversion parameters tunable for faster or slower mean reversion

Interest Rate/Yield Curve Models q q q Three-Factor Libor Market Model Calibrated to the end-of-day swap curve Swap curve derived from LIBOR spot, futures, intermediate and long term swap rates Volatility curve calibrated from a series of market option prices daily Sophisticated Monte Carlo simulation algorithms for very fast convergence

Intex Subroutine Based Pricing Analytics q q q Pricing of various tranches of mortgage ABS using loan-level based prepay/default/severity models Stress analysis for HPA, interest rates, default, prepay Breakeven analysis & discount margin calculation

Applications - not just MBS… q Pricing and risk analysis of --q mortgage whole loan portfolios q mortgage securities (including CDOs). q mortgage servicing rights q derivative hedges for mortgage portfolios and/or service rights

Strategic Research & Development : R & D Scores MBS Risk Scoring 2. 0 (Overview)

Why R&D Scores? The Problems with traditional models A common complaint about Prepayment, Credit, and Interest rate modeling is: What are the assumptions to the model? I don’t understand the assumptions to the model. OR The assumptions no longer apply. We need to re-calibrate the assumptions BUT if you recalibrate the model too frequently…is it a credible model to begin with?

R&D Scores – Revolutionary Deconvolution defined q q Deconvolution is widely used in the techniques of signal processing and image processing. R+D scores leverages Deconvolution in an AI framework consisting of hyper multidimensional data encoding-decoding process based on our patented Deconvolution Algorithms. Imposes very few assumptions about the data structure in each of the dimensions allowing the data itself to make predictions. Key innovation: integrates macro-economic cycles of credit and market risks from the interacting characteristics of individual loan profiles, agency and servicer treatments, underwriting, and government monetary and housing polices.
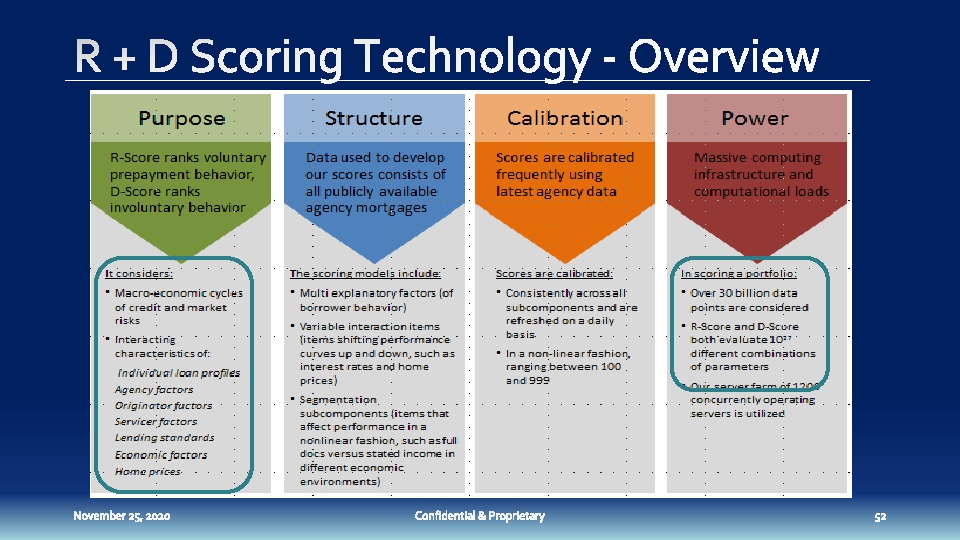

q q KS statistics, R-score is 3. 5 x more predictive than the scurve. When selecting the first 20% volume, R-score is able to capture 56. 2% of the loans that paid off voluntarily. KS statistics, D-score is 2. 6 x times more predictive than the FICO score. When selecting the first 20% volume, D-score is capable to capture 78. 0% of the loans that paid off involuntarily

Risk Scoring Technology

Score Calculation: Flowchart Loan Level Details Loan Level Characteristics • • • Bucketing Scheme Deconvolution Scheme Model Parameters Macro-Economic Impact (for each individual factor and interaction terms) (PMMS, HPI, EHS) Scores (RScore, DScore, PScore, BScore, QScore) • • Agency Origination year Performance year Age Term Orig/curr interest rate FICO SATO Loan amount Scheduled monthly payment LTV DTI Product Purpose Channel Combined ltv Doc Property # units Occupancy loan type State Seasonality appraisal value, sale price • servicer, seller • # borrowers, 1 st time buyer • MIP • • •

q Actual vs. Model: q Shows the Actual 3 mth CPR vs. Predicted 3 mth CPR … 3 mths ago. q q Fit is at least as good as the best prepayment models. Purchase and Refis

D-Score: Back-tested…high predictive D-Score ranking within a narrow slice of FICO 720 -726. A simple look into a multidimension of the framework. D-Score has been back tested to prove that it is highly predictive of default.


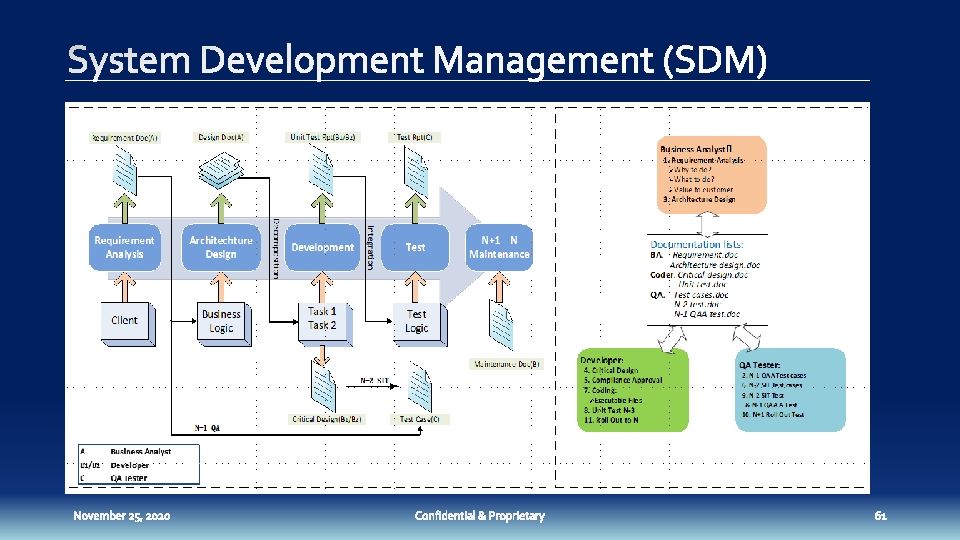
System Development Management

Back-Testing Score Effectiveness: Case Study q Client Servicing Portfolio: q GNMA over the last 2 yrs (2015 -2017) q R-Score - Predicting Voluntary Prepayments q D-Score in Predicting 150+ Delinquency
 vs. Actual Back test demonstrates R-Score is highly predictive")
R-Score: PIFs (Paid in Full) vs. Actual Back test demonstrates R-Score is highly predictive of Client’s GNMA fixed rate servicing book prepayment behavior for 12 mth period

R-Score Bands : Aggregate Balances

D-Score: 150+ day delinquency by time buckets Back test demonstrates D-Score is highly predictive of Client’s GNMA fixed rate servicing book 150+ delinquency behavior for a 12 month period

D-Score Bands: Aggregate Balances

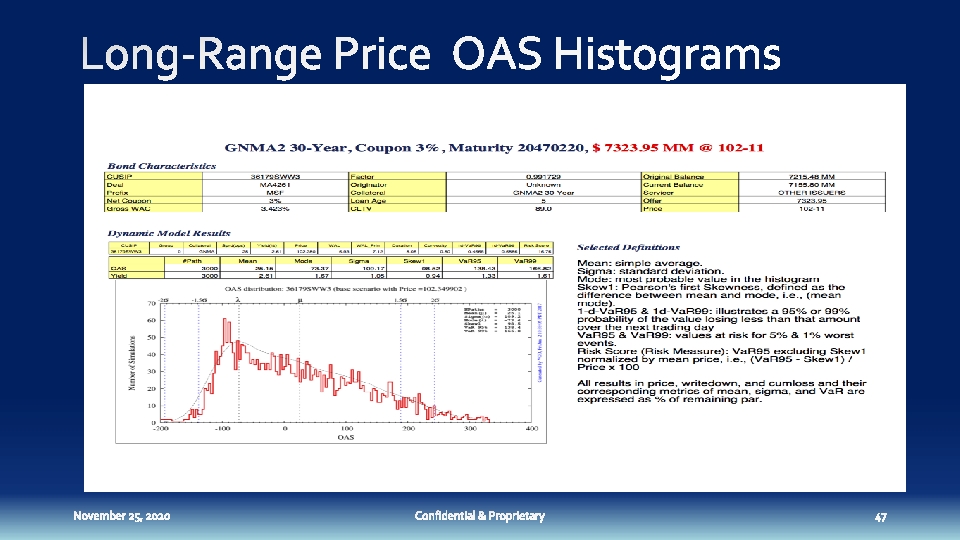
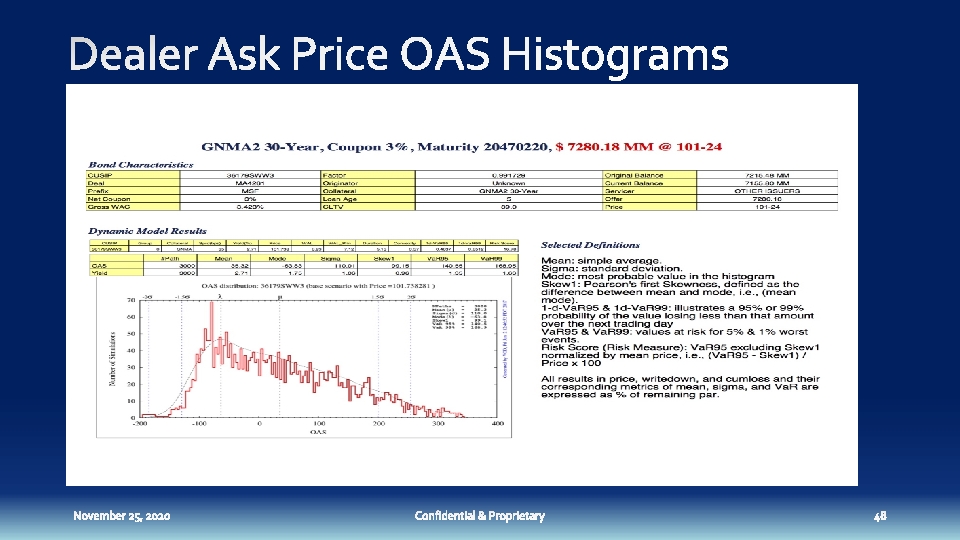
Trading Analytics: Long Range Bid, Short Range Bid, Dealer Ask Prices

Analyze All Tradeable Pools Calculate R&D scores Generate Execution and Eigen Prices Generate RAY/RAP Identify Trading Opportunities on pool level
 Price X: 1 -180, 000")
MBS Pricing Matrix Powered by ATOMS Technology ATOMSTM (X) Price X: 1 -180, 000 CUSIPs ATOMSTM (Available TBA-Only MBS Supply CUSIP (N) Index) N : 1~ 1. 5 M Dealer Price Ask Execution Price Short Range Bid Eigen. Price Long Range Bid TSP™(Tradable Specified Pool Index) R Score. TM (Repayment , Voluntary Prepayment) D Score. TM (Default, Involuntary Prepayment) Unified deconvolution approach to compute financial systemic risk scores RAYTM (Risk-Adjusted Yield MBS Pricing)

q q Rich / Cheap Analysis: Measure each CUSIPS’ relative value vs. dealers offer price. Here are 3 groupings of “relative value” – Good, Bad, Ugly Available via subscription and batch process. Simpler and more effective than OAS or curve spreads.


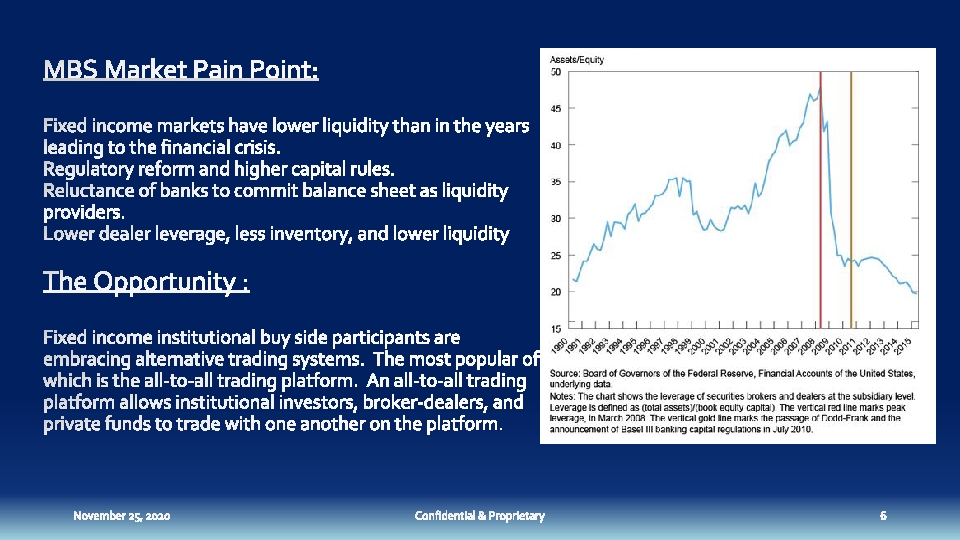
MBS Market Pain Point: Fixed income markets have lower liquidity than in the years leading to the financial crisis. • Tougher regulatory and higher capital requirements. • Reluctance of banks to commit balance sheet as liquidity providers. • Lower dealer leverage, less inventory, and lower liquidity.

• Total trading activity • Ability of market to self correct • Smaller bid/ask spread Transaction Volume Transaction Cost Resilience Depth q q q • The ease of executing large trades q Total trading volume: measures the dollar volume of transactions – higher volume is associated with higher liquidity. Transaction Cost: execution at midmarket, Smaller bid/ask spread. Resilience: Ability of market to self-correct after sell-off or price dislocation. Depth: The ease of executing large trades.

Lower Transactions Costs Smaller Bid/Ask Spread Increase Market Resilience • ATOMS ™ Index provides real-time pricing of all outstanding and tradeable MBS lowering transaction costs and promoting resilience • ATOMS ™ Index smaller bid/ask spreads – participants execute trades at ”mid-market”. • ATOMS ™ Index real-time feed back of MBS returns allows the market to self correct following price dislocations

q q Become the “market price benchmark” Generate alpha for our clients via tighter bid/ask, higher liquidity, and greater transparency. Increase market efficiency in the “off-the-run” and specified pools. Entire mortgage market: Pass. Through & Structured Products markets at both the collateral and bond levels >$6 T We want to be here We are here now…

Data Products Trading Platform Broker Dealer Issuance Pass Through VOD AT UBXTM OM S TM Analytics P Advisory SD Brokerage F ET Trading Partnership

q Expand existing product set: q q q Expand Advisory Practice: q q q MSR valuation and retention advisory Predictive Data Analytics Trading Platform: q q Risk Scoring: Prepayment and Credit Prepayment and Interest Rate Model Foundation built on ATOMS technology MBS Index: ATOMS and TSP (Tradable Specified Pool) q Partner with Index Provider/ETF Manager

q q UBX Technology forms the foundation of our analytical power Patents help protect our comparative advantages Stable and pristine client base subscribing to Prepayment Analytic services Robust Modeling capabilities: Prepayment, Credit, Rates q q q R+D Scoring Technology q q q Room to expand into modeling sales like ADCO and AFT Natural extension into MSR and whole loan portfolio valuation analytics. Artificial intelligence approach to Risk Scoring/Predictive Analytics. Room to expand products into MSR retention, Pricing sales, Trading platform, and expand advisory services. Opportunities abound as much of the technology you saw is transferrable vertically in the mortgage industry or horizontally to other industries.

John C. Wang Founder and Chairman Fan Zhang Chief MBS Modeling Officer Chris Pei, Ph. D Strategic Science Advisor Bill Probasco Chief MBS Pricing Officer Calvin Miao Chief MBS Indexing Officer Jeremy Burdick, CFA Chief Analytics Officer Larry Thoman Chief Operating Officer Michelle Li Chief Product Officer Weimin Zhao, Ph. D Chief Technology Officer Raju Viswambharan Chief Engineering Officer

6284 San Ignacio Ave Ste A San Jose, CA 95119 -1366 415. 710. 8689 www. kdsglobal. com John Wang jcw@kdsglobal. com
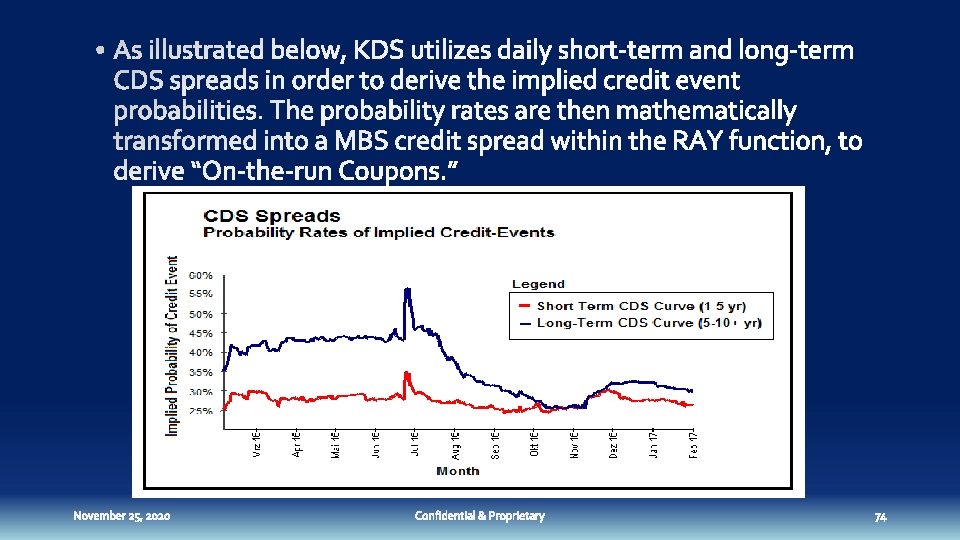
- Slides: 100