KCS Achievement Data Districtwide Achievement District Achievement Achievement


- Slides: 37
KCS Achievement Data
District-wide Achievement
District Achievement � Achievement subjects � Algebra II � English II � 6 -8 Math � 6 -8 ELA plots will be included for the following
h gl is En ts en ud w ith 40% hi te Algebra I W s ie bi lit is a n ic a er Am D e iv at ni c pa is er nd 2 T 1 /T la Is H fic ci Pa N or ith w 54. 6% St ia n ai aw rs 60% H ed ag k ac Bl nt va ad is D ne Le ar ic al ly ge ng ua La om on Ec ia n 100% As ts de n l. S tu Al % Proficient or Advanced District Achievement: Algebra I KCS 2013 -2014 District Achievement Data only shown if N>=30 90. 3% 80% 68. 6% 73. 3% 62. 8% 48. 8% 54. 7% 28. 0% 33. 9% 20% 0%
h gl is ts en ud St w ith 29. 7% hi te Algebra II W s ie bi lit is a ic an er Am D e iv at ni c pa is 2 er nd /T T 1 la Is H fic ci Pa ith w 31. 5% N or s er ed k ac ag nt va ad is D rn Le a ia n ai aw H ge ng ua La ic al ly Bl 40% En om on Ec ia n As ts de n l. S tu Al % Proficient or Advanced District Achievement: Algebra II KCS 2013 -2014 District Achievement Data only shown if N>=30 100% 87. 4% 80% 59. 7% 64. 4% 60% 42. 0% 48. 6% 30. 3% 20% 0%
h gl is ts en ud w ith 26. 7% hi te English I W s ie bi lit is a ic an er Am D e iv at ni c pa is 2 er nd /T T 1 la Is H fic ci Pa N or ith w ed 60. 9% St ia n ai aw s er rn Le a ag nt va ad is D k ac 56. 2% H ge ng ua La ic al ly Bl 60% En om on Ec ia n 80% As ts de n l. S tu Al % Proficient or Advanced District Achievement: English I KCS 2013 -2014 District Achievement Data only shown if N>=30 100% 84. 0% 75. 1% 79. 7% 62. 4% 40% 27. 7% 20% 0%
h gl is En ts en ud w ith hi te English II W s ie bi lit is a ic an er Am D e iv at ni c pa is 2 er nd la Is H fic ci Pa /T T 1 20% N or ith w 54. 5% St ia n ai aw s 60% H er ed ag k ac Bl nt va ad is D rn Le a ic al ly ge ng ua La om on Ec ia n 80% As ts de n l. S tu Al % Proficient or Advanced District Achievement: English II KCS 2013 -2014 District Achievement Data only shown if N>=30 100% 89. 7% 70. 3% 75. 4% 47. 3% 53. 6% 40% 26. 2% 17. 1% 0%
h gl is En ts w ith 24. 1% hi te Grade 6 -8 Math W s ie bi lit is a D ic an 33. 0% en er Am 39. 3% ud e iv at ni c pa is 2 er nd la Is H fic ci Pa /T T 1 25. 1% N or ith w 80% St ia n ai aw s 40% H er ed ag k ac Bl nt va ad is D rn Le a ic al ly ge ng ua La om on Ec ia n As ts de n l. S tu Al % Proficient or Advanced District Achievement: Grades 6 -8 Math KCS 2013 -2014 District Achievement Data only shown if N>=30 100% 83. 7% 75. 0% 60% 49. 0% 54. 4% 35. 6% 22. 4% 20% 0%
h gl is ts en ud St w ith 30. 0% hi te Grade 6 -8 RLA W s ie an er ic bi lit is a Am 57. 4% D iv e 40. 7% at ni c pa is H er nd la Is 2 20% fic ci Pa /T T 1 80% N or ith w d ta ge an ad v s er is D rn Le a ia n ai aw H ge ng ua La k ac Bl 40% En ic al ly om on Ec ia n 60% As ts de n l. S tu Al % Proficient or Advanced District Achievement: Grades 6 -8 ELA KCS 2013 -2014 District Achievement Data only shown if N>=30 100% 85. 8% 76. 9% 58. 5% 63. 6% 40. 1% 25. 8% 11. 8% 0%
District-wide Achievement Gaps
Subgroup Gap Data: 2013 -14 Areas 3 -8 Aggregate Math 3 -8 Aggregate RLA HS Algebra I/II (Combined) HS English II/III (Combined) ELL vs. non-ELL 24. 7% 38. 2% KCS Gap Actual 2013 -2014 (difference in %P/A) SWD vs. ED vs. BHN vs. All non-SWD non-ED Students 35. 1% 33. 7% 21. 1% 35. 1% 34. 0% 22. 8% 38. 9% 31. 1% 26. 1% 17. 5% 59. 6% 43. 8% 29. 2% 21. 0% Green indicates that the performance gap decreased from the previous year Red indicates that the performance gap widened from the previous year
D r. ul Pa L. Black Hispanic White h h ig H t. H es W le oy D h- ig Sc l ho o ol ho Sc l y m ad e Sc ho o Ac ol ho Sc y m ad e 2013 -2014: Algebra I & II ut el l. H w EM ST ig h H Ac oo l Sc h ol ho Sc m y oo l Sc h % P/A % of Students Proficient or Advanced So N Po L rn s y h ig H ig h H lle Va Ka n di ar H al ls H ib bs G n lto ig h ol ho Sc oo l Sc h er Ac ad e t. H rra gu Fu l. H te un Vo l Fa y lle Ke en tra C h ig h r. H te ar C ig H ne t ag h/ M ig H de n st Ea ar tin Be Au s Algebra I&II Subgroup Performance by Ethnicity: High Schools Data only shown if N>=30 100% 80% 60% 40% 20% 0%
D r. Economically Disadvantaged Non-Economically Disadvantaged h h ig H t. H es W le oy D h- ig Sc l ho o ol ho Sc l y m ad e Sc ho o Ac ol ho Sc y ad em 2013 -2014: Algebra I & II ut el l. H w EM ST ig h H Ac oo l Sc h ol ho Sc % P/A % of Students Proficient or Advanced So N Po L rn s y ig h H H ig h ol ho Sc y m oo l Sc h ol ho Sc l Sc ho o ca de ig h H lle Va Ka n di ar H al ls H ib bs G n lto Fu t. H rra gu ig h r. A ee nt lu Vo l. H en tra C Fa le y el . K ul L Pa h ig h r. H te ar C ig H ne t ag h/ M ig H de n st Ea ar tin Be Au s Algebra I&II Subgroup Performance by Socio. Economic Status: High Schools Data only shown if N>=30 100% 80% 60% 40% 20% 0%
D r. English Language Learners with T 1/T 2 Non-English Language Learners/T 1 or T 2 h h ig H t. H es W le oy D h- ig Sc l ho o ol ho Sc l y m ad e Sc ho o Ac ol ho Sc y ad em 2013 -2014: Algebra I & II ut el l. H w EM ST ig h H Ac oo l Sc h ol ho Sc % P/A % of Students Proficient or Advanced So N Po L rn s y ig h H H ig h ol ho Sc y m oo l Sc h ol ho Sc l Sc ho o ca de ig h H lle Va Ka n di ar H al ls H ib bs G n lto Fu t. H rra gu ig h r. A ee nt lu Vo l. H en tra C Fa le y el . K ul L Pa h ig h r. H te ar C ig H ne t ag h/ M ig H de n st Ea ar tin Be Au s Algebra I&II Subgroup Performance by Language: High Schools Data only shown if N>=10 100% 80% 60% 40% 20% 0%
D r. Students with Disabilities Non-Students with Disabilities h h ig H t. H es W le oy D h- ig Sc l ho o ol ho Sc l y m ad e Sc ho o Ac ol ho Sc y ad em 2013 -2014: Algebra I & II ut el l. H w EM ST ig h H Ac oo l Sc h ol ho Sc % P/A % of Students Proficient or Advanced So N Po L rn s y ig h H H ig h ol ho Sc y m oo l Sc h ol ho Sc l Sc ho o ca de ig h H lle Va Ka n di ar H al ls H ib bs G n lto Fu t. H rra gu ig h r. A ee nt lu Vo l. H en tra C Fa le y el . K ul L Pa h ig h r. H te ar C ig H ne t ag h/ M ig H de n st Ea ar tin Be Au s Algebra I&II Subgroup Performance by Disabilities: High Schools Data only shown if N>=30 100% 80% 60% 40% 20% 0%
D r. ul Pa L. Black Hispanic White h h ig H t. H es W le oy D h- ig Sc l ho o ol ho Sc oo l y m ad e Sc h Ac ol ho Sc y m ad e 2013 -2014: English I & II ut el l. H w EM ST ig h H Ac oo l Sc h ol ho Sc m y oo l Sc h % P/A % of Students Proficient or Advanced So N Po L rn s y h ig ig h H H ig h H lle Va Ka n di ar H al ls H ib bs G n lto ig h ol ho Sc l Sc ho o er Ac ad e t. H rra gu Fu l. H te un Vo l Fa y lle Ke en tra C h ig h r. H te ar C ig H ne t ag h/ M ig H de n st Ea ar tin Be Au s English I&II Subgroup Performance by Ethnicity: High Schools Data only shown if N>=30 100% 80% 60% 40% 20% 0%
D r. Economically Disadvantaged Non-Economically Disadvantaged h h ig H t. H es W le oy D h- ig Sc l ho o ol ho Sc l y m ad e Sc ho o Ac ol ho Sc y ad em 2013 -2014: English I & II ut el l. H w EM ST ig h H Ac oo l Sc h ol ho Sc % P/A % of Students Proficient or Advanced So N Po L rn s y ig h H H ig h ol ho Sc y m oo l Sc h ol ho Sc l Sc ho o ca de ig h H lle Va Ka n di ar H al ls H ib bs G n lto Fu t. H rra gu ig h r. A ee nt lu Vo l. H en tra C Fa le y el . K ul L Pa h ig h r. H te ar C ig H ne t ag h/ M ig H de n st Ea ar tin Be Au s English I&II Subgroup Performance by Socio. Economic Status: High Schools Data only shown if N>=30 100% 80% 60% 40% 20% 0%
D r. English Language Learners with T 1/T 2 Non-English Language Learners/T 1 or T 2 h h ig H t. H es W le oy D h- ig Sc l ho o ol ho Sc l y m ad e Sc ho o Ac ol ho Sc y ad em 2013 -2014: English I & II ut el l. H w EM ST ig h H Ac oo l Sc h ol ho Sc % P/A % of Students Proficient or Advanced So N Po L rn s y ig h H H ig h ol ho Sc y m oo l Sc h ol ho Sc l Sc ho o ca de ig h H lle Va Ka n di ar H al ls H ib bs G n lto Fu t. H rra gu ig h r. A ee nt lu Vo l. H en tra C Fa le y el . K ul L Pa h ig h r. H te ar C ig H ne t ag h/ M ig H de n st Ea ar tin Be Au s English I&II Subgroup Performance by Language: High Schools Data only shown if N>=10 100% 80% 60% 40% 20% 0%
D r. Students with Disabilities Non-Students with Disabilities h h ig H t. H es W le oy D h- ig Sc l ho o ol ho Sc l y m ad e Sc ho o Ac ol ho Sc y ad em 2013 -2014: English I & II ut el l. H w EM ST ig h H Ac oo l Sc h ol ho Sc % P/A % of Students Proficient or Advanced So N Po L rn s y ig h H H ig h ol ho Sc y m oo l Sc h ol ho Sc l Sc ho o ca de ig h H lle Va Ka n di ar H al ls H ib bs G n lto Fu t. H rra gu ig h r. A ee nt lu Vo l. H en tra C Fa le y el . K ul L Pa h ig h r. H te ar C ig H ne t ag h/ M ig H de n st Ea ar tin Be Au s English I&II Subgroup Performance by Disabilities: High Schools Data only shown if N>=30 100% 80% 60% 40% 20% 0%
W ttl e hi le id d ho ol l ho o Sc Sc ol 2013 -2014: Grade 6 -8 Math & Algebra I M dl e id M ho Sc ol ho Sc oo l Sc h ol ho Sc ol ho o Sc Sc ol ho Sc % P/A % of Students Proficient or Advanced gs rin Sp y al le ne t ag e id dl M le /M id d t. V M es W ne Vi le dl e id M e id dl M dl e id M le dl e id M el l. M es t oy D h- ut White So Hispanic w w Po Black th or N on rn s Ka st ol H al ls H am sh G re id d le id dl le id d M t. M rra gu Fa lu ff ar B ed C M r. M te ar C en rd Be a Math Subgroup Performance by Ethnicity: Middle Schools Data only shown if N>=30 100% 80% 60% 40% 20% 0%
W ttl e hi le id d ho ol l ho o Sc Sc ol 2013 -2014: Grade 6 -8 Math & Algebra I M dl e id M ho Sc ol ho Sc ol ho Sc oo l Sc h ol ho Sc % P/A % of Students Proficient or Advanced gs rin Sp y al le ne t ag e id dl M le /M id d t. V M es W ne Vi le dl e id M e id dl M dl e id M le dl e id M el l. M es t oy D h- ut White So Hispanic w w Po Black th or N on rn s Ka st ol H al ls H am sh G re id d le id dl le id d M t. M rra gu Fa lu ff ar B ed C M r. M te ar C en rd Be a Math Subgroup Performance by Socio-Economic Status: Middle Schools Data only shown if N>=30 100% 80% 60% 40% 20% 0%
English Language Learners with T 1/T 2 Non-English Language Learners/T 1 or T 2 ttl e hi W le id d ho ol Sc ol ho Sc ol 2013 -2014: Grade 6 -8 Math & Algebra M dl e id M ho Sc ho ol Sc ol ho Sc oo l Sc h ol ho Sc ol ho Sc oo l Sc h ol ho Sc % P/A % of Students Proficient or Advanced gs rin Sp y al le ne t ag e dl e id id dl M le /M id d t. V M es W ne Vi le oy D h- ut So dl e id M e id dl M dl e le id d id M M le dl e id M el l. M es t w Po w th or N on rn s Ka st ol H al ls H am sh G re e le id d M t. M rra gu Fa lu ff ar B ed C id dl dl e id M r. M te ar C en rd Be a Math Subgroup Performance by Language: Middle Schools Data only shown if N>=10 100% 80% 60% 40% 20% 0%
Students with Disabilities Non-Students with Disabilities ttl e hi W le id d ho ol Sc ol ho Sc ol 2013 -2014: Grade 6 -8 Math & Algebra M dl e id M ho Sc ho ol Sc ol ho Sc oo l Sc h ol ho Sc ol ho Sc oo l Sc h ol ho Sc % P/A % of Students Proficient or Advanced gs rin Sp y al le ne t ag e dl e id id dl M le /M id d t. V M es W ne Vi le oy D h- ut So dl e id M e id dl M dl e le id d id M M le dl e id M el l. M es t w Po w th or N on rn s Ka st ol H al ls H am sh G re e le id d M t. M rra gu Fa lu ff ar B ed C id dl dl e id M r. M te ar C en rd Be a Math Subgroup Performance by Disabilities: Middle Schools Data only shown if N>=30 100% 80% 60% 40% 20% 0%
W e ttl hi le id d ho ol l ho o Sc Sc ol 2013 -2014: Grade 6 -8 RLA M dl e id M ho Sc ol ho Sc ol ho Sc oo l Sc h ol ho Sc % P/A % of Students Proficient or Advanced gs rin Sp y al le ne t ag e id dl M le /M id d t. V M es W ne Vi le dl e id M e id dl M dl e id M le dl e id M el l. M es t oy D h- ut White So Hispanic w w Po Black th or N on rn s Ka st ol H al ls H am sh G re id d le id dl le id d M t. M rra gu Fa lu ff ar B ed C M r. M te ar C en rd Be a ELA Subgroup Performance by Ethnicity: Middle Schools Data only shown if N>=30 100% 80% 60% 40% 20% 0%
Economically Disadvantaged Non-Economically Disadvantaged ttl e hi W le id d ho ol l ho o Sc Sc ol 2013 -2014: Grade 6 -8 RLA M dl e id M ho Sc ho ol Sc ol ho Sc oo l Sc h ol ho Sc ol ho Sc oo l Sc h ol ho Sc % P/A % of Students Proficient or Advanced gs rin Sp y al le ne t ag e dl e id id dl M le /M id d t. V M es W ne Vi le oy D h- ut So dl e id M e id dl M dl e le id d id M M le dl e id M el l. M es t w Po w th or N on rn s Ka st ol H al ls H am sh G re e le id d M t. M rra gu Fa lu ff ar B ed C id dl dl e id M r. M te ar C en rd Be a ELA Subgroup Performance by Socio-Economic Status: Middle Schools Data only shown if N>=30 100% 80% 60% 40% 20% 0%
English Language Learners with T 1/T 2 Non-English Language Learners/T 1 or T 2 ttl e hi W le id d ho ol l ho o Sc Sc ol 2013 -2014: Grade 6 -8 RLA M dl e id M ho Sc ho ol Sc ol ho Sc oo l Sc h ol ho Sc ol ho Sc oo l Sc h ol ho Sc % P/A % of Students Proficient or Advanced gs rin Sp y al le ne t ag e dl e id id dl M le /M id d t. V M es W ne Vi le oy D h- ut So dl e id M e id dl M dl e le id d id M M le dl e id M el l. M es t w Po w th or N on rn s Ka st ol H al ls H am sh G re e le id d M t. M rra gu Fa lu ff ar B ed C id dl dl e id M r. M te ar C en rd Be a ELA Subgroup Performance by Language: Middle Schools Data only shown if N>=10 100% 80% 60% 40% 20% 0%
Students with Disabilities Non-Students with Disabilities ttl e hi W le id d ho ol Sc ol ho Sc ol 2013 -2014: Grade 6 -8 RLA M dl e id M ho Sc ho ol Sc ol ho Sc oo l Sc h ol ho Sc ol ho Sc oo l Sc h ol ho Sc % P/A % of Students Proficient or Advanced gs rin Sp y al le ne t ag e dl e id id dl M le /M id d t. V M es W ne Vi le oy D h- ut So dl e id M e id dl M dl e le id d id M M le dl e id M el l. M es t w Po w th or N on rn s Ka st ol H al ls H am sh G re e le id d M t. M rra gu Fa lu ff ar B ed C id dl dl e id M r. M te ar C en rd Be a ELA Subgroup Performance by Disabilities: Middle Schools Data only shown if N>=30 100% 80% 60% 40% 20% 0%
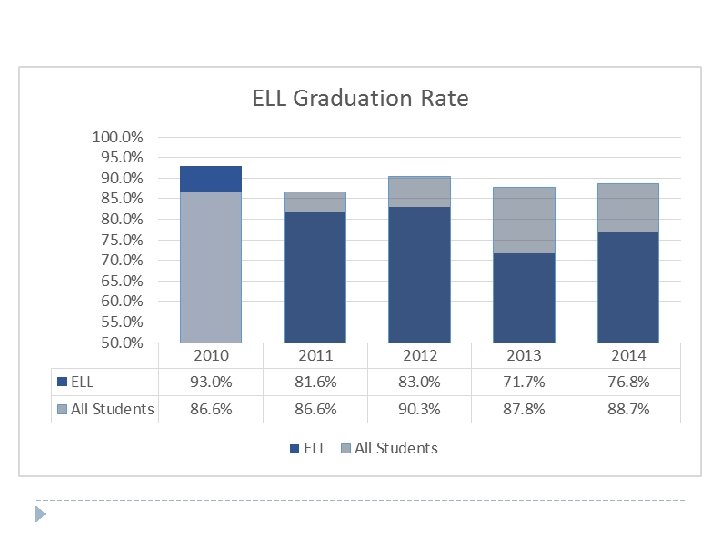
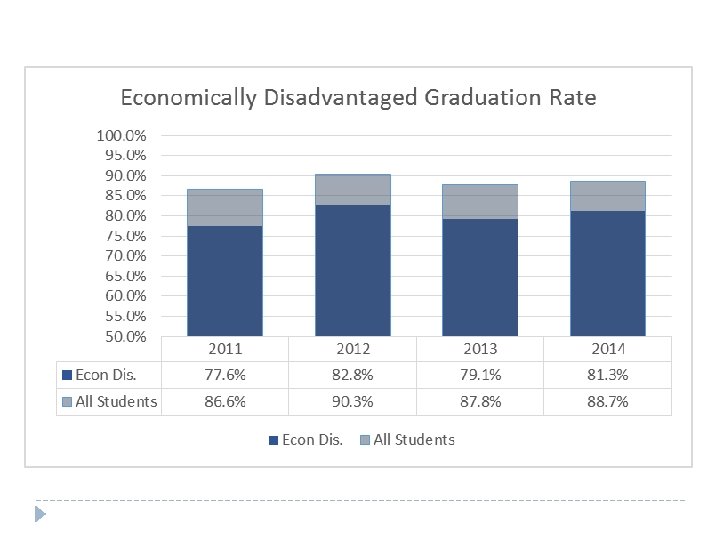
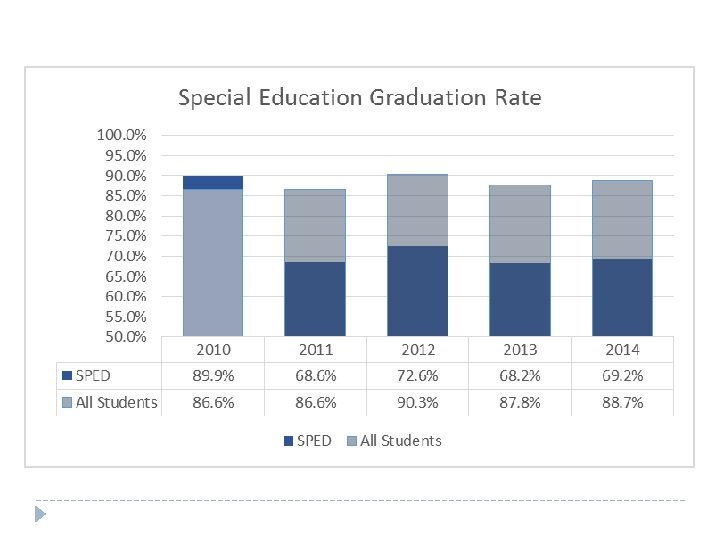
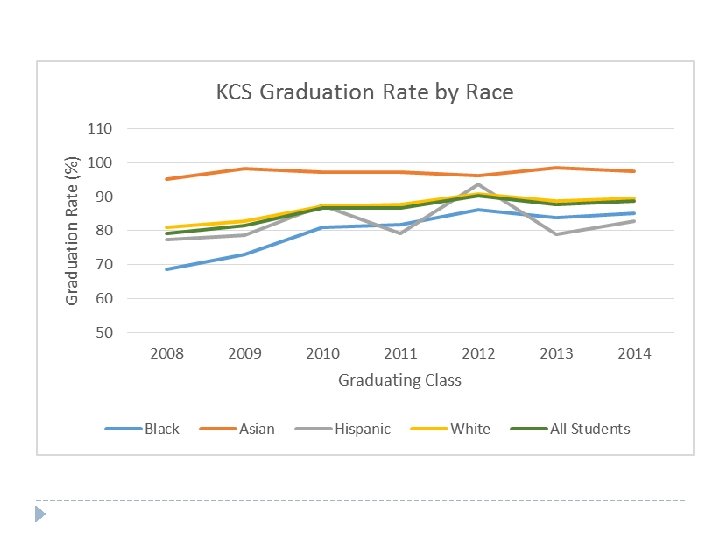
Graduation Rates
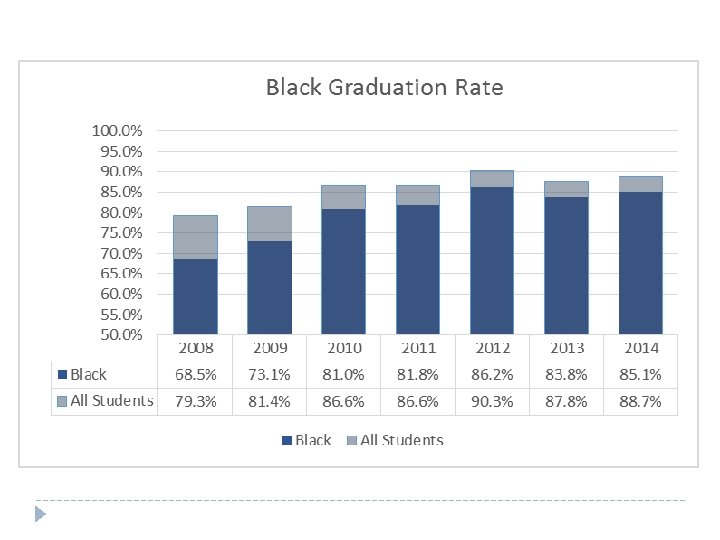
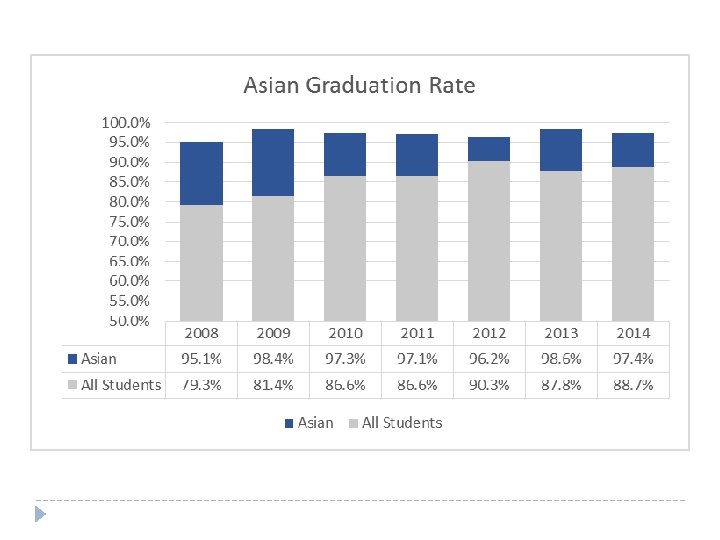
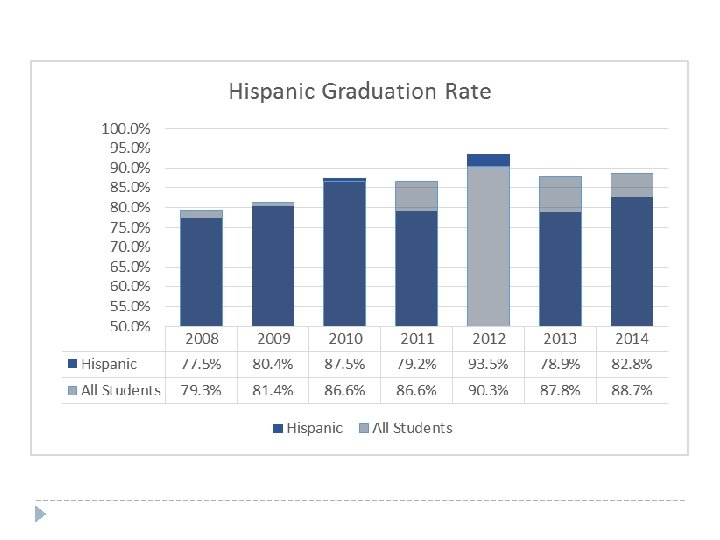
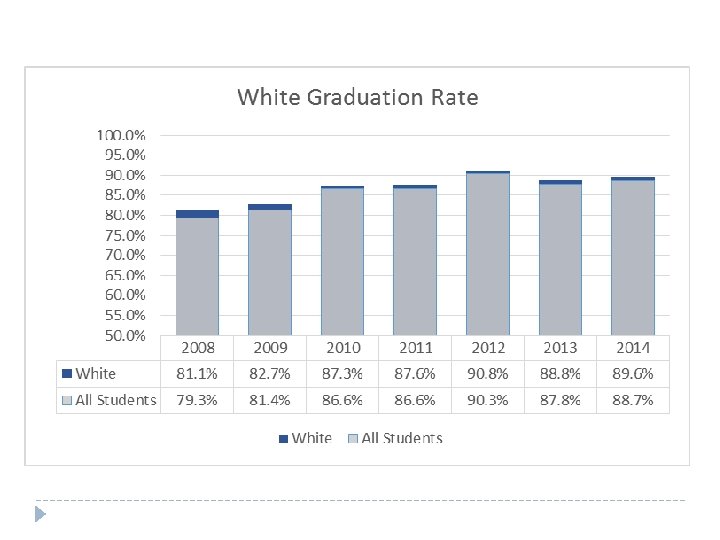
Knox County Graduation Rates 100% 95% 90. 3% 90% 85% 80% 86. 6% Class of 2010 Class of 2011 87. 8% 88. 7% 81. 4% 79. 3% 75% 70% 65% 60% 55% 50% Class of 2008 Class of 2009 Class of 2012 Class of 2013 Class of 2014