
Katla Seafood Namibia September 9 2020 Horse Mackerel
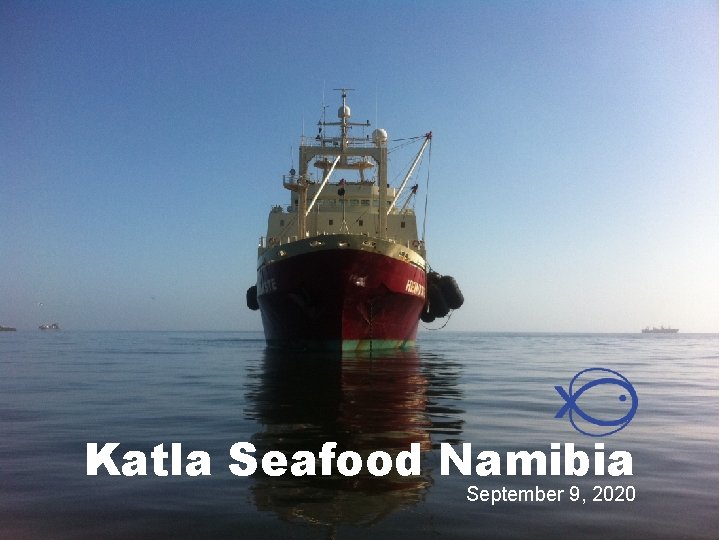
Katla Seafood Namibia September 9, 2020
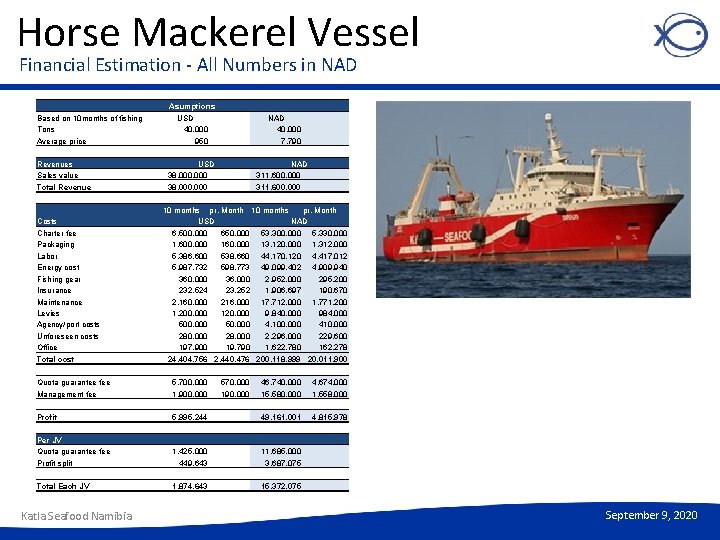
Horse Mackerel Vessel Financial Estimation - All Numbers in NAD Based on 10 months of fishing Tons Average price Asumptions USD 40. 000 950 Revenues Sales value USD 38. 000 NAD 311. 600. 000 Total Revenue 38. 000 311. 600. 000 Costs Charter fee Packaging Labor Energy cost Fishing gear Insurance Maintenance Levies Agency/port costs Unforeseen costs Office 24. 404. 756 2. 440. 476 200. 118. 999 20. 011. 900 Quota guarantee fee Management fee 5. 700. 000 1. 900. 000 Profit 5. 995. 244 Total Each JV Katla Seafood Namibia NAD 40. 000 7. 790 10 months pr. Month USD NAD 6. 500. 000 650. 000 53. 300. 000 5. 330. 000 1. 600. 000 160. 000 13. 120. 000 1. 312. 000 5. 386. 600 538. 660 44. 170. 120 4. 417. 012 5. 987. 732 598. 773 49. 099. 402 4. 909. 940 360. 000 36. 000 2. 952. 000 295. 200 232. 524 23. 252 1. 906. 697 190. 670 2. 160. 000 216. 000 17. 712. 000 1. 771. 200. 000 120. 000 9. 840. 000 984. 000 500. 000 50. 000 4. 100. 000 410. 000 28. 000 2. 296. 000 229. 600 197. 900 19. 790 1. 622. 780 162. 278 Total cost Per JV Quota guarantee fee Profit split 1. 425. 000 449. 643 1. 874. 643 570. 000 190. 000 46. 740. 000 15. 580. 000 4. 674. 000 1. 558. 000 49. 161. 001 4. 815. 978 11. 685. 000 3. 687. 075 15. 372. 075 September 9, 2020
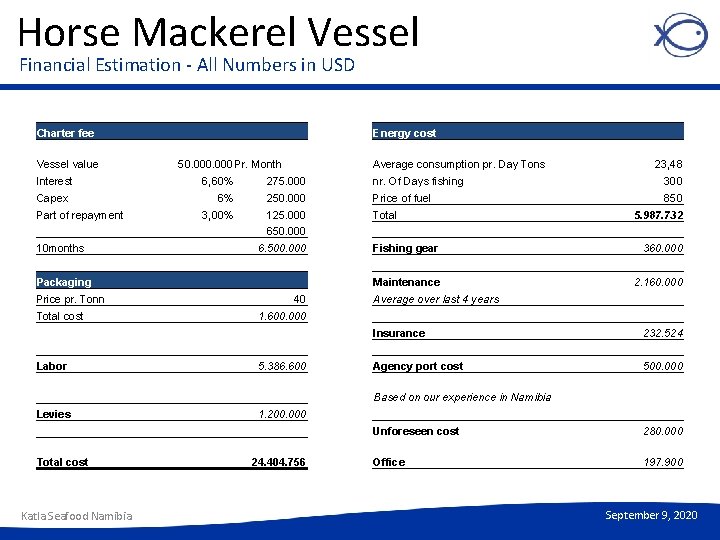
Horse Mackerel Vessel Financial Estimation - All Numbers in USD Charter fee Vessel value Energy cost 50. 000 Pr. Month Interest Capex Part of repayment Average consumption pr. Day Tons 23, 48 6, 60% 275. 000 nr. Of Days fishing 300 6% 250. 000 Price of fuel 850 3, 00% 125. 000 Total 5. 987. 732 650. 000 10 months Packaging Price pr. Tonn Total cost Labor 6. 500. 000 40 1. 600. 000 5. 386. 600 Fishing gear 360. 000 Maintenance 2. 160. 000 Average over last 4 years Insurance 232. 524 Agency port cost 500. 000 Based on our experience in Namibia Levies Total cost Katla Seafood Namibia 1. 200. 000 24. 404. 756 Unforeseen cost 280. 000 Office 197. 900 September 9, 2020
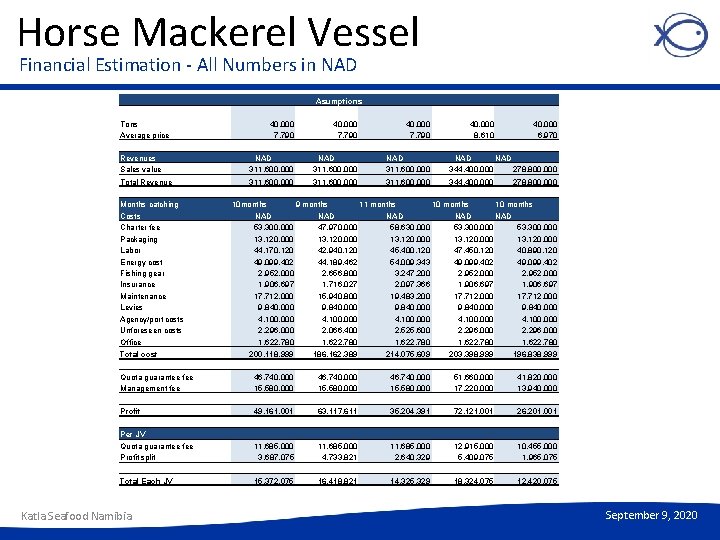
Horse Mackerel Vessel Financial Estimation - All Numbers in NAD Tons Average price 40. 000 7. 790 Asumptions 40. 000 7. 790 40. 000 8. 610 40. 000 6. 970 Revenues Sales value NAD 311. 600. 000 NAD 344. 400. 000 278. 800. 000 Total Revenue 311. 600. 000 344. 400. 000 Months catching Costs Charter fee Packaging Labor Energy cost Fishing gear Insurance Maintenance Levies Agency/port costs Unforeseen costs Office 278. 800. 000 10 months 9 months 11 months 10 months NAD NAD NAD 53. 300. 000 47. 970. 000 58. 630. 000 53. 300. 000 13. 120. 000 44. 170. 120 42. 940. 120 45. 400. 120 47. 450. 120 40. 890. 120 49. 099. 402 44. 189. 462 54. 009. 343 49. 099. 402 2. 952. 000 2. 656. 800 3. 247. 200 2. 952. 000 1. 906. 697 1. 716. 027 2. 097. 366 1. 906. 697 17. 712. 000 15. 940. 800 19. 483. 200 17. 712. 000 9. 840. 000 4. 100. 000 2. 296. 000 2. 066. 400 2. 525. 600 2. 296. 000 1. 622. 780 Total cost 200. 118. 999 186. 162. 389 214. 075. 609 203. 398. 999 196. 838. 999 Quota guarantee fee Management fee 46. 740. 000 15. 580. 000 51. 660. 000 17. 220. 000 41. 820. 000 13. 940. 000 Profit 49. 161. 001 63. 117. 611 35. 204. 391 72. 121. 001 26. 201. 001 Per JV Quota guarantee fee Profit split Total Each JV Katla Seafood Namibia 11. 685. 000 3. 687. 075 11. 685. 000 4. 733. 821 11. 685. 000 2. 640. 329 12. 915. 000 5. 409. 075 10. 455. 000 1. 965. 075 15. 372. 075 16. 418. 821 14. 325. 329 18. 324. 075 12. 420. 075 September 9, 2020
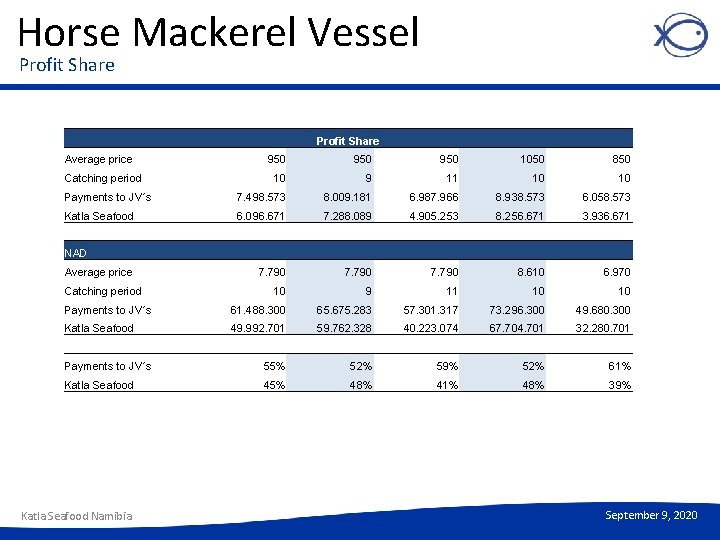
Horse Mackerel Vessel Profit Share Average price 950 950 1050 850 10 9 11 10 10 Payments to JV´s 7. 498. 573 8. 009. 181 6. 987. 966 8. 938. 573 6. 058. 573 Katla Seafood 6. 096. 671 7. 288. 089 4. 905. 253 8. 256. 671 3. 936. 671 Catching period NAD Average price 7. 790 8. 610 6. 970 10 9 11 10 10 Payments to JV´s 61. 488. 300 65. 675. 283 57. 301. 317 73. 296. 300 49. 680. 300 Katla Seafood 49. 992. 701 59. 762. 328 40. 223. 074 67. 704. 701 32. 280. 701 Payments to JV´s 55% 52% 59% 52% 61% Katla Seafood 45% 48% 41% 48% 39% Catching period Katla Seafood Namibia September 9, 2020
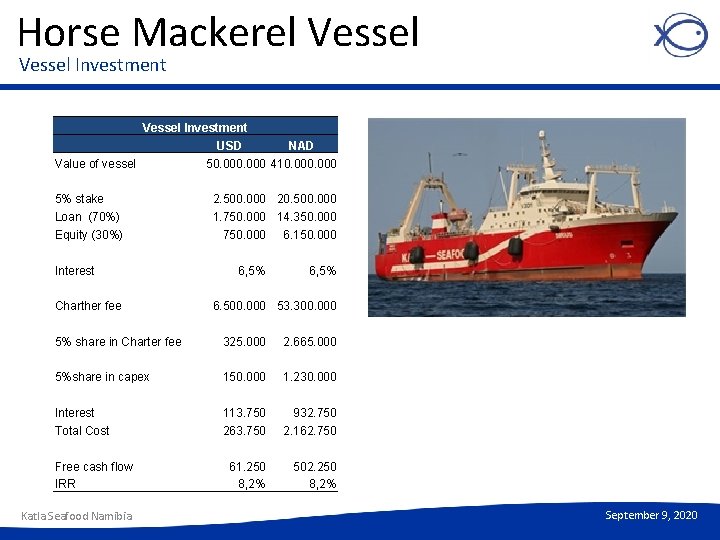
Horse Mackerel Vessel Investment USD NAD Value of vessel 50. 000 410. 000 5% stake Loan (70%) Equity (30%) Interest Charther fee 2. 500. 000 20. 500. 000 1. 750. 000 14. 350. 000 750. 000 6. 150. 000 6, 5% 6. 500. 000 53. 300. 000 5% share in Charter fee 325. 000 2. 665. 000 5%share in capex 150. 000 1. 230. 000 Interest Total Cost 113. 750 263. 750 932. 750 2. 162. 750 61. 250 8, 2% 502. 250 8, 2% Free cash flow IRR Katla Seafood Namibia September 9, 2020
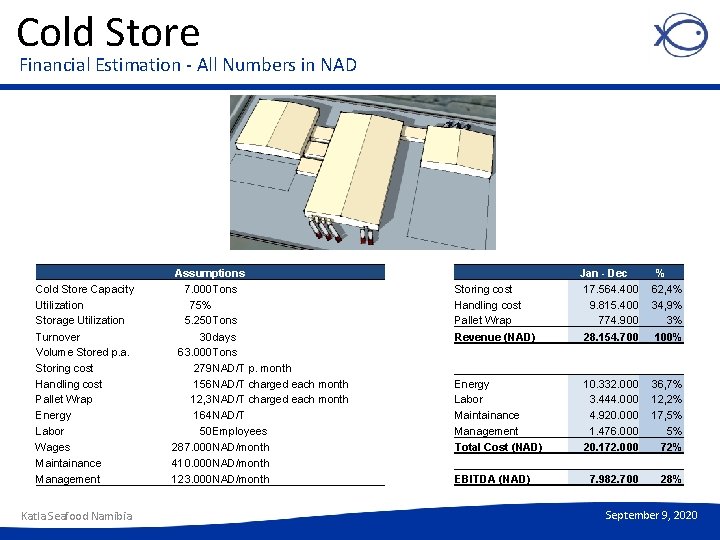
Cold Store Financial Estimation - All Numbers in NAD Cold Store Capacity Utilization Storage Utilization Turnover Volume Stored p. a. Storing cost Handling cost Pallet Wrap Energy Labor Wages Maintainance Management Katla Seafood Namibia Assumptions 7. 000 Tons 75% 5. 250 Tons 30 days 63. 000 Tons 279 NAD/T p. month 156 NAD/T charged each month 12, 3 NAD/T charged each month 164 NAD/T 50 Employees 287. 000 NAD/month 410. 000 NAD/month 123. 000 NAD/month Storing cost Handling cost Pallet Wrap Revenue (NAD) Energy Labor Maintainance Management Total Cost (NAD) EBITDA (NAD) Jan - Dec 17. 564. 400 9. 815. 400 774. 900 28. 154. 700 % 62, 4% 34, 9% 3% 100% 10. 332. 000 3. 444. 000 4. 920. 000 1. 476. 000 20. 172. 000 36, 7% 12, 2% 17, 5% 5% 72% 7. 982. 700 28% September 9, 2020
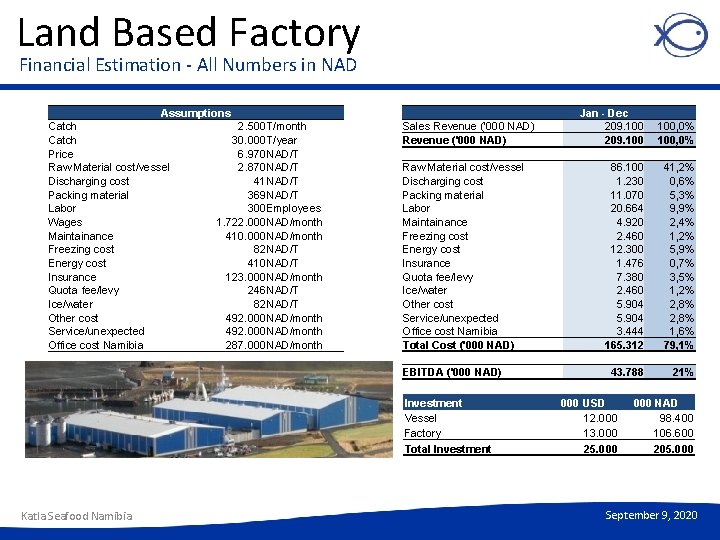
Land Based Factory Financial Estimation - All Numbers in NAD Assumptions Catch 2. 500 T/month Catch 30. 000 T/year Price 6. 970 NAD/T Raw Material cost/vessel 2. 870 NAD/T Discharging cost 41 NAD/T Packing material 369 NAD/T Labor 300 Employees Wages 1. 722. 000 NAD/month Maintainance 410. 000 NAD/month Freezing cost 82 NAD/T Energy cost 410 NAD/T Insurance 123. 000 NAD/month Quota fee/levy 246 NAD/T Ice/water 82 NAD/T Other cost 492. 000 NAD/month Service/unexpected 492. 000 NAD/month Office cost Namibia 287. 000 NAD/month Sales Revenue ('000 NAD) Raw Material cost/vessel Discharging cost Packing material Labor Maintainance Freezing cost Energy cost Insurance Quota fee/levy Ice/water Other cost Service/unexpected Office cost Namibia Total Cost ('000 NAD) EBITDA ('000 NAD) Investment Vessel Factory Total Investment Katla Seafood Namibia Jan - Dec 209. 100 100, 0% 86. 100 1. 230 11. 070 20. 664 4. 920 2. 460 12. 300 1. 476 7. 380 2. 460 5. 904 3. 444 165. 312 41, 2% 0, 6% 5, 3% 9, 9% 2, 4% 1, 2% 5, 9% 0, 7% 3, 5% 1, 2% 2, 8% 1, 6% 79, 1% 43. 788 21% 000 USD 12. 000 13. 000 25. 000 NAD 98. 400 106. 600 205. 000 September 9, 2020
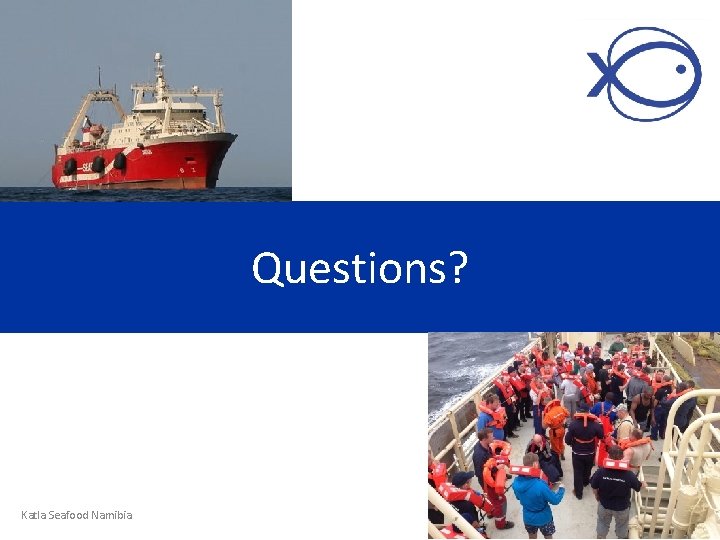
Questions? Katla Seafood Namibia
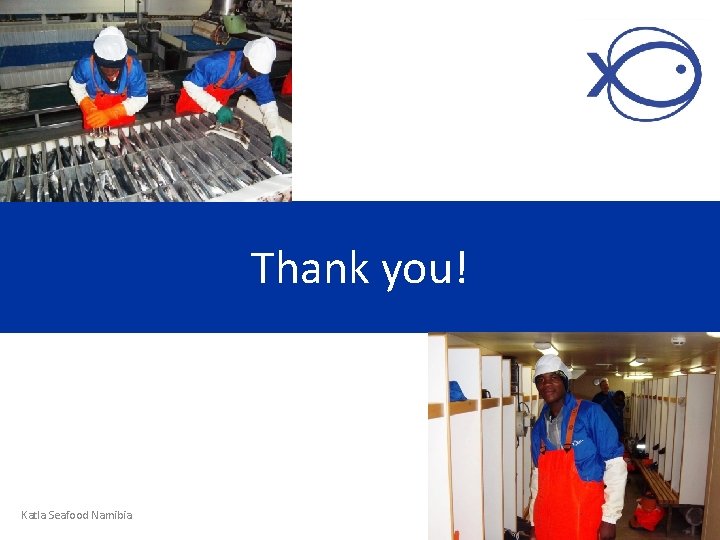
Thank you! Katla Seafood Namibia
- Slides: 10