Kahoot https play kahoot it quiz Ida 7


")


 n Years of life lost (YLL) due to")


 are a measure")


- Slides: 24
+ Kahoot ~ https: //play. kahoot. it/#/? quiz. Id=a 7 b 101 f 4 -b 886 -422 d-bd 64 -4 bcdf 152 e 3 c 5 https: //www. youtube. com/watch? v=A 3 nll. BT 9 ACg
+ The health status of Australian Youth
+ Health status refers to the level of health of an individual, group or population Severe Neutral Optimal health As already mentioned, health is a dynamic state — it is continually changing. Usually these changes in health status are fairly minor; for example, developing a cold may slightly affect physical, social and mental health for a short period of time.
+ Health status n How healthy are you? n Can you think of factors that affect your health? Are you in control of them? n For two of the factors listed in the previous question, outline in detail an example of how it has impacted on your health.
+ Why do we measure the health status of the population? n It allows judgments to be made about the health of individuals, groups or populations. With this information, government and non-government organisations can take action to improve health in specific areas. n It allows trends to be identified in health status over time. n Australia is one of the healthiest countries in the world and Australia’s youth (those aged 12– 18) are among the healthiest individuals in the country.
+ How do we measure health status? There a number of ways of measuring health status and these measures are collectively known as health indicators. Can you name any health indicators? * Mind mapping task
+ Health indicators n Life expectancy n Mortality n Years of life lost (YLL) n Morbidity n Incidence & Prevalence n Burden of Disease
+ Life Expectancy Life expectancy is one of the most common methods used to measure health status. It gives an indication of how long a person can expect to live if the current death rates stay the same. Birth Male Female 1901 -10 2009 -11 1901 -10 2009 - 11 55. 2 79. 7 58. 8 84. 2 What factors have increased our life expectancy? https: //www. youtube. com/watch? v=jbk. SRLYSojo
+ Can you explain the trend occurring?
+ Can you explain the trend occurring?
+ Your task n Research the current Life Expectancy of people living in 8 different countries. https: //www. worldlifeexpectancy. com/life-expectancy-europe n Write a short paragraph outlining some factors which may be contributing to these changes in life expectancy. Country n Male Life Expectancy www. worldlifeexpectancy. com Female Life Expectancy 2 x Factors influencing the countries Life Expectancy
+ Learning task n Page 41 questions 1 -8 ANSWER IN FULL SENTENCES
+ Mortality n The deaths in a population n Mortality rate is therefore an indication of how many deaths occurred in a population in a given period of time for a specific cause/all causes. n Refer to figure 2. 2 and figure 2. . 5 ~ Can you identify factors that are contributing to these trends?
+ Mortality diagram Australia vs a developing country
+ Years of life lost (YLL) n Years of life lost (YLL) due to premature death is another way of measuring and comparing mortality. n If a person dies from a given condition 30 years before the predicted life expectancy for their age, than they have contributed 30 YLLs to that particular cause of death. Complete questions 4 -8 on page 45 of the textbook
+ Morbidity n The rate at which a particular disease or illness occurs within a population. n There are two ways of considering morbidity - The number of people reporting a condition. Often represented as a percentage of a population, or the incidence and prevalence rates. - Years lost due to disability (YLD’s)
+ Incidence & Prevalence - Two measures used to present morbidity data n Incidence ~ The number or rate of new cases of a particular condition during a specific time. - Incidence data is useful for identifying which conditions are increasing in diagnosis and which ones are decreasing. n Prevalence ~ The number of cases of a condition at a given time
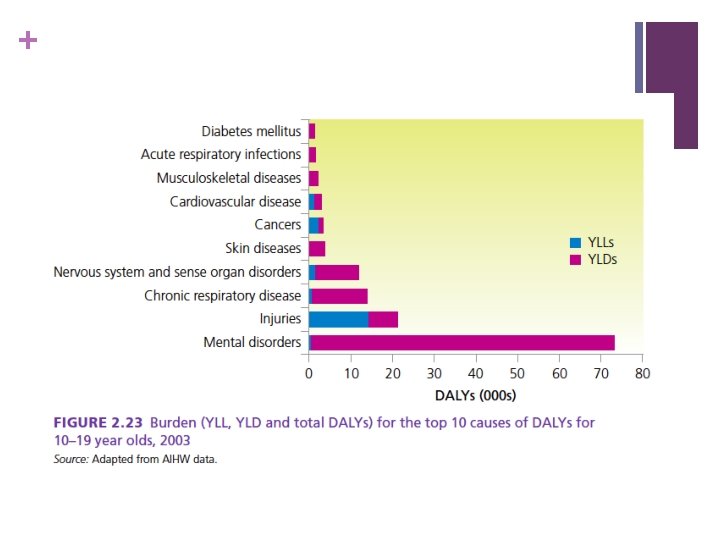
+ Burden of Disease n Is a measure that combines mortality data with morbidity data, specifically it measures the gap between current health status and an ideal situation where everyone lives to an old age free of disease and disability. n Burden of disease is measured in a unit called a DALY (Disability Adjusted Life Year). n DALY = YLL + YLD
+ Burden of Disease. DALYs n Disability adjusted life years (DALYs) are a measure of the years of healthy life lost due to premature death, illness or injury. n One DALY is a lost year of ‘healthy’ life. DALY= YLL + YLD Years of life lost due premature mortality. Years of healthy life lost due to disability
+ Reading data The following graph shows the proportion of youth rating their family’s ability to get along as excellent, very good, fair or poor. This graph is referring to family cohesion. 35% 30% 32, 1% 27, 1% 25% 20% 15% 12, 4% 10% 6, 5% 5% 0% Excellent Very good Fair Poor
0 1971 1972 1973 1974 1975 1976 1977 1978 1979 1980 1981 1982 1983 1984 1985 1986 1987 1988 1989 1990 1991 1992 1993 1994 1995 1996 1997 1998 1999 2000 2001 2002 2003 2004 2005 2006 2007 2008 Mortality rate per 100 000 + The following graph shows the mortality rate for those aged 5 -19 between 1970 and 2008: 180 160 140 120 100 80 60 40 20 Year
+ Proportion of those who are overweight or obese 29 28 27 Percent 26 25 24 23 22 21 8 -11 12 -15 16 -17 Age group Males Females
+ Learning task n For each health indicator you’re required to find a table/graph which outlines current Australian data (past 10 years). n For each graph you’re required to outline a trend.