Juvenile Detention Alternatives Initiative Detention Equity Reform San


 was conceived to address what had become a")
 $160, 000 $148, 767 $140, 000 $120, 000")


 4500 78% reduction")
")
 100 90 80 70")
 1006 1000")


- Slides: 24
Juvenile Detention Alternatives Initiative: Detention & Equity Reform San Francisco Juvenile Probation Commission October 12, 2016 1 © Richard Ross
AECF/Juvenile Justice Strategy Group –Moving Towards Results JJSG Result: Children in the youth justice system remain with their families in safe communities and successfully transition to adulthood
4 Why detention reform? 4 Core JDAI strategies 4 JDAI Results
The Juvenile Detention Alternatives Initiative (JDAI) was conceived to address what had become a national crisis in the early 1990 s Detention populations were climbing, with far too many youth in over-crowded facilities AVERAGE DAILY POP OF JUVENILES IN U. S. PUBLIC DETENTION CENTERS (1985 -1995) But, JDAI was also created as an entrypoint strategy for deeper system reform U. S. ADJUDICATION & PLACEMENT RATES: DETAINED YOUTH VS. NOT DETAINED YOUTH 25, 000 70% 20, 000 60% 15, 000 50% 10, 000 40% 30% 5, 000 20% 0 1985 1987 1989 1991 1993 1995 53% 47% 58% 39% 24% 21% 24% 18% 10% 0% PERCENTAGE OF JUVENILES IN OVERCROWDED U. S. PUBLIC DETENTION CENTERS (1985 -1995) 20% 1985 31% 1987 50% 42% 47% 60% 1992 2010 Detained: % Adjudicated that were placed Not Detained: % Adjudicated that were placed 1989 1991 1993 1995 Detained youth are more than twice as likely to be adjudicated and placed. Nationally, this has changed little over time
Sticker Shock: Estimated Yearly Cost (2011) $160, 000 $148, 767 $140, 000 $120, 000 $100, 000 $80, 000 $58, 607 $60, 000 $40, 000 $21, 535 $20, 000 Cost of 1 year at Harvard* $0 Confinement Cost of incarceration in California: $570. 79 – $208, 338 per year Sources: Justice Policy Institute “Sticker Shock” (2014) Harvard’s Website: https: //college. harvard. edu/financial-aid/how-aid-works/cost-attendance CBO Harvard
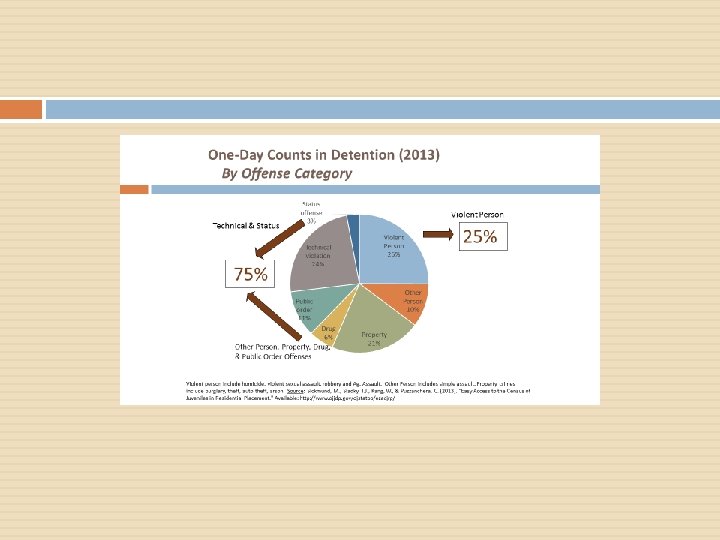
One-Day Counts in Detention Facilities, 2001 By Offense Category Property, Drugs, Public Order and “Other” (38. 6%) Status Offenses and Technical Violations (32. 3%) (29. 1%) Violent Offenses
Arrests for serious crimes do not explain detention use; local policies and practices are key Index arrests have declined by 50% … …but detention has only declined by 31% (with half the decrease occurring before 2000) (with half the decrease occurring after 2007) 89 89 83 78 78 75 2, 581 1, 926 1, 747 1, 619 61 1, 484 1, 525 1, 294 1997 1999 2001 2003 2006 2007 2010 INDEX ARRESTS PER 100 K YOUTH DETENTIONS PER 100 K YOUTH NOTE: Index arrests are classified as more serious crimes including murder, rape, robbery, aggravated assault, burglary, larceny, motor vehicle theft, and arson. Juvenile arrest figures based on annual count of arrests from the FBI’s Uniform Crime Report (UCR) system; detention figures based on a one-day count through the Census of Juveniles in Residential Placement (CJRP). SOURCES: Puzzanchera, C. , Adams, B. , and Kang, W. (2012), "Easy Access to FBI Arrest Statistics 1994 -2009 “ http: //www. ojjdp. gov/ojstatbb/ezaucr/ ; Sickmund, M. , Sladky, T. J. , Kang, W. , & Puzzanchera, C. (2011). "Easy Access to the Census of Juveniles in Residential Placement. “ http: //www. ojjdp. gov/ojstatbb/ezacjrp/ ; Federal Bureau of Investigation (2011). “Crime in the United States 2010”, table 36. http: //www. fbi. gov/about-us/cjis/ucr/crime-in-the-u. s/2010/crime-in-the-u. s. -2010/index-page ; Puzzanchera, C. , Sladky, A. and Kang, W. (2012). "Easy Access to Juvenile Populations: 1990 -2011. “ http: //www. ojjdp. gov/ojstatbb/ezapop/
Youth of color are an increasing share of the total detained population Youth of Color as a Percentage of Total U. S. Detained Population 71. 2% 68. 9% 69. 4% 2006 2007 64. 9% 62. 5% 62. 6% 62. 1% 1997 1999 2001 2003 2010 SOURCE: Sickmund, M. , Sladky, T. J. , Kang, W. , & Puzzanchera, C. (2011). "Easy Access to the Census of Juveniles in Residential Placement. “ http: //www. ojjdp. gov/ojstatbb/ezacjrp/
4 Why detention reform? 4 Core JDAI strategies 4 JDAI Results-racial & ethnic disparities
JDAI uses eight interconnected strategies to enable jurisdictions to safely reduce reliance on secure detention PURPOSE: To demonstrate that jurisdictions can establish more effective and efficient systems to accomplish the purposes of juvenile detention. OBJECTIVES: 1) Eliminate inappropriate or unnecessary use of secure detention 2) Minimize failures to appear and incidence of delinquent behavior 3) Redirect public finances to successful reform strategies 4) Improve conditions in secure detention facilities 5) Reduce racial and ethnic disparities CORE STRATEGIES: Collaboration Use of accurate data Objective admissions criteria and instruments Alternative to detention Case processing reforms Reducing the use of secure confinement for ‘special’ cases Deliberate commitment to reducing racial disparities Improving conditions of confinement
4 Why detention reform? 4 Core JDAI strategies 4 JDAI Results-Racial & Ethnic Disparities
Grand Total 3, 173 fewer youth are being held in secure detention on an average day as compared to the Mississippi Baltimore City, MD Montana New Mexico Orange County, CA New Hampshire Wyoming South Dakota Nebraska Florida Louisiana Ohio Hawaii Dallas, TX Iowa San Francisco, CA Harris County, TX Illinois Indiana -80% Bernalillo County, NM -60% Clark County, NV Ada County, ID Missouri Alabama Delaware Washoe County, NV Cent. East Oregon JJC Santa Cruz, CA New Jersey Massachusetts Ventura County, CA Cook County, IL Virginia Minnesota Washington Pima, AZ Clayton County, GA Multnomah, OR As of 2012, JDAI sites had reduced detention populations by 43% Change in Average Daily Population (ADP) by Grantee Baseline vs. 2012 N=38 grantees, comprising 112 sites (Grantees shown in ascending order by percentage change in ADP) 40% 20% 0% -20% -40% ADP − 43% -100%
JDAI sites as a group have led the nation in decreasing the use of detention – but like the rest of the JJ system, they struggle with persistent and large racial/ethnic disparities. RATES OF DETENTION IN JDAI SITES (Reported ADP per 100, 000 persons age 10 to 17) Pre-JDAI baseline 2014 reporting year 143 90 83 54 44 25 Total population White Non-Hispanic youth Youth of Color Down 40% Down 43% Down 42% 14
Santa Cruz County, CA Turning Challenges Into Results ALOS – DISPOSITION TO 24 HOUR PLACEMENT 1996 27 Days 2015 23 Days -15% LATINO YOUTH AVERAGE DAILY POPULATION 1996 33 ADP 2015 16. 6 ADP -50%
Ventura Co, CA: Average Daily Population ADP 2010 -2015 100 90 80 70 60 50 40 30 20 10 0 2011 2012 White 2013 African/Am 2014 Latino 2015 Total
Pierce Co, WA: Average Daily Population 2000 Current 180 ADP Overall 160 163 ADP African American ADP Caucasian 161 150 140 66% Reduction in 147 felony petitions filed from 2000 – 2015 77% Reduction in Introduction of JDAI 120 state commitments from 2007 -2015 108 100 80 83 79 DMC Reduction Agenda 77 68 60 49 40 46 36 31 31 31 2012 2013 2014 20 26 0 2001 2002 2003 2004 2005 2006 2007 2008 2009 2010 2011 2015
Hawai`i: Impact on Youth of Color Admissions-Youth of Color 58% Reduction 1400 1200 1000 1162 945 800 679 600 400 637 592 479 200 0 FY 2008 FY 2010 FY 2011 FY 2013 FY 2014 FY 2015 Source: Sadaya-Ibus, Maria, Department of the Attorney General
Ramsey County, MN Detention Admissions (JDAI Impact over 10 Year Period) 4500 78% reduction (overall) 69% reduction (YOC) 72% reduction (Black youth) =========== == Between 2005 (pre-JDAI) and 2015, Ramsey County saw 1391 fewer admissions for Black youth. 4024 4000 3500 3000 2500 2394 1946 2000 Rate of Admission for Black youth went from 22. 36 (per 100) to 5. 79 (per 100) 1500 979 1000 899 807 576 739 500 0 Pre-JDAI 2010 Total YOC Black Youth 2015 555
San Francisco Youth Population Demographic Percentage of Population 2010 vs. 2015 (ages 10 -17) 100% 90% 80% 41. 4% 44. 5% 70% 60% 50% 40% 22. 3% 22. 4% 30% 8. 1% 9. 2% 20% 10% 23. 6% 28. 0% 2010 2015 0% White Source: OJJDP Easy Access Black Latino Nat Am API Youth of color were 76% of the population in 2010 and 72% of the population in 2015
San Francisco: Average Daily Population ADP: 2010 -2016 YTD (9/26/16) 100 90 80 70 60 50 40 30 20 10 0 2011 2012 African/Am 2013 Asian Latino 2014 PI 2015 Total 2016 -YTD
Sedgwick County Results 22 1200 Sedgwick County Juvenile Arrests (Theft < $1000) 1006 1000 800 737 734 730 Total White 545 600 African American 448 400 337 191 200 307 251 159 346 217 144 Hispanic/Latino 324 240 142 216 181 125 0 2009 2010 2011 2012 2013
Towards Child Well Being 23 Define what this means in this context � Product/Outcome � Better Detention Utilization � Changes in Policies and Practices � Overall Numbers Reduction � Sustained Reduction in Contact with Justice system for Youth of Color � Well Being for Youth of Color/Improved Life Outcomes
W. Haywood Burns Institute 24 James Bell, Founder & Executive Director jbell@burnsinstitute. org Raquel Mariscal, Director of JDAI rmariscal@burnsinstitute. org W. Haywood Burns Institute for Youth Justice Fairness and Equity www. burnsinstitute. org