Journal Club Defronzo RA Banerji MA Bray GA

Journal Club Defronzo RA, Banerji MA, Bray GA, Buchanan TA, Clement S, Henry RR, Kitabchi AE, Mudaliar S, Musi N, Ratner R, Reaven P, Schwenke DC, Stentz FD, Tripathy D; for the ACT NOW Study Group. Determinants of glucose tolerance in impaired glucose tolerance at baseline in the Actos Now for Prevention of Diabetes (ACT NOW) study. Diabetologia. . [Epub ahead of print] Pescovitz MD, Greenbaum CJ, Krause-Steinrauf H, Becker DJ, Gitelman SE, Goland R, Gottlieb PA, Marks JB, Mc. Gee PF, Moran AM, Raskin P, Rodriguez H, Schatz DA, Wherrett D, Wilson DM, Lachin JM, Skyler JS; Type 1 Diabetes Trial. Net Anti-CD 20 Study Group. Rituximab, B-lymphocyte depletion, and preservation of beta-cell function. N Engl J Med. 2009 Nov 26; 361(22): 2143 -52. 2009年 12月24日 8: 30 -8: 55 8階 医局 埼玉医科大学 総合医療センター 内分泌・糖尿病内科 Department of Endocrinology and Diabetes, Saitama Medical Center, Saitama Medical University 松田 昌文 Matsuda, Masafumi
 INDEX DURING OGTT Lean 30 20 Gastaldelli, Ferrannini,")
INSULIN SECRETION / INSULIN RESISTANCE (DISPOSITION) INDEX DURING OGTT Lean 30 20 Gastaldelli, Ferrannini, Abdul-Ghani, De. Fronzo, Diabetologia 41: 31 -39, 2004; JCEM 90: 493 -500, 2005; Diabetes 55: 1430 -35, 2006 10 Obese 0 <1 00 <1 2 <1 0 <1 40 60 <1 8 <2 0 00 <2 40 <2 80 <3 20 <3 60 <4 00 >4 00 ∆ INS/ ∆ GLU ÷ IR 40 NGT IGT T 2 DM 2 -Hour PG (mg/dl)
 CONCENTRATION AND RELATIVE BETA CELL VOLUME IN OBESE SUBJECTS WITH")
FASTING PLASMA GLUCOSE (FPG) CONCENTRATION AND RELATIVE BETA CELL VOLUME IN OBESE SUBJECTS WITH NGT, IFG, & T 2 DM 250 FPG (mg/dl) p<0. 001 200 p<0. 01 150 100 ß-cell Volume (%) 50 NGT IFG T 2 DM 4 3 p<0. 01 2 p<0. 001 1 0 NGT Butler et al, Diabetes 52: 102 -110, 2003 IFG T 2 DM
 Study Ralph A. De.")
ACTos NOW Study for the Prevention of Diabetes (ACT NOW) Study Ralph A. De. Fronzo, MD Professor of Medicine Chief, Diabetes Division, UTHSCSA For ACT NOW STUDY GROUP
 Ethnicity")
SUBJECT DEMOGRAPHICS Placebo Number with IGT Isolated IGT Combined IFG/IGT Gender, F/M (%) Ethnicity C/MA/AA/O Age (years) BMI (kg/m 2) Waist (cm)-Male Female Pioglitazone 299 97 202 58/42 303 98 205 59/41 74/171/144/10 51. 5 34. 5 112. 2 103. 7 79/155/157/12 52. 9 34. 2 110. 5 103. 1
 FPG (mg/dl) 2 -hour PG")
BASELINE LABORATORY VALUES Placebo Hb. A 1 c (%) FPG (mg/dl) 2 -hour PG (mg/dl) Total chol (mg/dl) LDL Chol Triglyceride HDL Chol Fasting FFA (m. M) Sys/Dias BP (mm Hg) 5. 5 105 168 172 108 121 40 528 128/74 Pioglitazone 5. 5 105 168 104 122 39 551 127/74
 Placebo Cumulative Hazard 0. 30 0. 25")
TIME TO OCCURRENCE OF DIABETES (KAPLAN MEIER) Placebo Cumulative Hazard 0. 30 0. 25 0. 20 6. 8% per year HR = 0. 19 (95%, CI)= 0. 09, 0. 39 p<0. 00001 0. 15 0. 10 1. 5% per year 0. 05 Pioglitazone 0 # at risk PLC PIO 0 299 303 10 20 30 40 50 215 220 Months
 Pioglitazone (n=303) P value T")
EFFECT OF PIOGLITAZONE ON GLUCOSE TOLERANCE IGT Placebo (n=299) Pioglitazone (n=303) P value T 2 DM IGT NGT 45 (6. 8%) 84 (28%) 10 (1. 5%) 127 (42%) <0. 00001 <0. 001

EFFECT OF PIOGLITAZONE AND PLACEBO ON INSULIN SECRETION / INSULIN RESISTANCE INDEX Placebo Pioglitazone P<0. 005 I/ G x. Matsuda (0 -120) 6 5 4 3 2 1 0 Pre Post
 INDEX Placebo Pioglitazone P<0.")
EFFECT OF PIOGLITAZONE AND PLACEBO ON DISPOSITION (AIR X SI) INDEX Placebo Pioglitazone P<0. 005 AIR x SI 1200 800 400 0 Pre Post

EFFECT OF PIOGLITAZONE AND PLACEBO ON MATSUDA INDEX OF INSULIN SENSITIVITY Matsuda Index 10 Placebo Pioglitazone P<0. 001 8 6 4 2 0 Pre Post
 IN")
CHANGE IN BETA CELL FUNCTION (∆I/∆G X MATSUDA INDEX AND AIR x SI) IN RELATION TO CHANGE IN GLUCOSE TOLERANCE STATUS 8 ∆I 0 -120/∆G 0 -120 X Matsuda Index 1400 NGT 6 NGT 1200 1000 4 IGT 2 0 AIR x SI DM PRE POST 800 IGT 600 400 DM PRE POST
 Edema CHF CV Events MI /Angina /other CAD events Deaths")
ADVERSE EVENTS PLACEBO (n=299) Edema CHF CV Events MI /Angina /other CAD events Deaths Fractures PIOGLITAZONE (n=303) 45 (15%) 1 (0. 3%) 15 (5%) 67 (22%) 1 (0. 3%) 12 (4%) 1/9/5 1 8 (2. 7%) 1 / 7/ 4 3 8 (2. 7%)
 : N. Musi : D. Tripathy Diabetes Division, University")
R. A. De. Fronzo (*) : N. Musi : D. Tripathy Diabetes Division, University of Texas Health Science Center, 7703 Floyd Curl Drive, San Antonio, TX 78229, USA e-mail: albarado@uthscsa. edu M. A. Banerji SUNY Health Science Center at Brooklyn, NY, USA G. A. Bray Pennington Biomedical Research Center and Louisiana State University, Baton Rouge, LA, USA T. A. Buchanan Keck School of Medicine, University of Southern California, Los Angeles, CA, USA S. Clement Division of Endocrinology and Metabolism, Georgetown University, Washington, DC, USA R. R. Henry : S. Mudaliar VA San Diego Healthcare System and University of California at San Diego, CA, USA A. E. Kitabchi : F. D. Stentz Division of Endocrinology, Diabetes, and Metabolic Diseases, University of Tennessee, Memphis, TN, USA R. Ratner Medstar Research Institute, Hyattsville, MD, USA P. Reaven Phoenix VA Health Care System, Phoenix, AZ, USA D. C. Schwenke W. P. Carey School of Business, Arizona State University, Tempe, AZ, USA Diabetologia DOI 10. 1007/s 00125 -009 -1614 -2

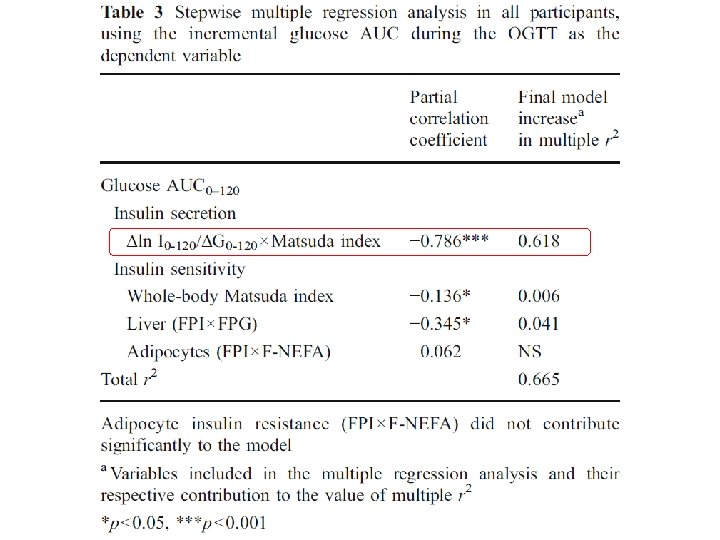
Background and Aim The aim of the study was to examine the determinants of oral glucose tolerance in 602 persons with impaired glucose tolerance (IGT) who participated in the Actos Now for Prevention of Diabetes (ACT NOW) study.

Method In addition to the 602 IGT participants, 115 persons with normal glucose tolerance (NGT) and 50 with impaired fasting glucose (IFG) were identified during screening and included in this analysis. Insulin secretion and insulin sensitivity indices were derived from plasma glucose and insulin during an OGTT. The acute insulin response (AIR) (0– 10 min) and insulin sensitivity (SI) were measured with the frequently sampled intravenous glucose tolerance test (FSIVGTT) in a subset of participants.

convertion factor LDL-C / 0. 0259, x 38. 6 TG / 0. 0113, x 88. 5 PG / 0. 055, x 18 The 602 participants (column 1) represent the sum of the 407 participants with combined IGT plus IFG (column 2) and the 195 participants with isolated IGT (column 3) *p<0. 05 vs NGT Values are mean ± SEM or n (%) A, African-American; E, Europid; MA, Mexican-American; O, other; PI, plasma insulin a
 and insulin (b) concentrations during the OGTT. Relationship between")
Fig. 1 Plasma glucose (a) and insulin (b) concentrations during the OGTT. Relationship between the mean plasma insulin concentration during OGTTand 2 h (d) and fasting (c) plasma glucose concentrations during the OGTT. White circles, IFG; black circles, IFG+IGT; white triangles, IGT; black triangles, NGT. **p=0. 01, ‡p=0. 02, †p=0. 09
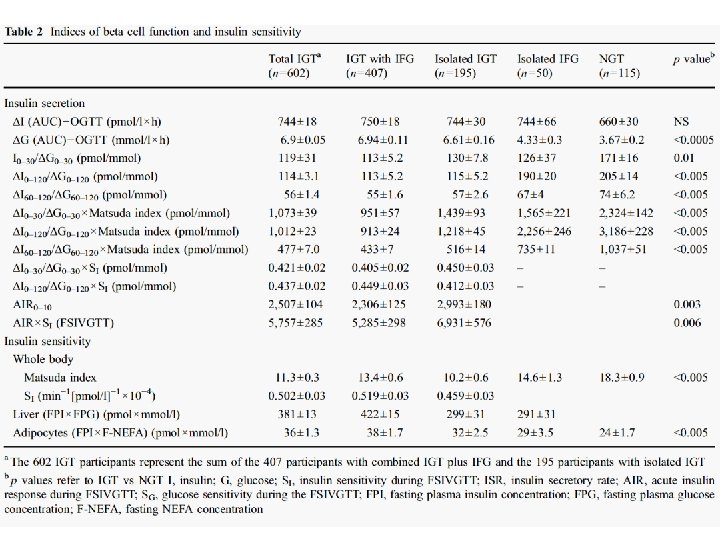

Fig. 2 Insulin secretion/insulin resistance indices (a ΔI 0– 30/ΔG 0– 30× Matsuda index; b ΔI 0– 120/ΔG 0– 120×Matsuda index; c ΔI 60– 120/ΔG 60– 120×Matsuda index) in participants with NGT, isolated IFG and combined IGT/IFG. The p values refer to comparisons with NGT. d Loge of insulin secretion/insulin resistance index plotted against loge of 2 h plasma glucose in participants with NGT (white circles), IFG (black triangles) and all IGT (black circles) (r=– 0, 512, p<0. 0005). †p<0. 00005, ‡p<0. 005

Fig. 3 Insulin secretion indices related to the 2 h plasma glucose concentration: a ΔI 0– 30/ΔG 0– 30×Matsuda index; b ΔI 0– 120/ΔG 0– 120× Matsuda index; c ΔISR 0– 120/ΔG 0– 120×Matsuda index. The p values refer to comparisons with the group with the lowest 2 h plasma glucose concentration. d Loge of ΔI 0– 120/ΔG 0– 120×Matsuda index plotted against loge of 2 h plasma glucose in participants with NGT (white circles), IFG (black triangles) and all IGT (black circles) (r= – 0. 623, p<0. 0005). †p<0. 0005, ***p<0. 001, ‡p<0. 005

Insulin Sensitivity Insulin Secretion
 and Hb. A")
Results At baseline, fasting plasma glucose, 2 h postprandial glucose (OGTT) and Hb. A 1 c were 5. 8± 0. 02 mmol/l, 10. 5± 0. 05 mmol/l and 5. 5± 0. 04%, respectively, in participants with IGT. Participants with IGT were characterized by defects in early (ΔI 0– 30/ΔG 0– 30×Matsuda index, where ΔI is change in insulin in the first 30 min and ΔG is change in glucose in the first 30 min) and total (ΔI 0– 120/ΔG 0– 120× Matsuda index) insulin secretion and in insulin sensitivity (Matsuda index and SI). Participants with IGT in whom 2 h plasma glucose was 7. 8– 8. 3 mmol/l had a 63% decrease in the insulin secretion/insulin resistance (disposition) index vs participants with NGT and this defect worsened progressively as 2 h plasma glucose rose to 8. 9– 9. 94 mmol/l (by 73%) and 10. 0– 11. 05 mmol/l (by 80%). The Matsuda insulin sensitivity index was reduced by 40% in IGT compared with NGT (p< 0. 005). In multivariate analysis, beta cell function was the primary determinant of glucose AUC during OGTT, explaining 62% of the variance.

Conclusion Our results strongly suggest that progressive beta cell failure is the main determinant of progression of NGT to IGT.


N Engl J Med 2009; 361: 2143 -52 From the Indiana University School of Medicine, Indianapolis (M. D. P. , H. R. ); the Benaroya Research Institute, Seattle (C. J. G. ); the George Washington University Biostatistics Center, Rockville, MD (H. K. -S. , P. F. M. , J. M. L. ); the University of Pittsburgh, Pittsburgh (D. J. B. ); the University of California, San Francisco (S. E. G. ); Columbia University, New York (R. G. ); University of Colorado Barbara Davis Center for Childhood Diabetes, Aurora (P. A. G. ); the University of Miami Diabetes Research Institute, Miami ( J. B. M. , J. S. S. ); the University of Minnesota, Minneapolis (A. M. M. ); the University of Texas Southwestern Medical School, Dallas (P. R. ); the University of Florida, Gainesville (D. A. S. ); Hospital for Sick Children, University of Toronto, Toronto (D. W. ); and Stanford University, Stanford, CA (D. M. W. ).

Background The immunopathogenesis of type 1 diabetes mellitus is associated with T-lymphocyte autoimmunity. However, there is growing evidence that B lymphocytes play a role in many T-lymphocyte–mediated diseases. It is possible to achieve selective depletion of B lymphocytes with rituximab, an anti-CD 20 monoclonal antibody. This phase 2 study evaluated the role of B-lymphocyte depletion in patients with type 1 diabetes.

Method We conducted a randomized, double-blind study in which 87 patients between 8 and 40 years of age who had newly diagnosed type 1 diabetes were assigned to receive infusions of rituximab or placebo on days 1, 8, 15, and 22 of the study. The primary outcome, assessed 1 year after the first infusion, was the geometric mean area under the curve (AUC) for the serum C-peptide level during the first 2 hours of a mixed meal tolerance test. Secondary outcomes included safety and changes in the glycated hemoglobin level and insulin dose.

Figure 1. Enrollment, Randomization, and Follow-up of Study Participants. Between May 2006 and August 2007, a total of 126 patients were screened and 87 underwent randomization. Of the 87 patients who underwent randomization, 81 composed the intention-totreat cohort, of whom 78 contributed to the primary effectiveness analyses at 12 months. In 5 of the 6 patients who were excluded, infusions were stopped after an FDA safety alert concerning the development of progressive multifocal leukoencephalopathy in other study populations receiving rituximab; in the other patient, parental consent was withdrawn before administration of the initial infusion.

Plus–minus values are means ±SD. The body-mass index is the weight in kilograms divided by the square of the height in meters. AUC denotes area under the curve. † Race was self-reported.

* Rituximab or placebo was administered at a rate of 50 mg per hour. If infusion- related events did not occur, the infusion rate could be increased in increments of 50 mg per hour every 30 minutes to a maximum of 400 mg per hour. If an infusion rate of 400 mg per hour was tolerated, subsequent infusions started at a rate of 100 mg per hour and were increased by 100 mg per hour every 30 minutes until a rate of 400 mg per hour was reached. For mild infusion reactions, the rate of infusion was slowed or temporarily interrupted and was resumed at half the previous rate on alleviation of symptoms. For moderate or severe infusion reactions, the infusion was not restarted and subsequent infusions were not administered. One patient could have multiple events. NA denotes not applicable. † P values are one-sided and were calculated with the use of Fisher’s exact test. ‡ One patient had a grade 3 infusion reaction consisting of shortness of breath and rash.

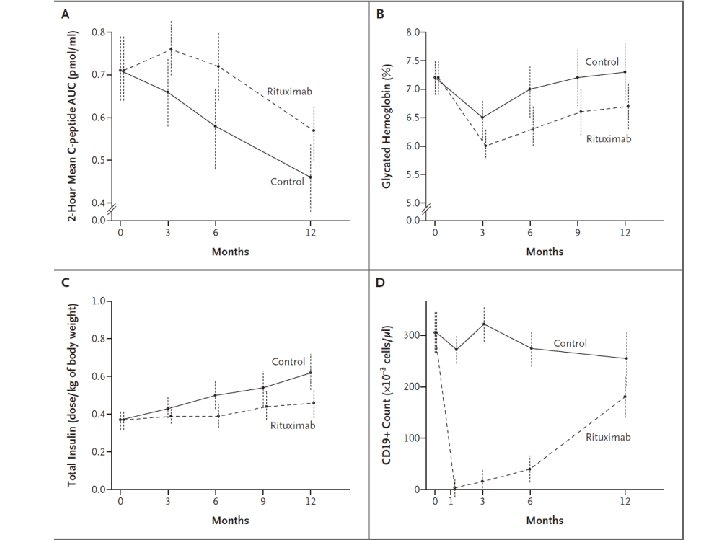
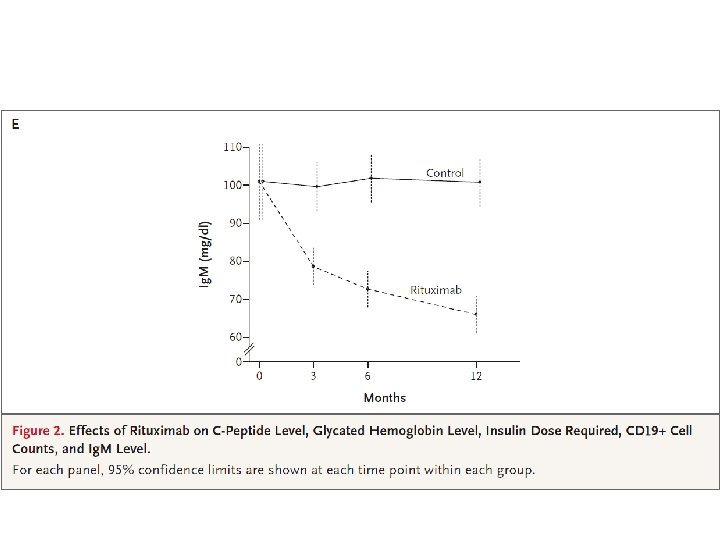
Results At 1 year, the mean AUC for the level of C peptide was significantly higher in the rituximab group than in the placebo group. The rituximab group also had significantly lower levels of glycated hemoglobin and required less insulin. Between 3 months and 12 months, the rate of decline in C-peptide levels in the rituximab group was significantly less than that in the placebo group. CD 19+ B lymphocytes were depleted in patients in the rituximab group, but levels increased to 69% of baseline values at 12 months. More patients in the rituximab group than in the placebo group had adverse events, mostly grade 1 or grade 2, after the first infusion. The reactions appeared to be minimal with subsequent infusions. There was no increase in infections or neutropenia with rituximab.

Conclusion A four-dose course of rituximab partially preserved beta-cell function over a period of 1 year in patients with type 1 diabetes. The finding that B lymphocytes contribute to the pathogenesis of type 1 diabetes may open a new pathway for exploration in the treatment of patients with this condition. (Clinical. Trials. gov number, NCT 00279305. )

 26, 3629– 3636. The schematic diagram illustrates the molecular signaling triggered")
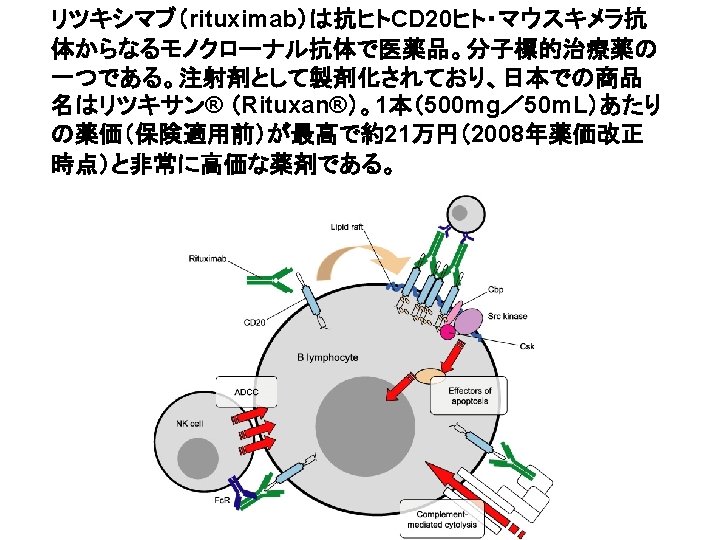
Oncogene (2007) 26, 3629– 3636. The schematic diagram illustrates the molecular signaling triggered by rituximab following its interaction with CD 20+ B-NHL cell lines. The cell lines exhibit constitutively activated p 38 MAPK/NF- B/ERK 1/2/Akt signaling pathways. Following treatment with rituximab, these various signaling pathways are inhibited (⊣ ) and result in the inhibition of both transcription and expression of many genes and particularly the antiapoptotic gene products Bcl-2/Bcl-x. L/MCL-1. In addition, inhibition of the Akt pathway resulted in inhibition of Bad phosphorylation leading to complex formation between Bad and Bcl-x. L. The downregulation of the antiapoptotic gene products and inhibition of the survival pathways induced by rituximab were responsible for chemosensitization of drug resistant B-NHL cell lines. Pharmacologic inhibitors of the above pathways were shown to mimic rituximab and also sensitized the drug-resistant B-NHL cell lines to apoptosis by various chemotherapeutic drugs.
- Slides: 43