
Jones Electrical Distribution Dr C Bulent Aybar Professor

Jones Electrical Distribution Dr. C. Bulent Aybar Professor of International Finance
Context • Jones Electrical Distribution has been expanding rapidly for the past several years. • Increases in working capital requirements have significantly outrun the capacity of the company to generate funds from internal sources. • The company has been forced to forgo taking discounts on accounts payable and to borrow in increasing amounts from its bank to maintain its expansion. • Jones must decide whether to continue to expand and, if so, how to finance the growth. © Dr. C. Bulent Aybar
Impact of Growth on Jones: Investment Requirements – Inventories + Accounts Receivables 2004 2005 2006 $430 $509 $643 – Investment in inventory and A/R has been growing at a rate of ~22%. (current assets has grown at 18. 4%) > Sales growth of 17. 49% for the same period – Fixed Assets Net Fixed Assets Acquisitions 2004 $113 2005 $103 $15 2006 $118 $50 – Growth in fixed assets is moderate! © Dr. C. Bulent Aybar
Working Capital and Sales Growth 2004 2005 2006 WC/Sales 26. 47% 26. 54% 28. 67% FA/Sales 6. 96% 5. 37% 5. 26% Sales $1, 624 $1, 916 $2, 242 COGS $1, 304 $1, 535 $1, 818 A/R $187 $231 $264 Inventory $243 $278 $379 A/P $36 $42 $120 ACP 42 44 43 5. 37 5. 53 4. 80 DSI 68 66 76 APP 10 10 24 CCC 100 95 WCR $381 $453 $509 23. 47% 23. 63% 22. 70% Inv. Turnover WCR/Sales What is the impact of slowing inventory turnover and collection period on Jones’s investment requirements? ?
WC Investment is Growing Faster than Sales! Accounts receivable Sales Change in accounts receivable as pct of sales 12/31/06 Accounts Receivable at 12/31/04 pct of Sales Actual 12/31/06 Accounts Receivable due to increased receivables as % of sales 2004 $187 $1, 624 11. 51% Inventory Sales Change in Inventory as % of sales 12/31/06 Inventory at 12/31/04 pct of Sales Actual 12/31/06 Inventory due to increased Inventory as % of sales Combined $ Combined % of sales $ of A/R and Inventory at 12/31/06 due to slower turnover Combined $ due to sales growth 2006 $379 $2, 242 16. 89% 0. 27% Change $135. 7 1. 93% $335. 4 $378. 6 $43. 2 $429. 8 26. 47% Change $77. 3 $258. 0 $264. 1 $6. 1 2004 $243 $1, 624 14. 96% 2006 $264 $2, 242 11. 78% $642. 8 28. 67% $212. 9 2. 20% $49. 3 $163. 6
Contribution of Declining Efficiency: 23. 2% • Change in company’s working capital is $212. 9 (~213 K) • The company’s financing needs were increased by 2. 20% of sales, or $49. 3 thousand by the longer collection period and slower inventory turn in 2005 and 2006. • The figure of $49. 3 thousand amounts to only 23. 2% of the total increase in accounts receivable and inventories of $213 thousand between December 31, 2004 and December 31, 2006; • Therefore sales growth accounts for the a substantial majority of the additional funds invested in receivables and inventories. © Dr. C. Bulent Aybar
Does Jones Generate Sufficient Cash Flows? 2005 2006 2005 -06 Net Income Depreciation Inventory Accounts receivable Trade credit (Accounts payable) Accrued expenses Cash flows from operations $29 $25 ($35) ($44) $6 $1 ($18) $30 $35 ($101) ($33) $77 $1 $9 $59 $60 ($136) ($77) $84 $1 ($9) Capital expenditures Cash flows from investing activities ($15) ($50) ($65) Bank borrowing (Line of credit) Reduce long-term debt Cash flow from financing activities $65 ($24) $41 $35 ($24) $11 $100 ($48) $52 $8 ($30) ($22) Increase / (decrease) in cash
Is Jones’ Assessment of Funding Need Accurate? • Maybe if Jones continues to rely heavily on trade credit as a source of funds, as he has been during recent years • Probably no if he decides to pay his accounts payable promptly in order to take advantage of the 2% discount offered on payments made within 10 days of the date of invoice. • How can we tell? © Dr. C. Bulent Aybar
Before we move on to assessment of funding need. . • What is the cost of not taking the discount for Jones? • Assume $1000 purchase – Take discount pay $980 on day 10 – Do not take discount pay $1, 000 on day 30 • Not taking the discount costs $20 for 20 days of $1, 000 purchase, or 2% per 20 days – Annualized cost 2% x (365/20)=36. 5% – If APP is stretched to 40 days cost s ~24% © Dr. C. Bulent Aybar
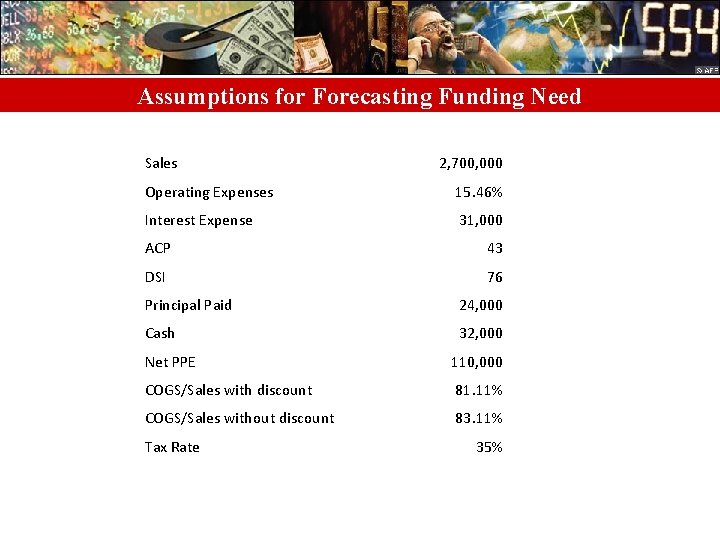
Assumptions for Forecasting Funding Need Sales 2, 700, 000 Operating Expenses 15. 46% Interest Expense 31, 000 ACP 43 DSI 76 Principal Paid 24, 000 Cash 32, 000 Net PPE 110, 000 COGS/Sales with discount 81. 11% COGS/Sales without discount 83. 11% Tax Rate 35%
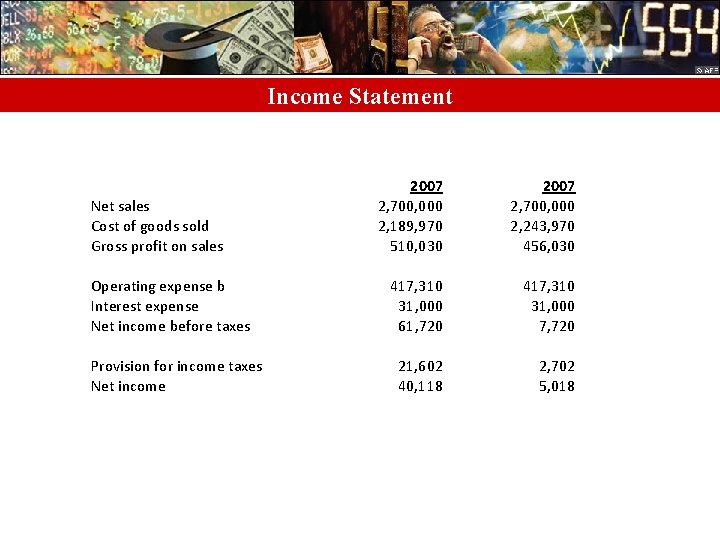
Income Statement Net sales Cost of goods sold Gross profit on sales Operating expense b Interest expense Net income before taxes Provision for income taxes Net income 2007 2, 700, 000 2, 189, 970 510, 030 2007 2, 700, 000 2, 243, 970 456, 030 417, 310 31, 000 61, 720 417, 310 31, 000 7, 720 21, 602 40, 118 2, 702 5, 018
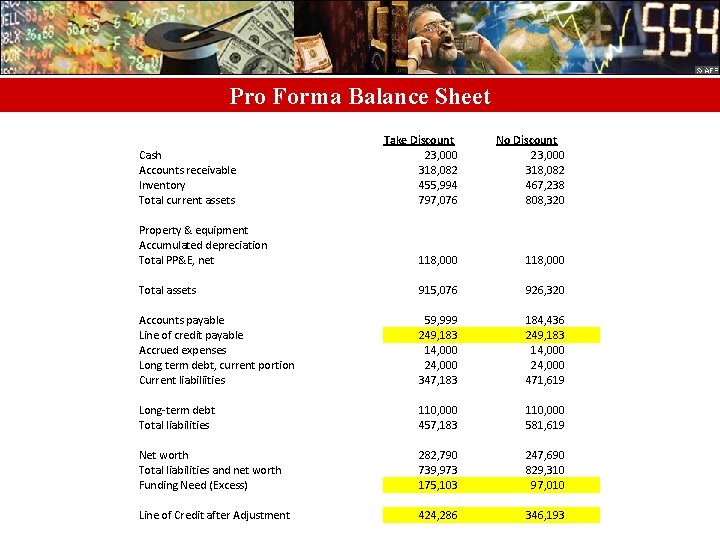
Pro Forma Balance Sheet Take Discount 23, 000 318, 082 455, 994 797, 076 No Discount 23, 000 318, 082 467, 238 808, 320 Property & equipment Accumulated depreciation Total PP&E, net 118, 000 Total assets 915, 076 926, 320 Accounts payable Line of credit payable Accrued expenses Long term debt, current portion Current liabiliities 59, 999 249, 183 14, 000 24, 000 347, 183 184, 436 249, 183 14, 000 24, 000 471, 619 Long-term debt Total liabilities 110, 000 457, 183 110, 000 581, 619 Net worth Total liabilities and net worth Funding Need (Excess) 282, 790 739, 973 175, 103 247, 690 829, 310 97, 010 Line of Credit after Adjustment 424, 286 346, 193 Cash Accounts receivable Inventory Total current assets
- Slides: 12