
Jody Culham Brain and Mind Institute Department of
Jody Culham Brain and Mind Institute Department of Psychology Western University http: //www. fmri 4 newbies. com/ Group Analyses in f. MRI Last Update: November 21, 2016 Last Course: Psychology 9223, F 2016, Western University
Group Analyses 1. Get all the subjects’ brains into a common space – Talairach space – MNI space – cortex-based alignment 2 A. Do group statistics – Random Effects GLM and/or 2 B. Use a Region of Interest Approach
Combining Group Data
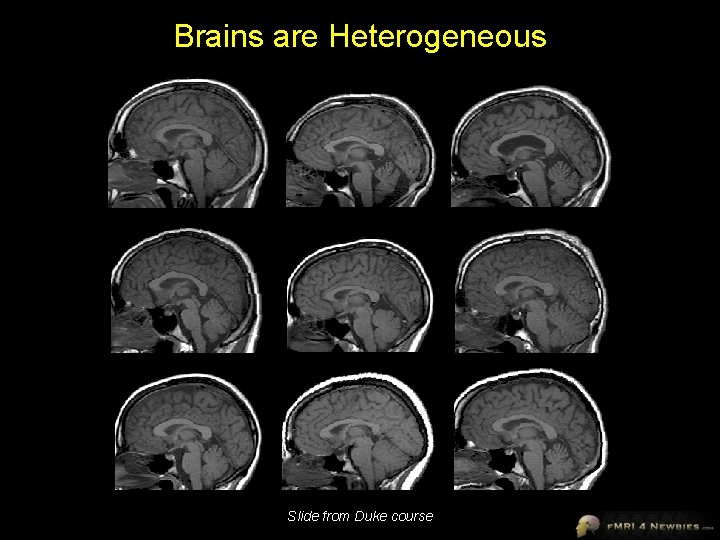
Brains are Heterogeneous Slide from Duke course
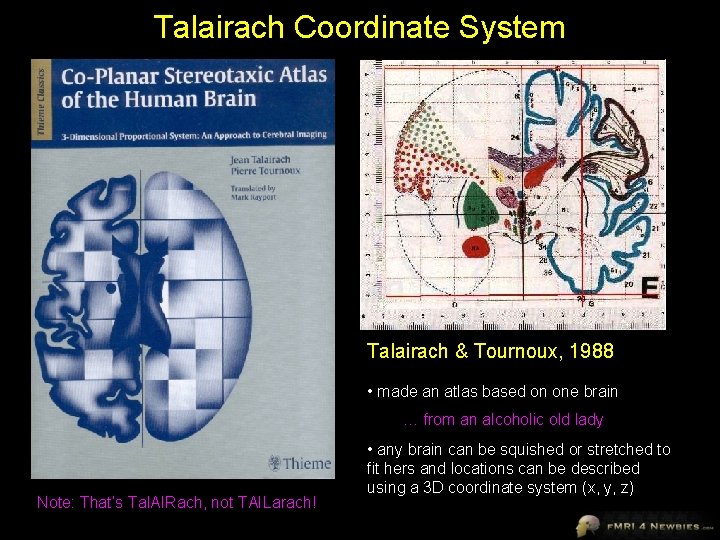
Talairach Coordinate System Talairach & Tournoux, 1988 • made an atlas based on one brain … from an alcoholic old lady Note: That’s Tal. AIRach, not TAILarach! • any brain can be squished or stretched to fit hers and locations can be described using a 3 D coordinate system (x, y, z)
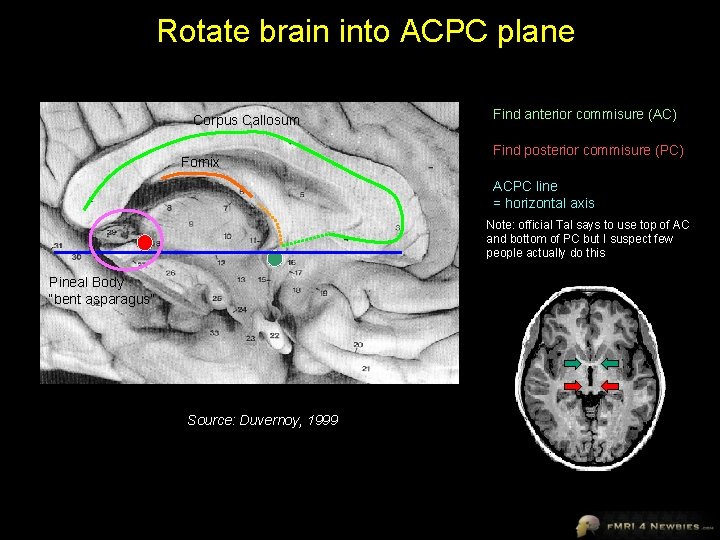
Rotate brain into ACPC plane Corpus Callosum Fornix Find anterior commisure (AC) Find posterior commisure (PC) ACPC line = horizontal axis Note: official Tal says to use top of AC and bottom of PC but I suspect few people actually do this Pineal Body “bent asparagus” Source: Duvernoy, 1999
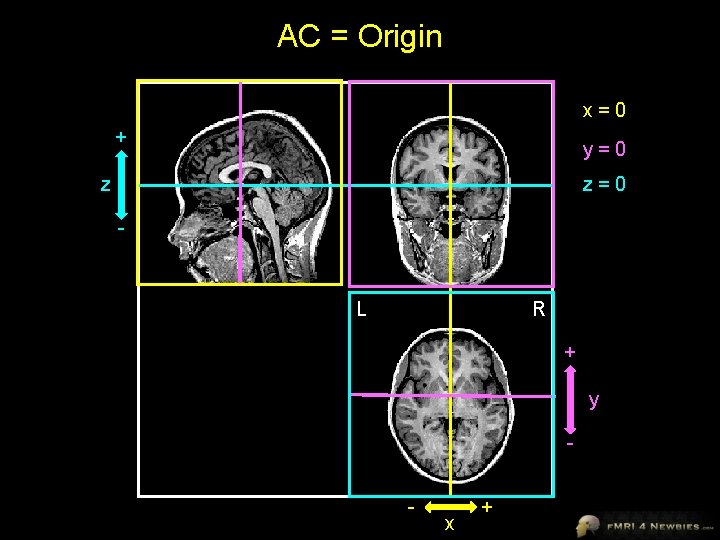
AC = Origin x=0 + y=0 z z=0 - L R + y - x +
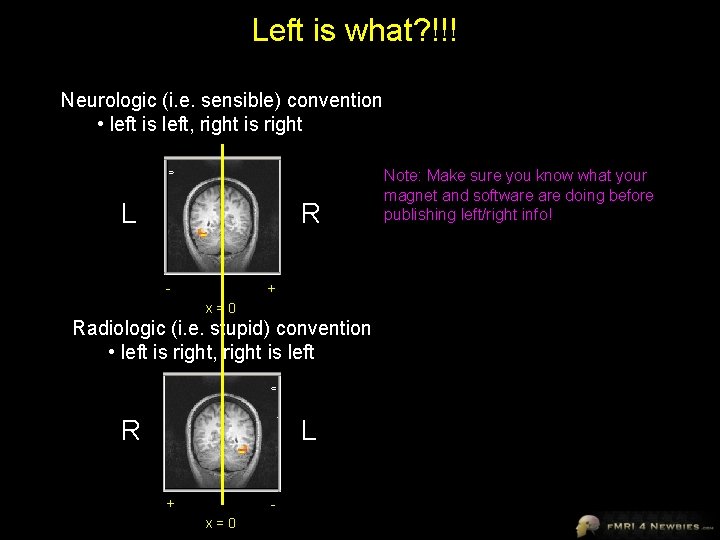
Left is what? !!! Neurologic (i. e. sensible) convention • left is left, right is right L R - + x=0 Radiologic (i. e. stupid) convention • left is right, right is left R L + x=0 Note: Make sure you know what your magnet and software doing before publishing left/right info!
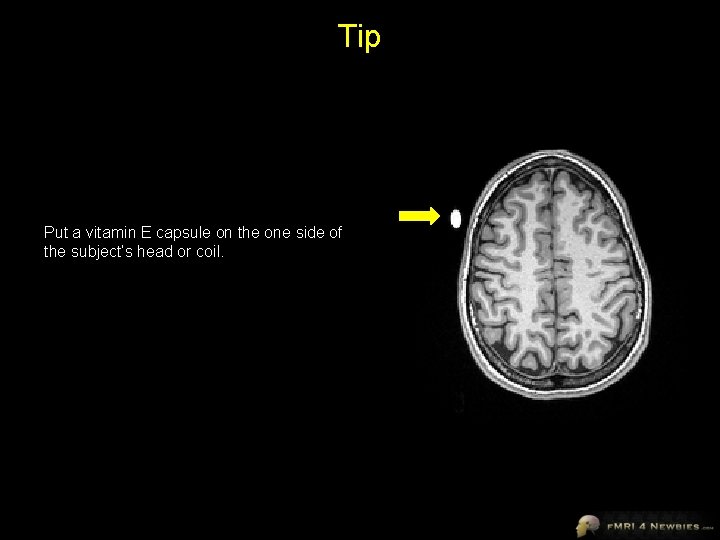
Tip Put a vitamin E capsule on the one side of the subject’s head or coil.
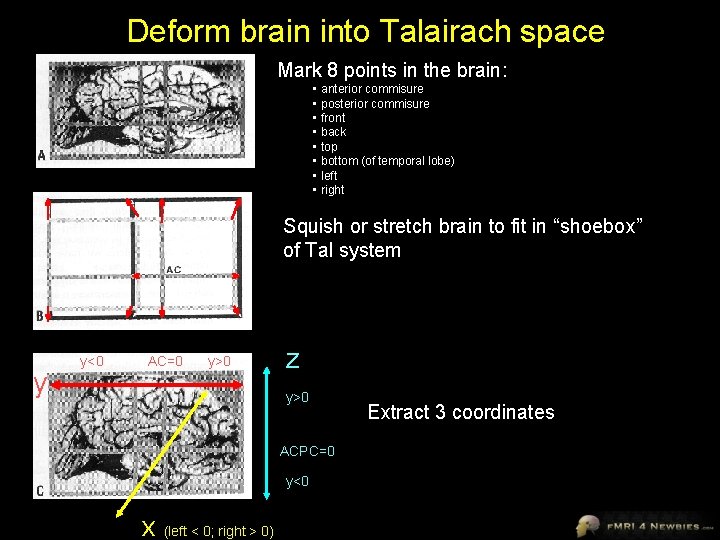
Deform brain into Talairach space Mark 8 points in the brain: • anterior commisure • posterior commisure • front • back • top • bottom (of temporal lobe) • left • right Squish or stretch brain to fit in “shoebox” of Tal system y y<0 AC=0 y>0 z y>0 ACPC=0 y<0 x (left < 0; right > 0) Extract 3 coordinates
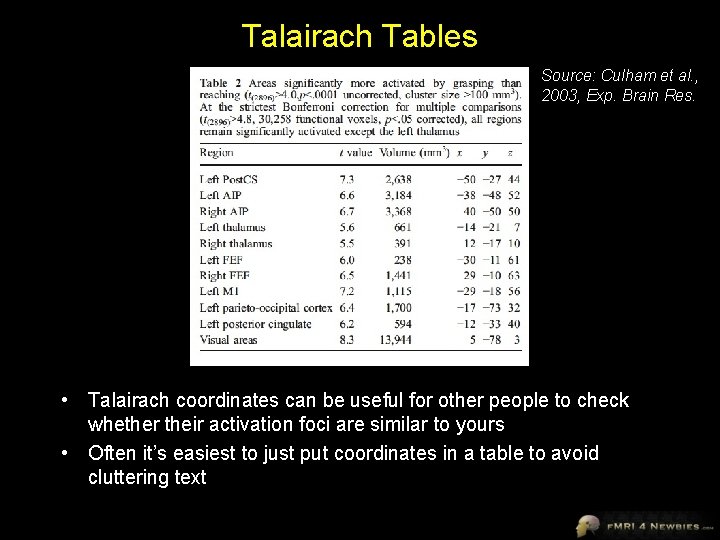
Talairach Tables Source: Culham et al. , 2003, Exp. Brain Res. • Talairach coordinates can be useful for other people to check whether their activation foci are similar to yours • Often it’s easiest to just put coordinates in a table to avoid cluttering text
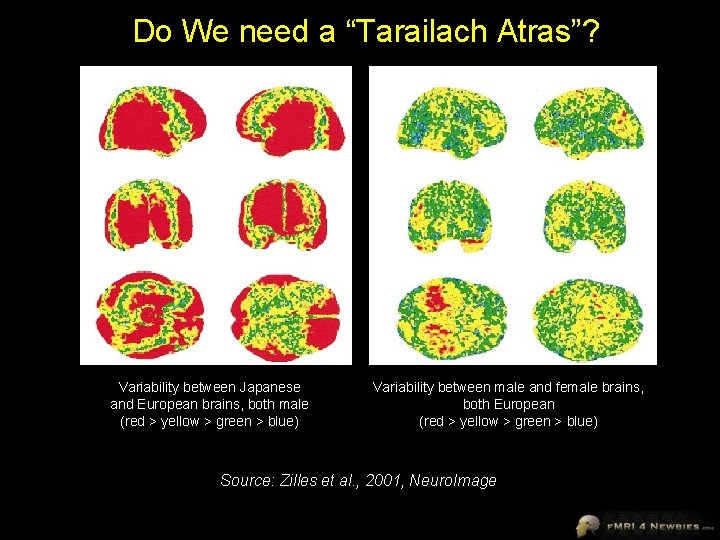
Do We need a “Tarailach Atras”? Variability between Japanese and European brains, both male (red > yellow > green > blue) Variability between male and female brains, both European (red > yellow > green > blue) Source: Zilles et al. , 2001, Neuro. Image
Talairach Pros and Cons Advantages • widespread system • allows averaging of f. MRI data between subjects • allows researchers to compare activation foci • relatively easy to use Disadvantages • does better for central regions of cortex, but not great for most of cortex • not appropriate for all brains (e. g. , group variability, patients may not fit well) • ignores left- vs. right-hemisphere asymmetries • activation foci can vary considerably – other landmarks like sulci may be more reliable
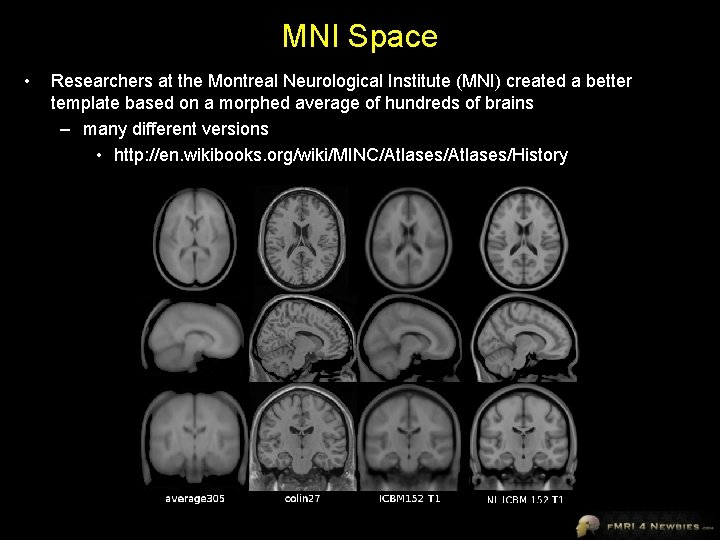
MNI Space • Researchers at the Montreal Neurological Institute (MNI) created a better template based on a morphed average of hundreds of brains – many different versions • http: //en. wikibooks. org/wiki/MINC/Atlases/History
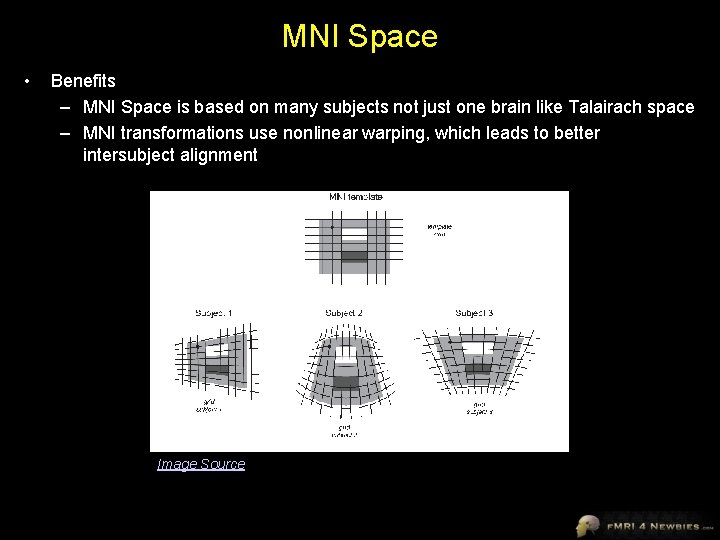
MNI Space • Benefits – MNI Space is based on many subjects not just one brain like Talairach space – MNI transformations use nonlinear warping, which leads to better intersubject alignment Image Source
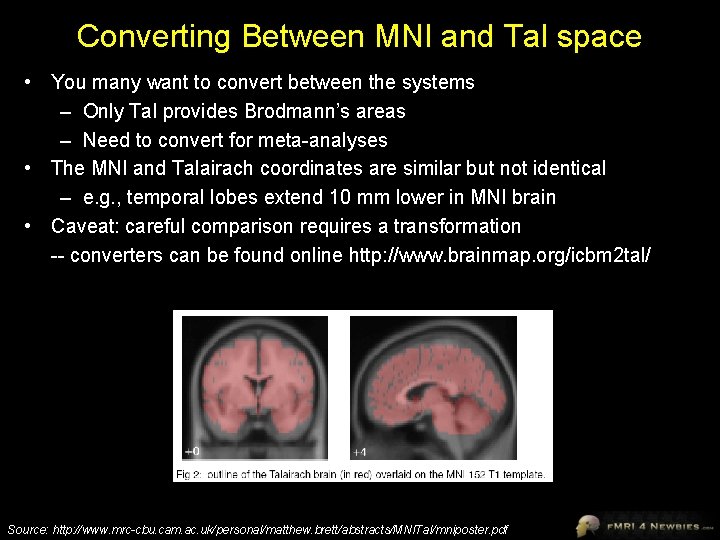
Converting Between MNI and Tal space • You many want to convert between the systems – Only Tal provides Brodmann’s areas – Need to convert for meta-analyses • The MNI and Talairach coordinates are similar but not identical – e. g. , temporal lobes extend 10 mm lower in MNI brain • Caveat: careful comparison requires a transformation -- converters can be found online http: //www. brainmap. org/icbm 2 tal/ Source: http: //www. mrc-cbu. cam. ac. uk/personal/matthew. brett/abstracts/MNITal/mniposter. pdf
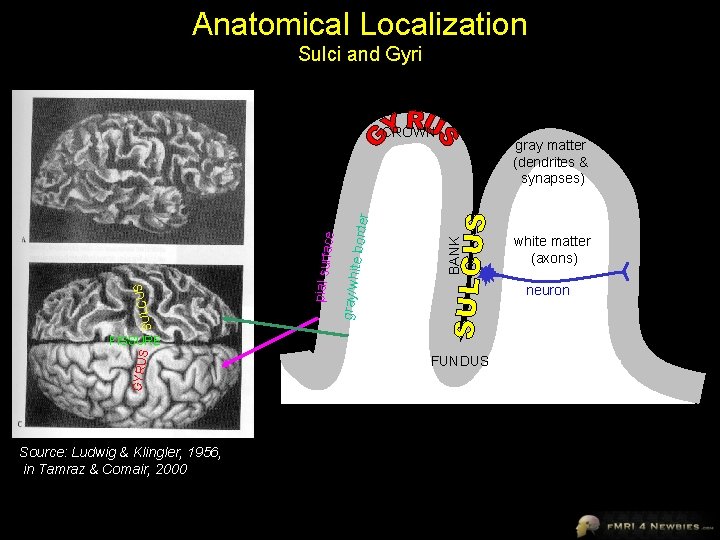
Anatomical Localization Sulci and Gyri GYRU S Source: Ludwig & Klingler, 1956, in Tamraz & Comair, 2000 BANK ite bord e gray/wh gray matter (dendrites & synapses) SULCUS FISSURE pial surf SULC US ace r CROWN FUNDUS white matter (axons) neuron
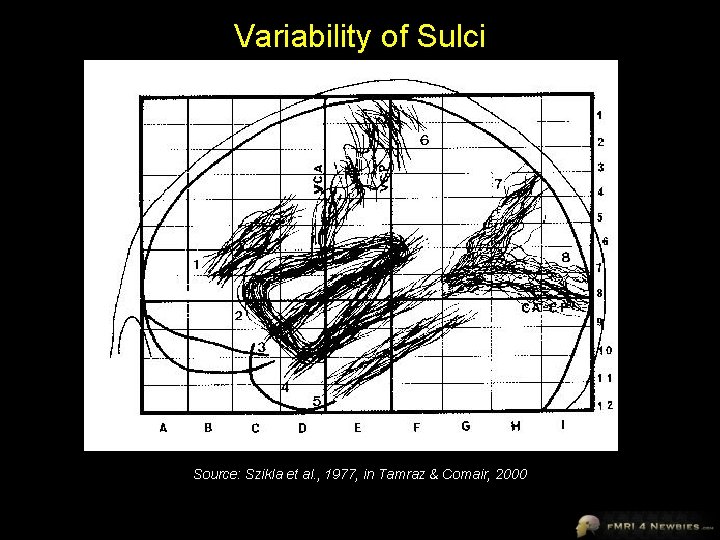
Variability of Sulci Source: Szikla et al. , 1977, in Tamraz & Comair, 2000
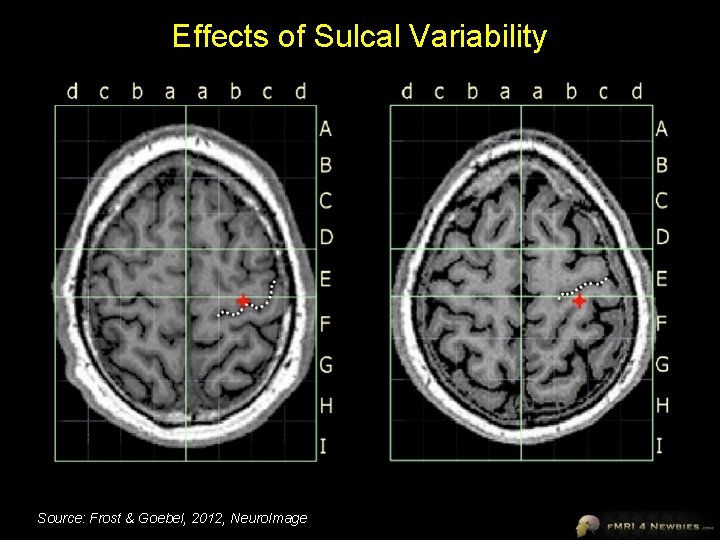
Effects of Sulcal Variability Source: Frost & Goebel, 2012, Neuro. Image
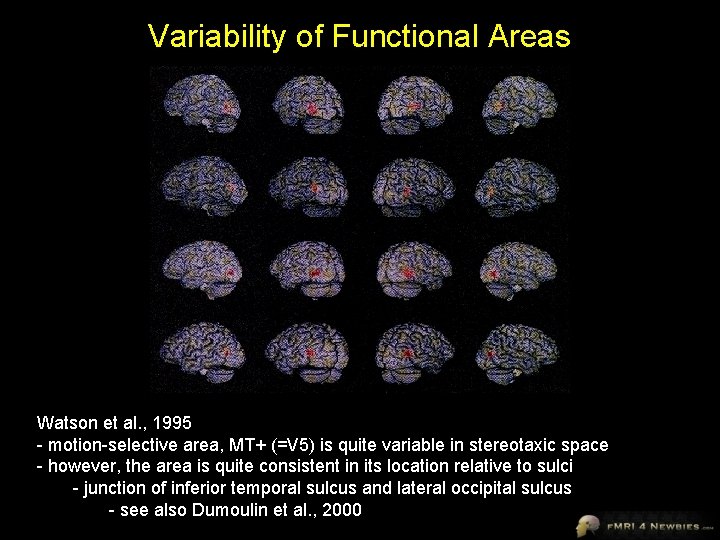
Variability of Functional Areas Watson et al. , 1995 - motion-selective area, MT+ (=V 5) is quite variable in stereotaxic space - however, the area is quite consistent in its location relative to sulci - junction of inferior temporal sulcus and lateral occipital sulcus - see also Dumoulin et al. , 2000
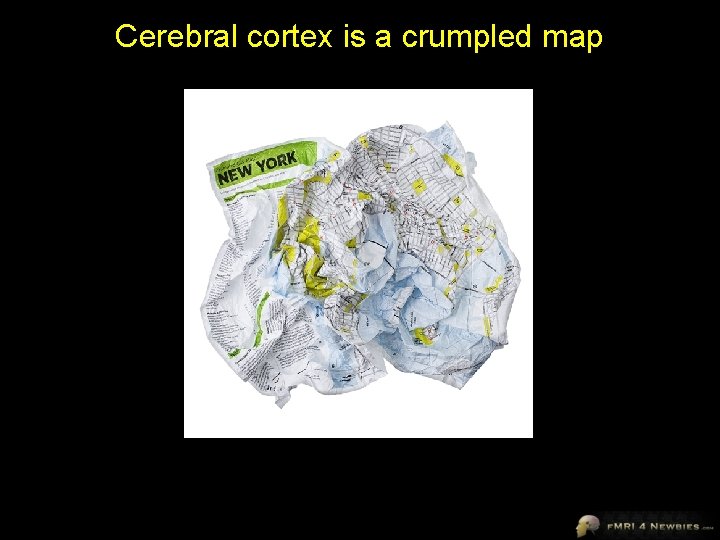
Cerebral cortex is a crumpled map
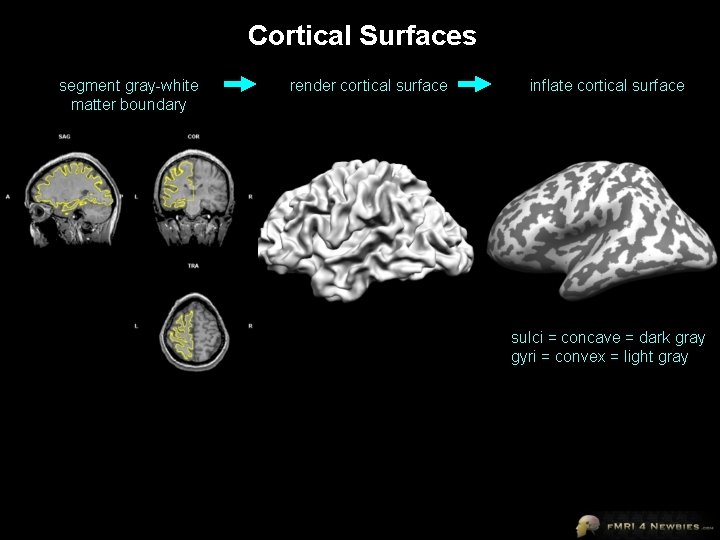
Cortical Surfaces segment gray-white matter boundary render cortical surface inflate cortical surface sulci = concave = dark gray gyri = convex = light gray
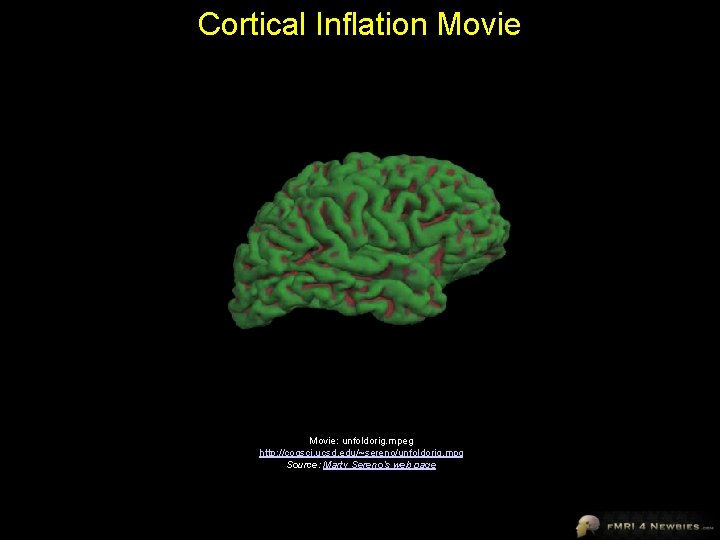
Cortical Inflation Movie: unfoldorig. mpeg http: //cogsci. ucsd. edu/~sereno/unfoldorig. mpg Source: Marty Sereno’s web page
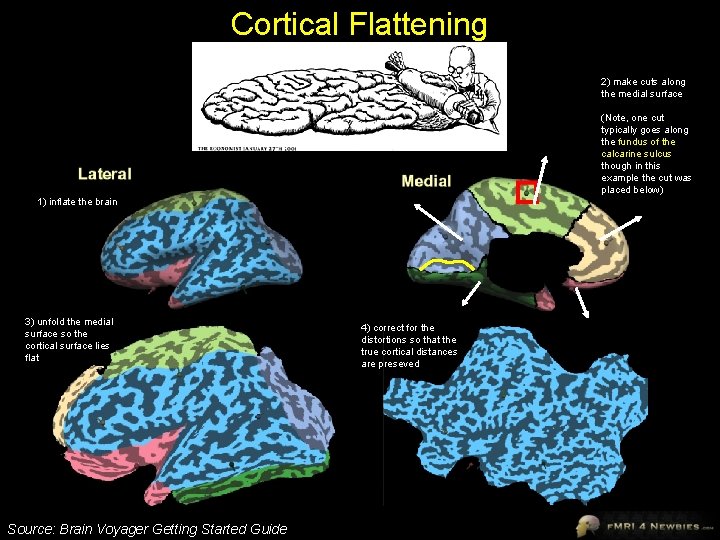
Cortical Flattening 2) make cuts along the medial surface (Note, one cut typically goes along the fundus of the calcarine sulcus though in this example the cut was placed below) 1) inflate the brain 3) unfold the medial surface so the cortical surface lies flat Source: Brain Voyager Getting Started Guide 4) correct for the distortions so that the true cortical distances are preseved
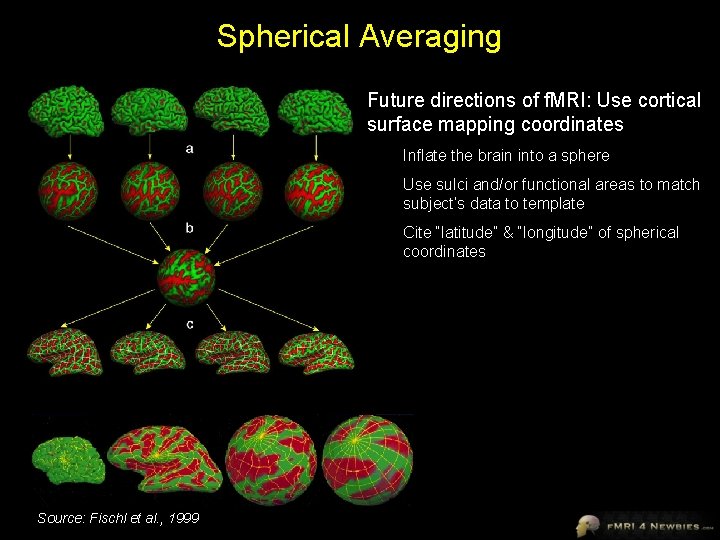
Spherical Averaging Future directions of f. MRI: Use cortical surface mapping coordinates Inflate the brain into a sphere Use sulci and/or functional areas to match subject’s data to template Cite “latitude” & “longitude” of spherical coordinates Source: Fischl et al. , 1999
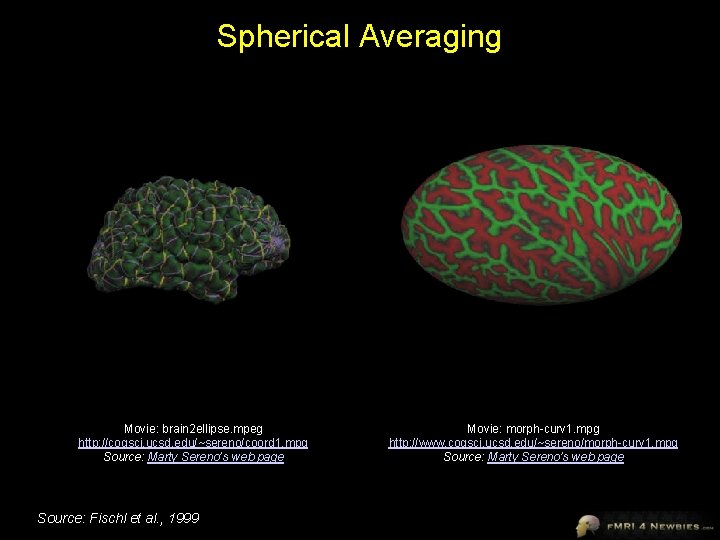
Spherical Averaging Movie: brain 2 ellipse. mpeg http: //cogsci. ucsd. edu/~sereno/coord 1. mpg Source: Marty Sereno’s web page Source: Fischl et al. , 1999 Movie: morph-curv 1. mpg http: //www. cogsci. ucsd. edu/~sereno/morph-curv 1. mpg Source: Marty Sereno’s web page
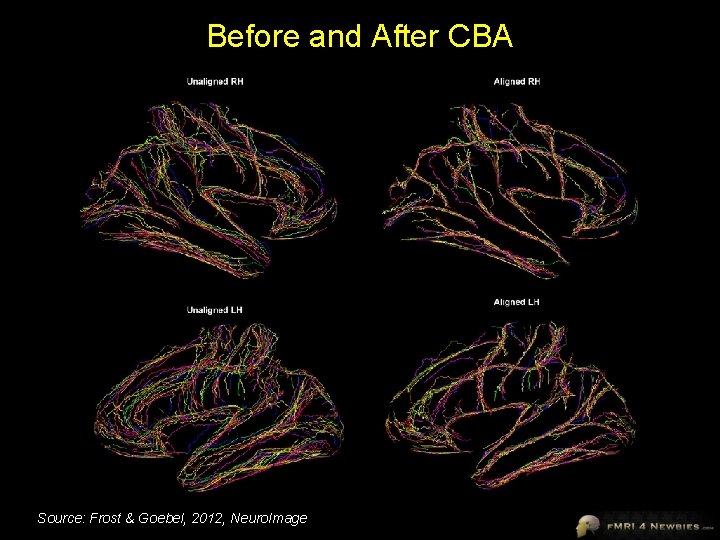
Before and After CBA Source: Frost & Goebel, 2012, Neuro. Image
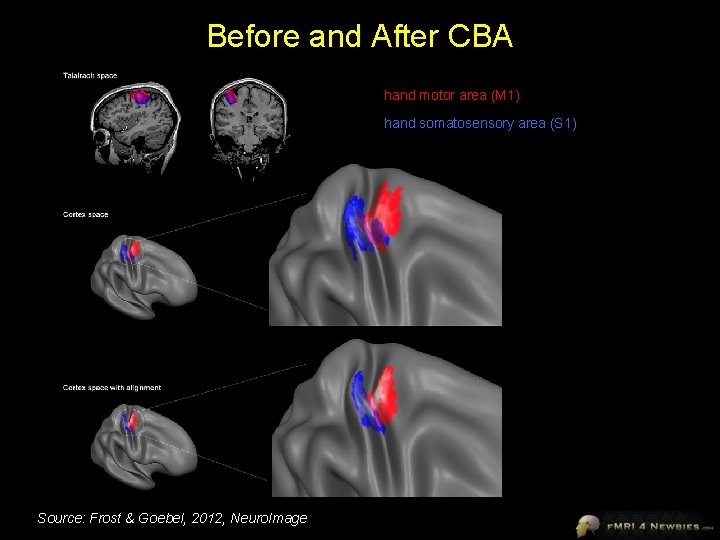
Before and After CBA hand motor area (M 1) hand somatosensory area (S 1) Source: Frost & Goebel, 2012, Neuro. Image
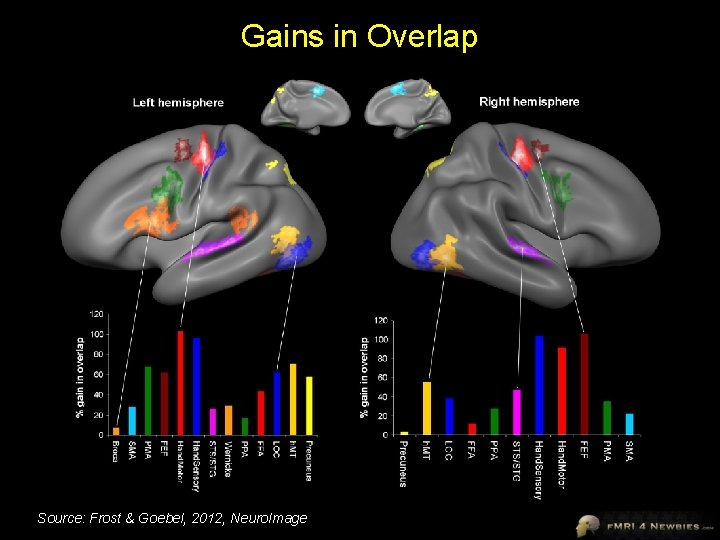
Gains in Overlap Source: Frost & Goebel, 2012, Neuro. Image
Voxelwise Group Analyses Fixed vs. Random Effects
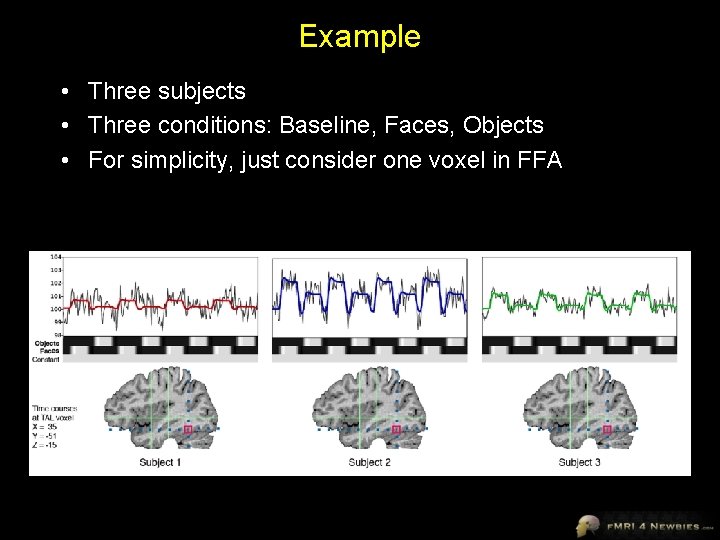
Example • Three subjects • Three conditions: Baseline, Faces, Objects • For simplicity, just consider one voxel in FFA
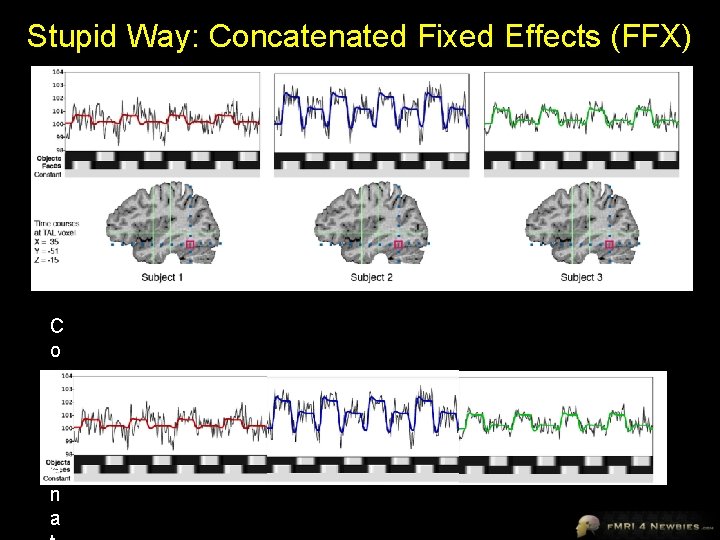
Stupid Way: Concatenated Fixed Effects (FFX) C o n c a t e n a
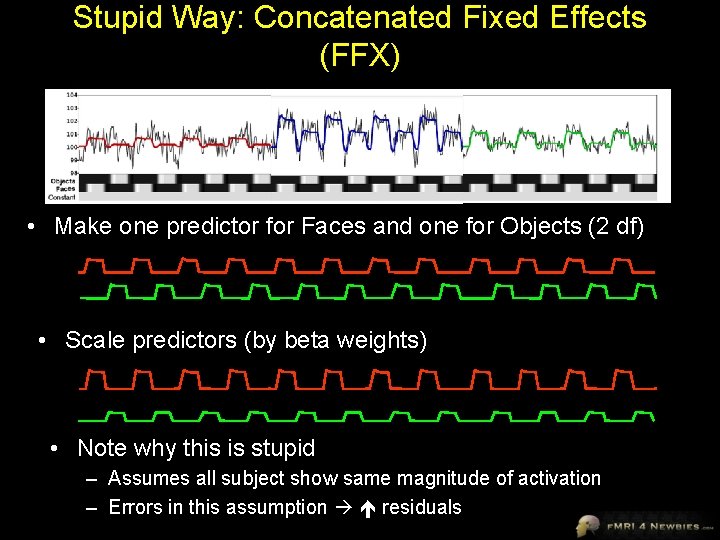
Stupid Way: Concatenated Fixed Effects (FFX) • Make one predictor for Faces and one for Objects (2 df) • Scale predictors (by beta weights) • Note why this is stupid – Assumes all subject show same magnitude of activation – Errors in this assumption residuals
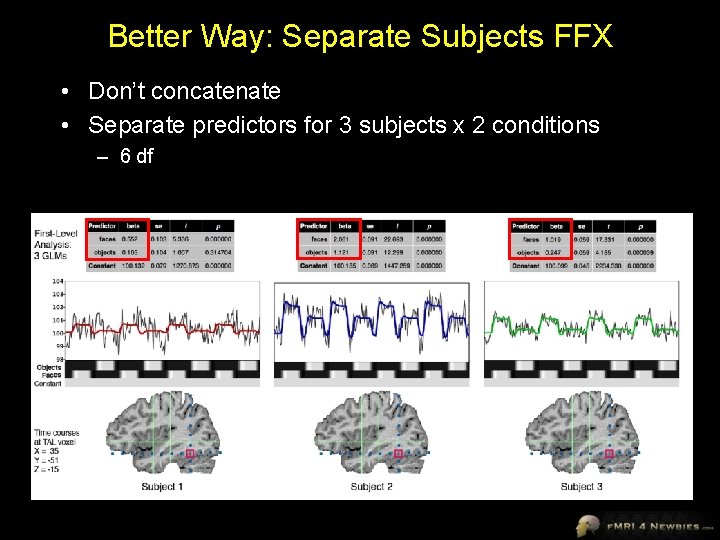
Better Way: Separate Subjects FFX • Don’t concatenate • Separate predictors for 3 subjects x 2 conditions – 6 df

Problem: Separate Subjects FFX • We could do business-as-usual GLM and see if predictors account for significant variance considering noise • Effectively, we are asking how confident we are that this effect is true (not due to chance) in these three subjects (and only these three subjects) • BUT usually, we want to generalize to the population from which we sampled
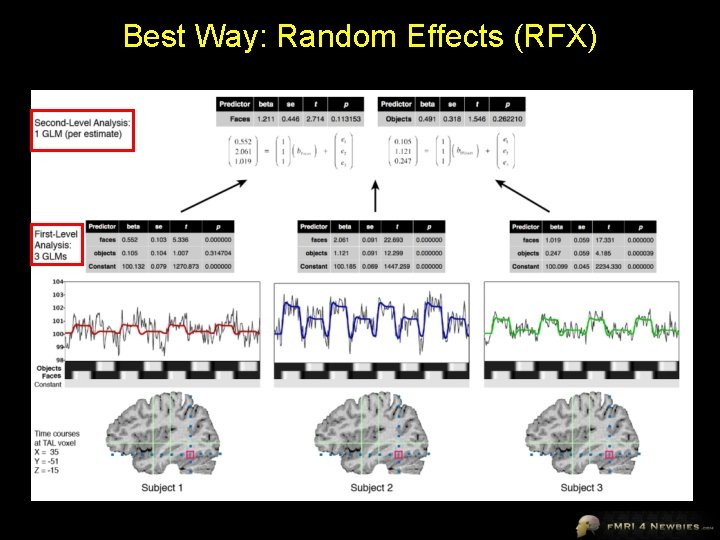
Best Way: Random Effects (RFX)
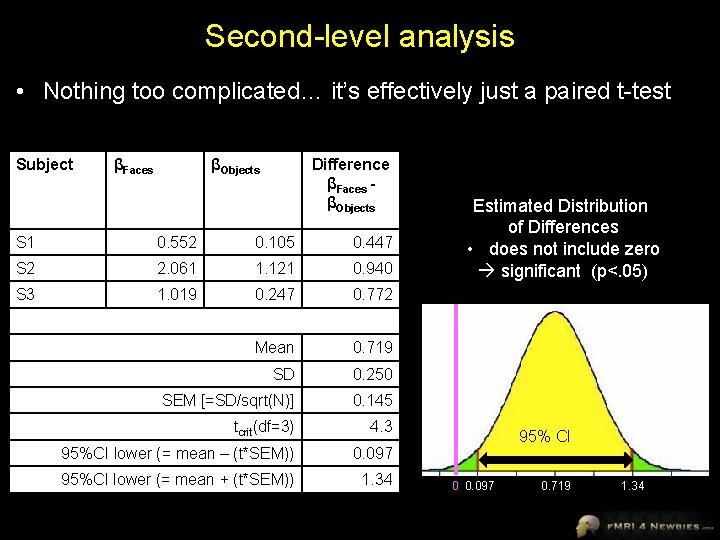
Second-level analysis • Nothing too complicated… it’s effectively just a paired t-test Subject βFaces βObjects Difference βFaces βObjects S 1 0. 552 0. 105 0. 447 S 2 2. 061 1. 121 0. 940 S 3 1. 019 0. 247 0. 772 Mean 0. 719 SD 0. 250 SEM [=SD/sqrt(N)] 0. 145 tcrit(df=3) 4. 3 95%CI lower (= mean – (t*SEM)) 0. 097 95%CI lower (= mean + (t*SEM)) 1. 34 Estimated Distribution of Differences • does not include zero significant (p<. 05) 95% CI 0 0. 097 0. 719 1. 34
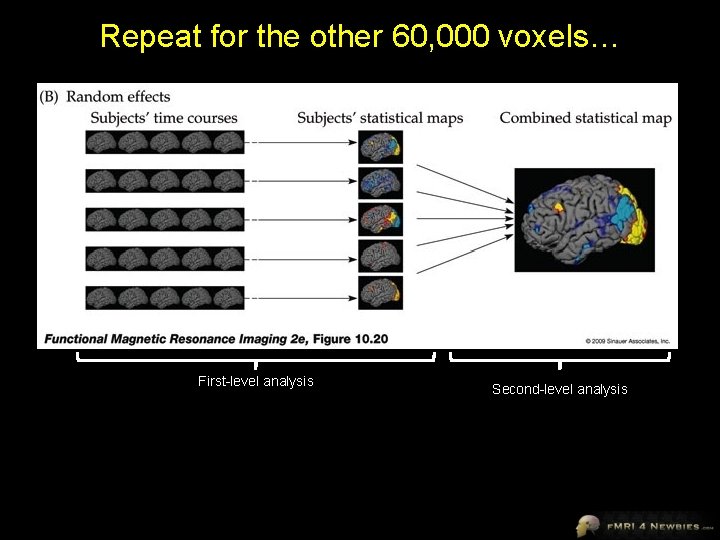
Repeat for the other 60, 000 voxels… Huettel, Song & Mc. Carthy, 2008 First-level analysis Second-level analysis
If you really want to be correct… • We often refer to this type of analysis as random effects (RFX) • Since subjects is a random effect but other aspects (e. g. , stimulus categories) are fixed effects, technically the proper term is Mixed Effects Analysis • Other common jargon = Second-level Analysis
Take-home Message • RFX enables us to generalize to the population from which we sampled subjects for most f. MRI studies, this means underpaid graduate students in need of a few bucks! • Degrees of freedom comes from number of subjects, not number of time points – No need to worry about correction for serial correlations

Examples from a real data set
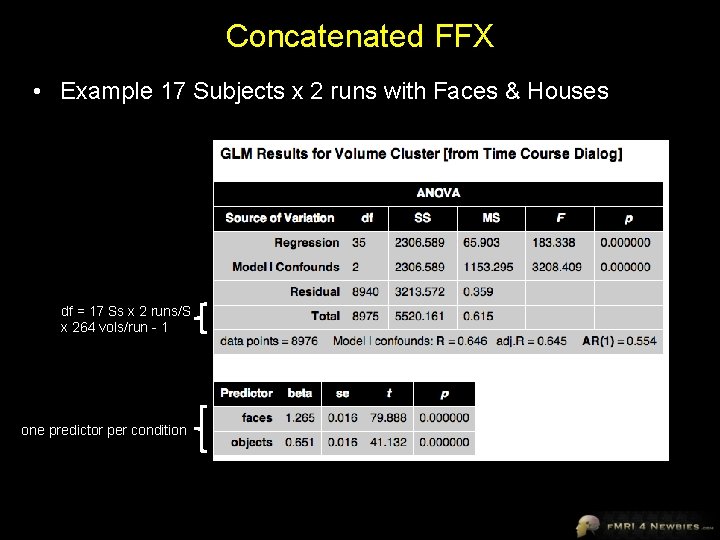
Concatenated FFX • Example 17 Subjects x 2 runs with Faces & Houses df = 17 Ss x 2 runs/S x 264 vols/run - 1 one predictor per condition
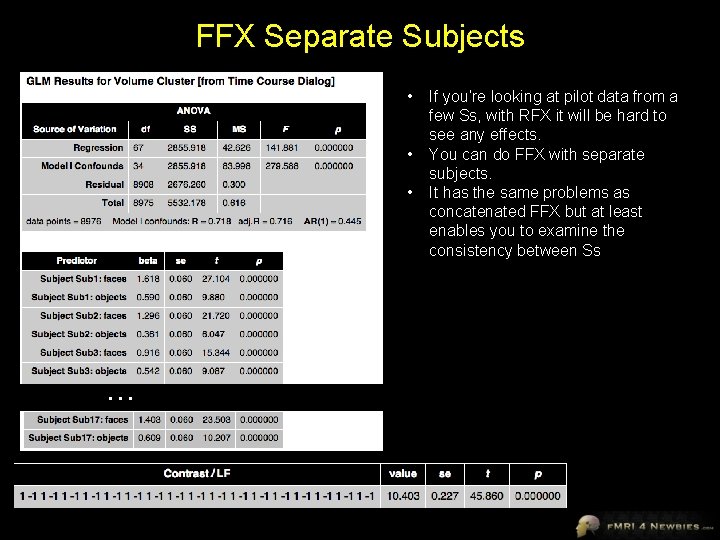
FFX Separate Subjects • • • … If you’re looking at pilot data from a few Ss, with RFX it will be hard to see any effects. You can do FFX with separate subjects. It has the same problems as concatenated FFX but at least enables you to examine the consistency between Ss
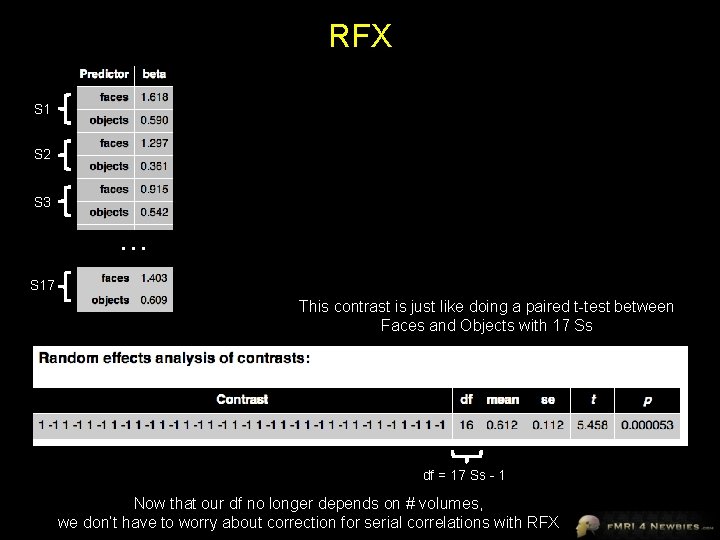
RFX S 1 S 2 S 3 … S 17 This contrast is just like doing a paired t-test between Faces and Objects with 17 Ss df = 17 Ss - 1 Now that our df no longer depends on # volumes, we don’t have to worry about correction for serial correlations with RFX
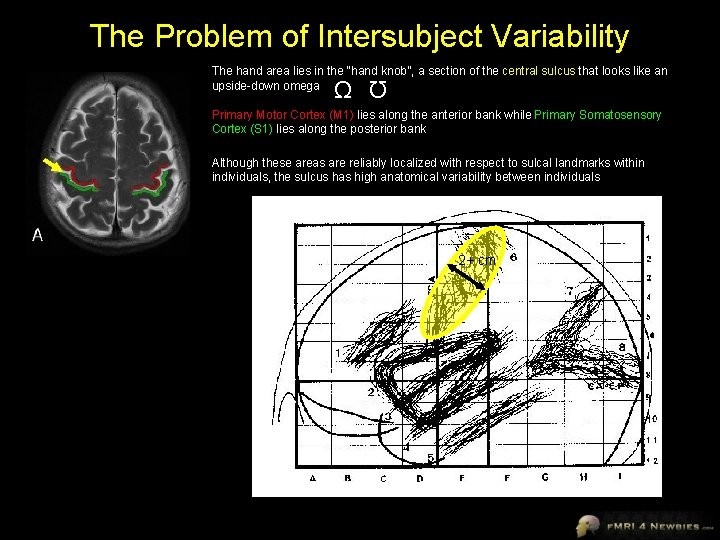
The Problem of Intersubject Variability The hand area lies in the “hand knob”, a section of the central sulcus that looks like an upside-down omega Ω Ω Primary Motor Cortex (M 1) lies along the anterior bank while Primary Somatosensory Cortex (S 1) lies along the posterior bank Although these areas are reliably localized with respect to sulcal landmarks within individuals, the sulcus has high anatomical variability between individuals 2+ cm
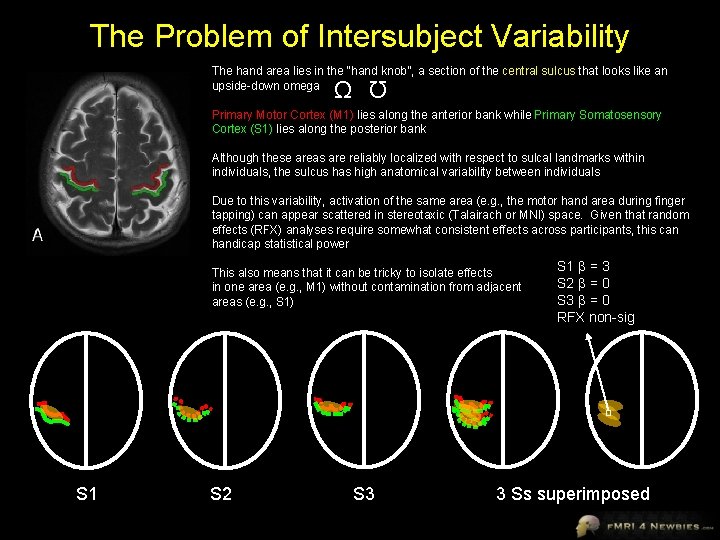
The Problem of Intersubject Variability The hand area lies in the “hand knob”, a section of the central sulcus that looks like an upside-down omega Ω Ω Primary Motor Cortex (M 1) lies along the anterior bank while Primary Somatosensory Cortex (S 1) lies along the posterior bank Although these areas are reliably localized with respect to sulcal landmarks within individuals, the sulcus has high anatomical variability between individuals Due to this variability, activation of the same area (e. g. , the motor hand area during finger tapping) can appear scattered in stereotaxic (Talairach or MNI) space. Given that random effects (RFX) analyses require somewhat consistent effects across participants, this can handicap statistical power This also means that it can be tricky to isolate effects in one area (e. g. , M 1) without contamination from adjacent areas (e. g. , S 1) S 1 S 2 S 3 S 1 β = 3 S 2 β = 0 S 3 β = 0 RFX non-sig 3 Ss superimposed
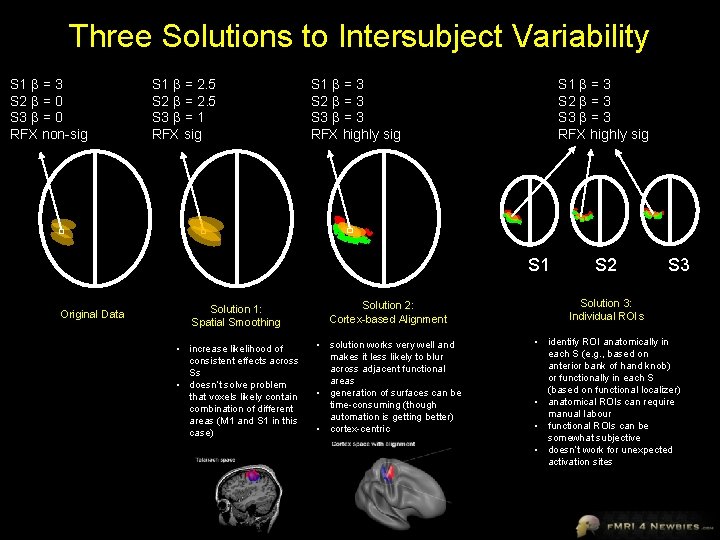
Three Solutions to Intersubject Variability S 1 β = 3 S 2 β = 0 S 3 β = 0 RFX non-sig S 1 β = 2. 5 S 2 β = 2. 5 S 3 β = 1 RFX sig S 1 β = 3 S 2 β = 3 S 3 β = 3 RFX highly sig S 1 Original Data S 2 S 3 Solution 1: Spatial Smoothing Solution 2: Cortex-based Alignment Solution 3: Individual ROIs • increase likelihood of consistent effects across Ss • doesn’t solve problem that voxels likely contain combination of different areas (M 1 and S 1 in this case) • solution works very well and makes it less likely to blur across adjacent functional areas • generation of surfaces can be time-consuming (though automation is getting better) • cortex-centric • identify ROI anatomically in each S (e. g. , based on anterior bank of hand knob) or functionally in each S (based on functional localizer) • anatomical ROIs can require manual labour • functional ROIs can be somewhat subjective • doesn’t work for unexpected activation sites
Random Effects Analysis • Brain Voyager recommends you don’t even toy with random effects unless you’ve got 10 or more subjects (and 50+ is best) • Random effects analyses can really squash your data, especially if you don’t have many subjects. • Though standards were lower in the early days of f. MRI, today it’s virtually impossible to publish any group voxelwise data without RFX analysis
Strategies for Exploration vs. Publication • Deductive approach – – • Have a specific hypothesis/contrast planned Run all your subjects Run the stats as planned Publish Inductive approach – Run a few subjects to see if you’re on the right track – Spend a lot of time exploring the pilot data for interesting patterns – “Find the story” in the data – You may even change the experiment, run additional subjects, or run a follow-up experiment to chase the story • While you need to use rigorous corrections for publication, do not be overly conservative when exploring pilot data or you might miss interesting trends • Random effects analyses can be quite conservative so you may want to do exploratory analyses with fixed effects (and then run more subjects if needed so you can publish random effects)
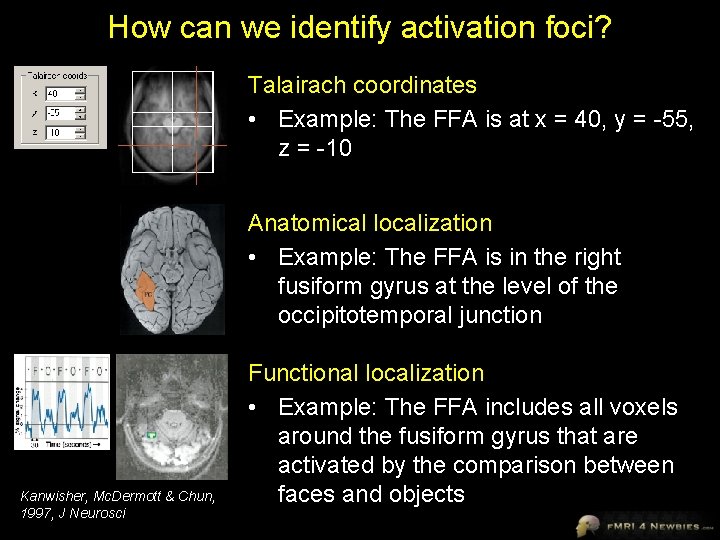
How can we identify activation foci? Talairach coordinates • Example: The FFA is at x = 40, y = -55, z = -10 Anatomical localization • Example: The FFA is in the right fusiform gyrus at the level of the occipitotemporal junction Kanwisher, Mc. Dermott & Chun, 1997, J Neurosci Functional localization • Example: The FFA includes all voxels around the fusiform gyrus that are activated by the comparison between faces and objects
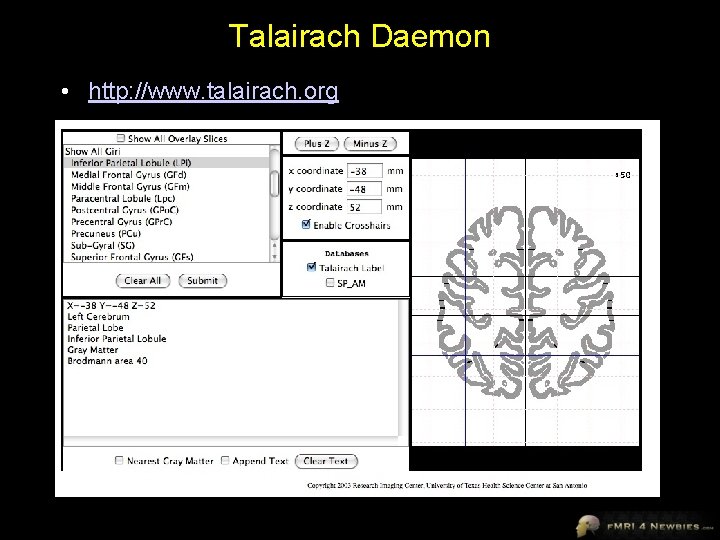
Talairach Daemon • http: //www. talairach. org
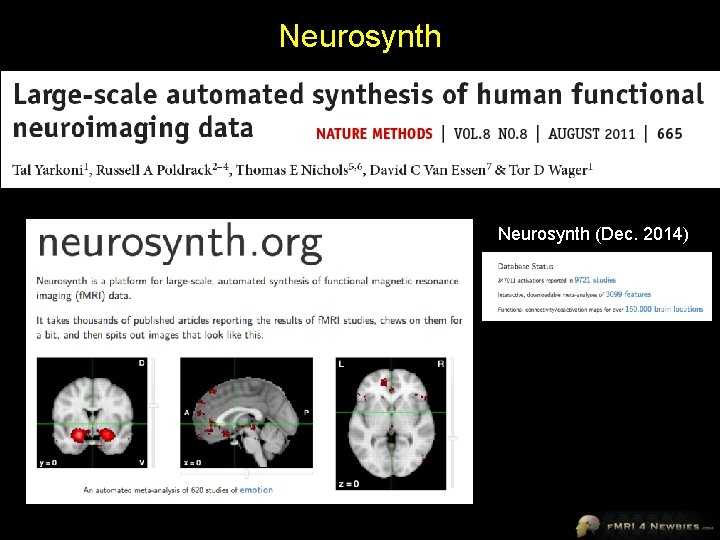
Neurosynth (Dec. 2014)
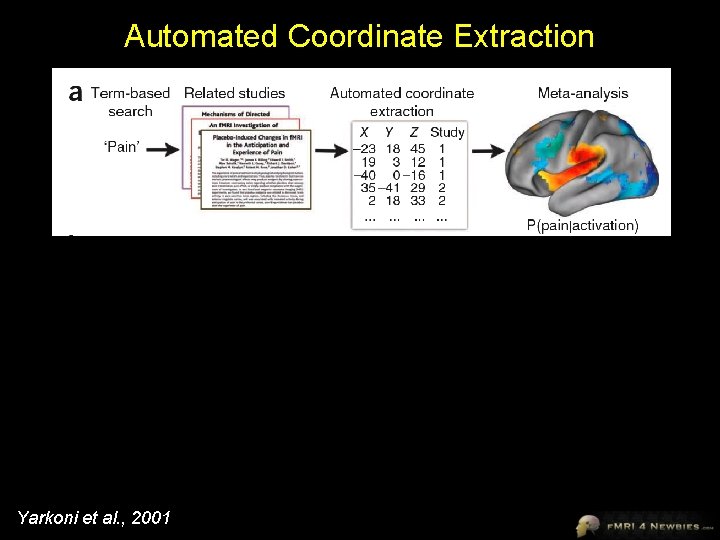
Automated Coordinate Extraction Yarkoni et al. , 2001
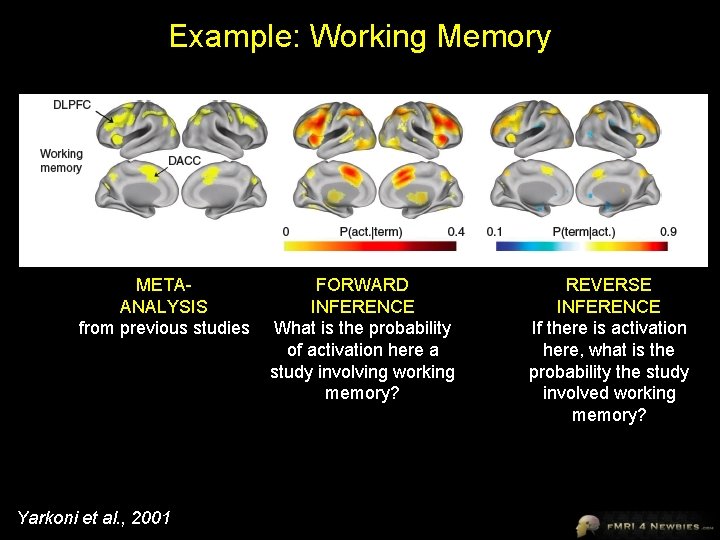
Example: Working Memory METAANALYSIS from previous studies Yarkoni et al. , 2001 FORWARD INFERENCE What is the probability of activation here a study involving working memory? REVERSE INFERENCE If there is activation here, what is the probability the study involved working memory?
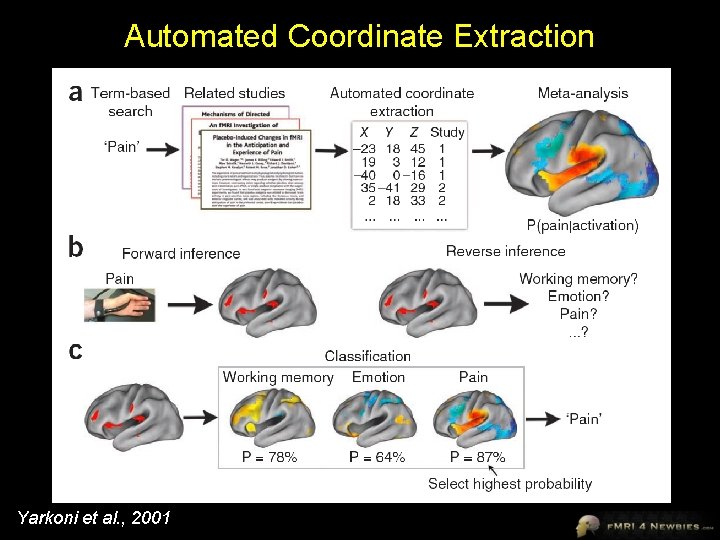
Automated Coordinate Extraction Yarkoni et al. , 2001
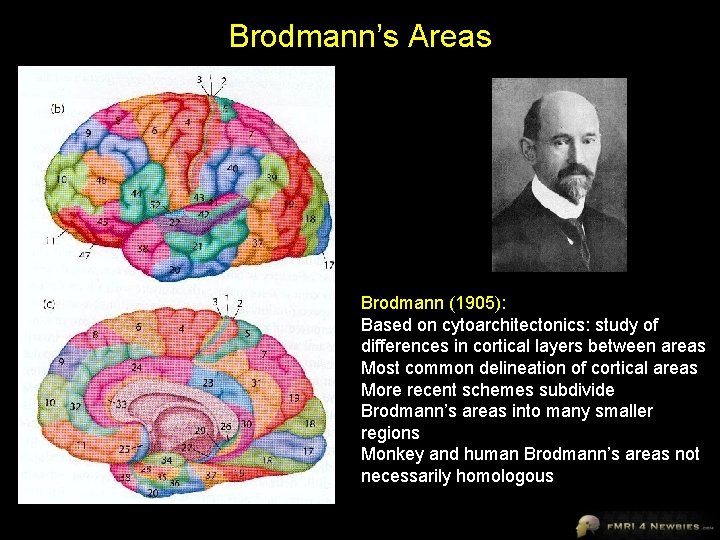
Definition of an “Area” • Neuroimager’s definition of an area: Some blob vaguely in the vicinity (+/- ~3 cm) of where I think it ought to be that lights up for something I think it ought to light up for • Neuroanatomist’s definition of an area: A circumscribed region of the cerebral cortex in which neurons together serve a specific function, receive connections from the same regions, have a common structural arrangement, and in some cases show a topographic arrangement • may also be called a cortical field 56
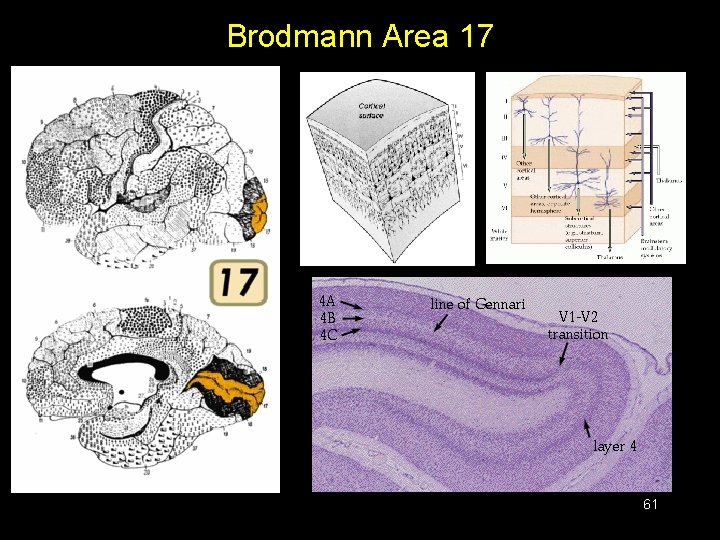
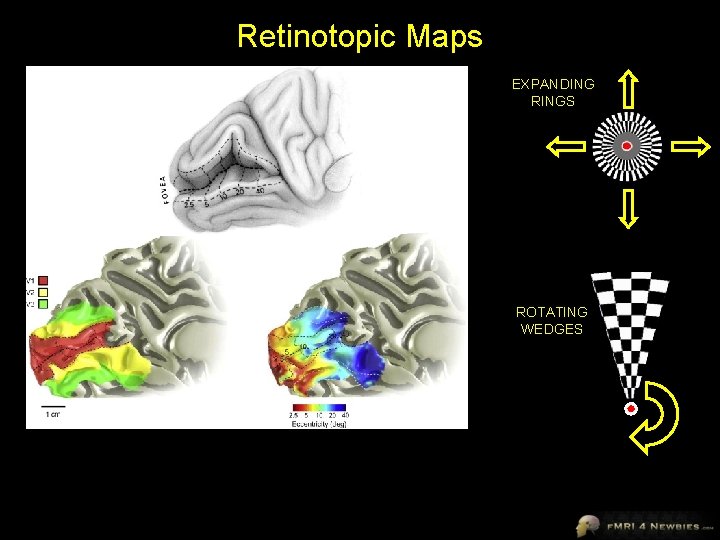
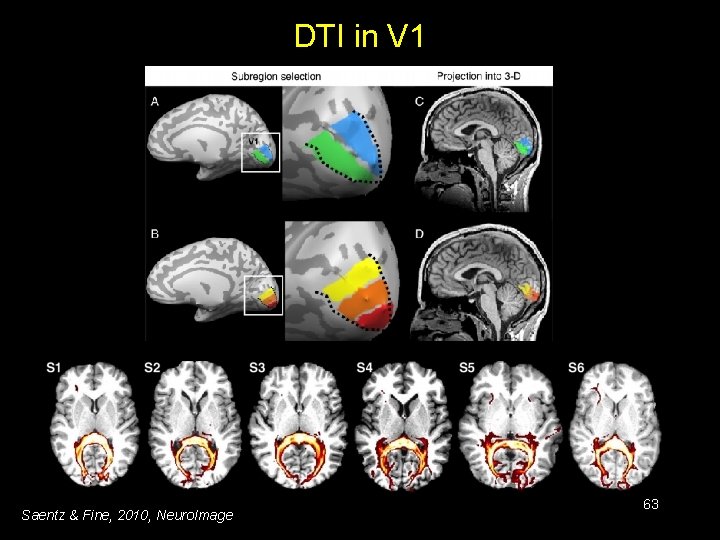
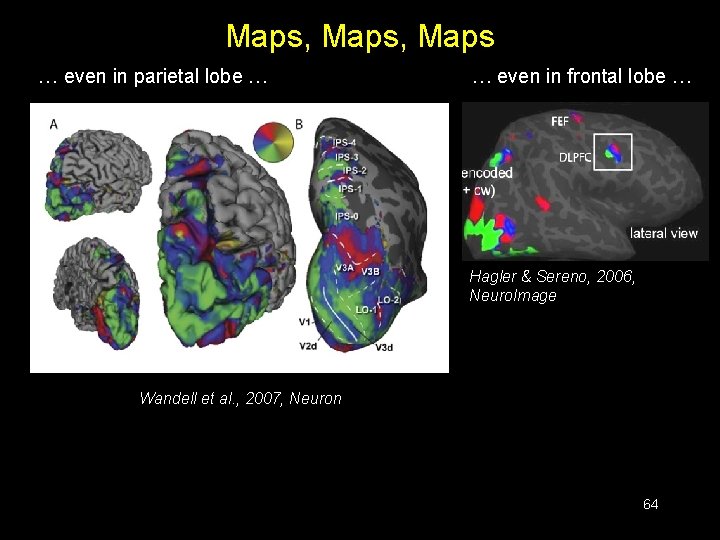
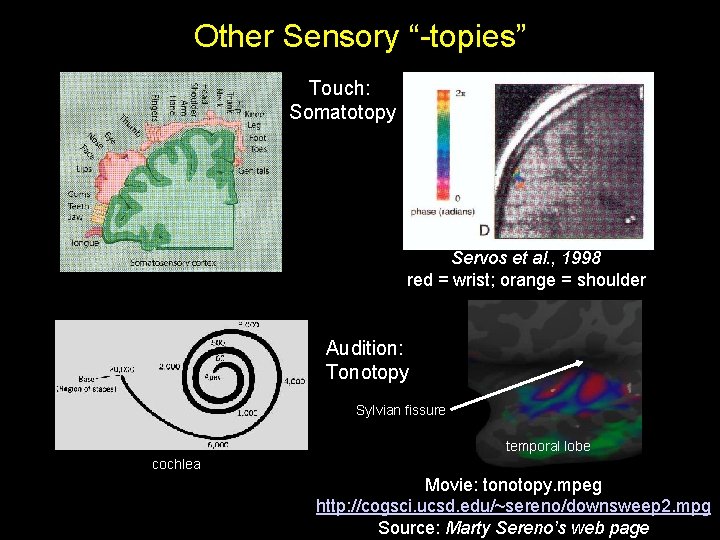
Cortical Fields: Multiple Criteria 1. Function – an area has a unique pattern of responses to different stimuli 2. Architecture – different brain areas show differences between cortical properties (e. g. , thickness of different layers, sensitivity to various dyes) 3. Connectivity – Different areas have different patterns of connections with other areas 4. Topography – many sensory areas show topography (retinotopy, somatotopy, tonotopy) – boundaries between topographic maps can indicate boundaries between areas (e. g. , separate maps of visual space in visual areas V 1 and V 2) 57
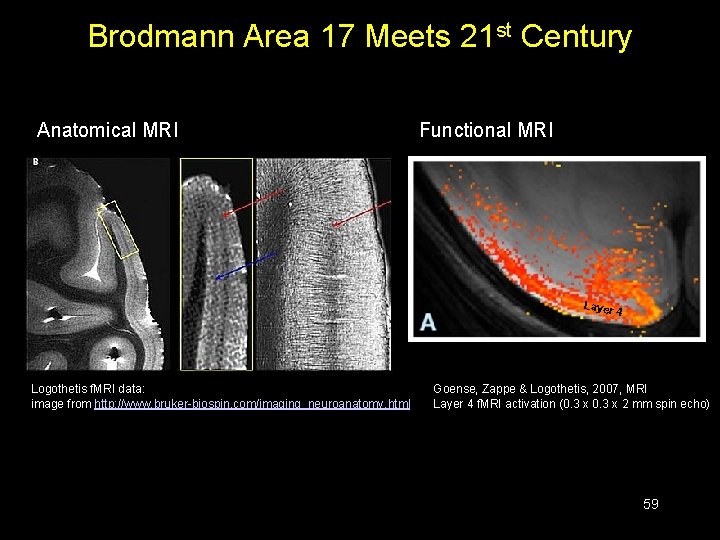
Can We Use Multiple Criteria in Human Imaging? 1. Function – this is often the only criterion in f. MRI 2. Architecture – there are now probabilistic maps of human brain areas available (Zilles lab) 3. Connectivity – DTI and functional connectivity now give us options here 4. Topography – topography is useful in imaging, especially for early and midlevel sensory areas 58
Brodmann Area 17 Meets 21 st Century Anatomical MRI Functional MRI Layer 4 Logothetis f. MRI data: image from http: //www. bruker-biospin. com/imaging_neuroanatomy. html Goense, Zappe & Logothetis, 2007, MRI Layer 4 f. MRI activation (0. 3 x 2 mm spin echo) 59
Brodmann’s Areas Brodmann (1905): Based on cytoarchitectonics: study of differences in cortical layers between areas Most common delineation of cortical areas More recent schemes subdivide Brodmann’s areas into many smaller regions Monkey and human Brodmann’s areas not necessarily homologous
Brodmann Area 17 61
Retinotopic Maps EXPANDING RINGS ROTATING WEDGES
DTI in V 1 Saentz & Fine, 2010, Neuro. Image 63
Maps, Maps … even in parietal lobe … … even in frontal lobe … Hagler & Sereno, 2006, Neuro. Image Wandell et al. , 2007, Neuron 64
Other Sensory “-topies” Touch: Somatotopy Servos et al. , 1998 red = wrist; orange = shoulder Audition: Tonotopy Sylvian fissure temporal lobe cochlea Movie: tonotopy. mpeg http: //cogsci. ucsd. edu/~sereno/downsweep 2. mpg Source: Marty Sereno’s web page
Learning Brain Anatomy Duvernoy, 1999, The Human Brain: Surface, Blood Supply, and Three-Dimensional Sectional Anatomy • beautiful pictures • good schematic diagrams • clear anatomy • slices of real brain • Springer, US$439 • DISCONTINUED Ono, 1990, Atlas of the Cerebral Sulci • great for showing intersubject variability • gives probabilities of configurations and stats on sulci • Theime, US$199 Damasio, 2005, Human Brain Anatomy in Computerized Images, 2 nd edition • good for showing sulci across wide range of slice planes • 2 nd edition much better than 1 st edition • Oxford University Press, US$100 Tamraz & Comair, 2000, Atlas of Regional Anatomy of the Brain Using MRI with Functional Correlations • good overview • Springer, US$203 Talairach & Tournoux, 1988. Co-Planar Stereotaxic Atlas of the Human Brain • just because it’s the standard doesn’t mean it’s good • Theime, US$240
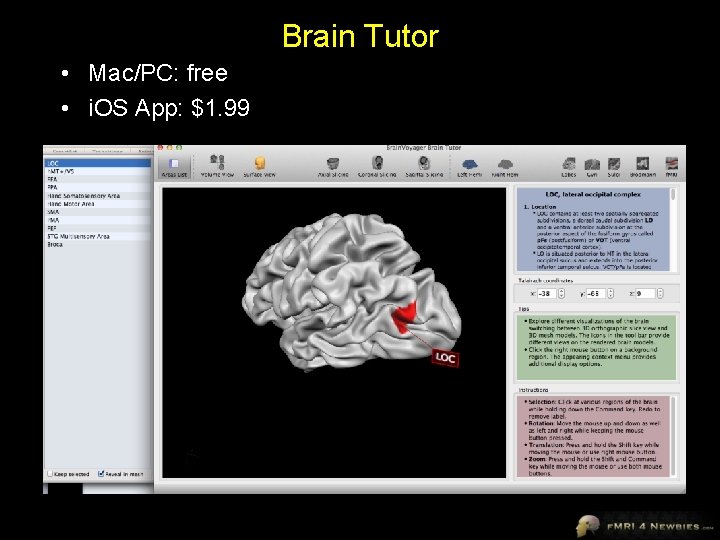
Brain Tutor • Mac/PC: free • i. OS App: $1. 99
Jody Culham Brain and Mind Institute Department of Psychology Western University http: //www. fmri 4 newbies. com/ Proposal Guidelines Last Update: November 21, 2016 Last Course: Psychology 9223, F 2016, Western University

Research Proposal Due December 12, 2016 • Goals – give students an opportunity to demonstrate what they’ve learned and apply ideas to their research area – give students practice in writing grants/papers • 16 double-spaced pages + figures • must be original – not thesis – not something your advisor totally worked out for you • can get some suggestions from advisor but core of proposal should be your work
Research Proposal • partially like a grant – proposal for experiment – make case for why experiment should be done • “hasn’t been done before” is not good enough – clear question, hypotheses – conclusion: so what? – immunization against potential criticism • partially like a paper – just one experiment, not 5 years of experiments – in-depth methods • be clear about design (e. g. , protocol) and analyses • be clear about contrasts • Appendix with budget and time line • don’t worry about formatting – spend your time on content not formatting
Range of Approaches • Standard univariate f. MRI with hypothesis-driven GLM – Block or Event-related • Advanced designs – e. g. , MVPA • Data-driven f. MRI – e. g. , ICA on resting state data • Approaches we’ve touched on in class Be aware that we won’t discuss these in too much detail in class; therefore you would need to have some prior exposure or to do some extra reading – e. g. , intersubject correlations • Anatomical approaches – DTI • For the more computationally inclined – better ways to analyze data – if you must use equations, explain them intuitively in text (and consider putting them in an appendix)
Two questions to consider whenever you write a paper or give a talk • Who is my audience? – a math-phobic professor who will be checking whether you understood the core ideas of f. MRI • What is my goal? – show professor that you can find a way to use neuroimaging in your research – show professor that you understand jargon and concepts Bonus – be clever and creative – write clearly and concisely – solidify your understanding of neuroimaging approaches – think more deeply about how to apply neuroimaging
Sections • • Introduction – Give enough information to put the research in context and lead the reader to the conclusion that the experiment you’re proposing is a reasonable next step – You don’t need to cite every paper in the history of neuroimaging – Do enough of a lit search to be fairly certain proposal hasn’t been done – Replication attempts discouraged (but may be considered with sufficient justification) Methods – Include enough detail to demonstrate that you understand jargon and key concepts – Be clear about specific contrasts Results – How could it turn out? – May want to include graph of hypotheses Conclusions – Don’t just summarize; conclude! So what? ! – What would it mean if the results turned out one way or another? Are there any caveats that should be acknowledged? What is the broader significance of the research? References – whatever format you like (e. g. , APA) – don’t go overboard Figures (optional) Appendix – How much will it cost? – How long will it take?
Key Methods • • • # participants (pilot + discarded + final) Design (block, event-related) Timing of TR, trials, blocks, jittering, runs, session Stimulus/task conditions + rationale Preprocessing steps – include criterion for motion correction • Approach (localizer? ; ROI and/or voxelwise; individual and/or group; for event-related convolution or deconvolution) • Contrasts – don’t just say “activation for faces” or “activation for faces vs houses, bodies & scrambled” – define specific contrast: e. g. , “a conjunction of faces vs. each control category [(F>H)AND(F>B)AND(F>S)] – corrections (esp. multiple comparisons)
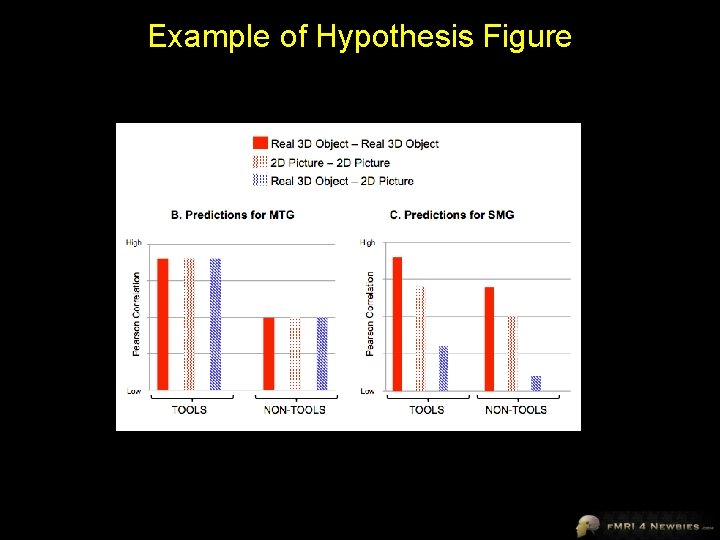
Example of Hypothesis Figure
- Slides: 75