Java Script Performance When Java Script was first

- Slides: 12

Java. Script Performance When Java. Script was first introduced as part of Netscape Navigator in 1996, performance wasn’t that important. Java. Script’s original goal was to improve the user experience of web pages. Instead of going back to the server for simple tasks such as form validation, Java. Script allowed embedding of this functionality directly in the page. What previously was used to save server roundtrips started to become more ubiquitous. Where there were once dozens of lines of Java. Script code were now hundreds, and eventually thousands. The introduction of Internet Explorer 4 and dynamic HTML (the ability to change aspects of the page without a reload) ensured that the amount of Java. Script on pages would only increase over time. The last major step in the evolution of browsers was the introduction of the Document Object Model (DOM), a unified approach to dynamic HTML and standardization of Java. Script into ECMA-262, third edition. With all browsers supporting the DOM and (more or less) the same version of Java. Script, a web application platform was born.

Java. Script Performance The Java. Script engines that supported web pages with a few dozen lines of Java. Script in 1996 are the same ones running web applications with thousands of lines of Java-Script today. So In reality, older browser hadn’t gotten any slower; it was just being asked to do more than it had previously. Java. Script forces the developer to perform the optimizations that a compiler would normally handle in other languages. The newer Java. Script engines, optimizations are being done at the compilerlevel, where they should be done, there are still aspects of Java-Script that these new engines don’t handle. Delays caused by network latency and operations affecting the appearance of the page areas that have yet to be adequately optimized by browsers. While simple optimizations such as function inlining, code folding, and string concatenation algorithms are easily optimized in compilers, the dynamic and multifaceted structure of web applications means that these optimizations solve only part of the performance problem. A large source of performance problems in Java. Script is poorly written code that uses inefficient algorithms or utilities

Java. Script Performance Test Tools and Techniques We know many ways to create Java. Script that is correct, but what about making it efficient, lets' look at the ways to optimize script performance. The right software is essential for identifying bottlenecks in both the loading and running of scripts, some of the free tools available for : Profiling Timing various functions and operations during script execution to identify areas for optimization. When a particular script or application is performing less than optimally, a profiler can help prioritize areas for optimization. This can get tricky because of the range of supported browsers, but many vendors now provide a profiler along with their debugging tools. In some cases, performance issues may be specific to a particular browser; other times, the symptoms may occur across multiple browsers. Keep in mind that the optimizations applied to one browser might benefit other browsers, but they might have the opposite effect as well.

Profiling Java. Script– Google Chrome The Profiles panel lets you profile the execution time and memory usage of a web app or page. The Profiles panel includes two profilers: a CPU profiler and a Heap profiler. These help you to understand where resources are being spent, and so help you to optimize your code q. The CPU profiler shows where execution time is spent in your page's Java. Script functions. q. The Heap profiler shows memory distribution by your page's Java. Script objects and related DOM nodes. q. The CSS Selector Profiler records the aggregate time spent matching selectors to elements in the DOM tree. This time is also captured within "Style Recalculation" Timeline events. TO explore more please visit the below link: https: //developers. google. com/chrome-developer-tools/

Profiling Java. Script– IE 9 The F 12 Tools’ Profiler tab lets you analyze the execution of Java. Script, showing which functions (whether custom or built-in) are being called and where time is spent. Click on “Start profiling”, load a page and/or use page functionality, and click “Stop profiling” When the session is stopped a report of the instrumented script is shown, including the following by default: q. Function name q. Count of times called q. Inclusive time (ms) – Time in the function plus any functions it calls q. Exclusive time (ms) – Time in the function only q. URL (of file containing the function) q. Line number

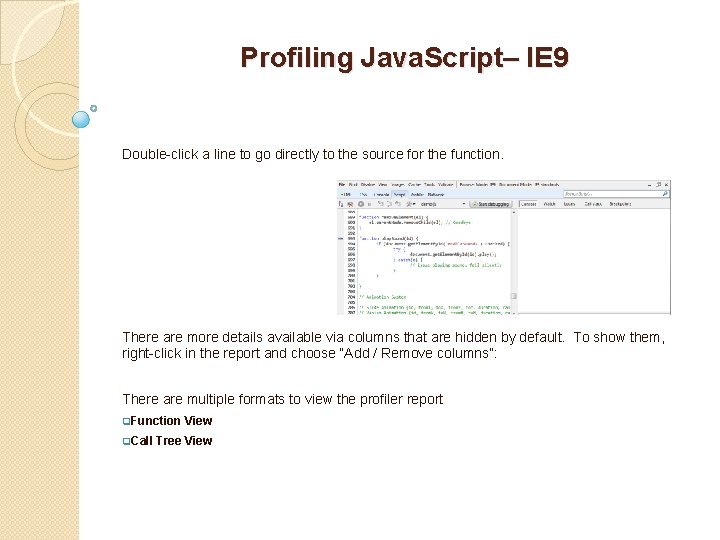
Profiling Java. Script– IE 9 Double-click a line to go directly to the source for the function. There are more details available via columns that are hidden by default. To show them, right-click in the report and choose “Add / Remove columns”: There are multiple formats to view the profiler report q. Function View q. Call Tree View

Profiling Java. Script– Mozilla Firefox We can use the Profiler tool to find bottlenecks in your Java. Script code. In Firefox launch the Profiler by selecting "Profiler" from the "Web Developer" menu. TO explore more please visit the below link: https: //developer. mozilla. org/en-US/docs/Tools/Profiler

Java. Script Performance Test Tools and Techniques Network analysis Examining the loading of images, stylesheets, and scripts and their effect on overall page load and rendering. Network analyzers can be highly effective in helping to ensure that scripts and pages are loading and running as quickly as possible. Before diving into tweaking code, you should be sure that all scripts and other assets are being loaded optimally. Image and stylesheet loading can affect the loading of scripts, depending on how many concurrent requests the browser allows and how many assets are being loaded.

Java. Script Performance Test Tools and Techniques Java. Script Profiling The tool that comes with all Java. Script implementations is the language itself. Using the Date object, a measurement can be taken at any given point in a script. Before other tools existed, this was a common way to time script execution, and it is still occasionally useful. By default the Date object returns the current time, and subtracting one Date instance from another gives the elapsed time in milliseconds. We also have Java. Script Profiling API , The goal of the profiling API is to allow javascript access to profiling information and enable building tools on top of it to display the information in a readable and useful fashion. It should also be flexible and generalized to support different forms of profiling and even custom profiling techniques. Reference https: //wiki. mozilla. org/index. php? title=Javascript_Profiling& diff=446844& oldid=prev

Java. Script Performance Test Tools and Techniques YUI Profiler The YUI Profiler (http: //developer. yahoo. com/yui/profiler/), contributed by Nicholas Zakas, is a Java. Script profiler written in Java. Script. In addition to timer functionality, it provides interfaces for profiling functions, objects, and constructors, as well as detailed reports of the profile data. It enables profiling across various browsers and data exporting for more robust reporting and analysis. Page Speed is a tool initially developed for internal use at Google and later released as a Firebug addon that, like Firebug’s Net panel, provides information about the resources being loaded on a web page. However, in addition to load time and HTTP status, it shows the amount of time spent parsing and executing Java. Script, identifies deferrable scripts, and reports on functions that aren’t being used. This is valuable information that can help identify areas for further investigation, optimization, and possible refactoring.

Java. Script Performance Test Tools and Techniques dyna. Trace Ajax Edition The developers of dyna. Trace, a robust Java/. NET performance diagnostic tool, have released an “Ajax Edition” that measures Internet Explorer performance (a Firefox version is coming soon). This free tool provides an end-to-end performance analysis, from network and page rendering to runtime scripts and CPU usage. The reports display all aspects together, so you can easily find where any bottlenecks may be occurring.

Performance Optimization Tips Profiler q. Find hotspots – Invest time where there’s the largest potential benefit. Profile, then sort on exclusive time to get a quick view. q. High function counts – Having many calls to a function isn’t necessarily a problem, but it’s a good place to start looking. q. Repeated calls – Calling a function with the same arguments repeatedly? Recomputing values frequently? They may be a good candidates for caching and/or precomputing common requests (server- or client-side). Coding Approch q. Use realistic data – Some issues only manifest themselves in production scenarios. Test with realistic data and conditions… before your users do (e. g. testing that document processor using “Hello world!” might not be enough. ) q. Cached Functions in the Module Pattern : Caching your functions when using the module pattern can lead to performance improvements. Reference : http: //coding. smashingmagazine. com/2012/11/05/writing-fast-memory-efficient-javascript/ http: //jonraasch. com/blog/10 -javascript-performance-boosting-tips-from-nicholas-zakas http: //blog. monitis. com/index. php/2011/05/15/30 -tips-to-improve-javascript-performance/