Java Debugging In Eclipse Copyright 2004 2013 Curt
Java Debugging In Eclipse Copyright © 2004 – 2013 Curt Hill
Myth and Reality • The myth says that interpreted languages make debugging very easy, while compiled languages are harder to debug • The former is true – VB and most BASICs have a good debugging engine • The latter is false – C/C++/Java all have good run-time debuggers • We now look at the facilities of Eclipse Copyright © 2004 – 2013 Curt Hill

The Debugging Facilities • Eclipse comes with full featured debugging: – Display variables – Breakpoints – Single stepping – Run to any location – Reset program – Run at full speed • All of these are available interactively at run-time Copyright © 2004 – 2013 Curt Hill
Features • Breakpoints – A line of code that will stop the program just before it is executed – Allows programmer to examine or change variable values • Variables and expressions – Allows a variable value to be displayed, while the program is running • Single step – Execute a single line of code – A whole method may be treated as a single line or entered Copyright © 2004 – 2013 Curt Hill
It is all in perspective • Recall that Eclipse has views and perspectives – A view is a single pane – A perspective is a collection of views • The debug screen is a perspective • Consider the next two screens Copyright © 2004 – 2013 Curt Hill
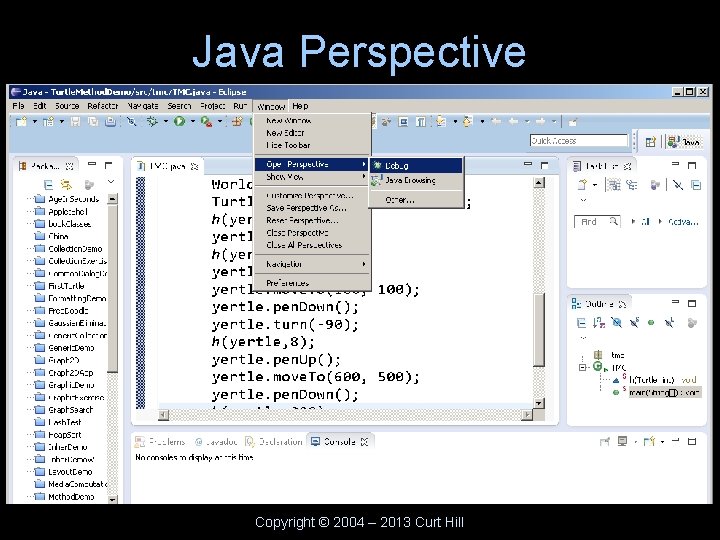
Java Perspective Copyright © 2004 – 2013 Curt Hill
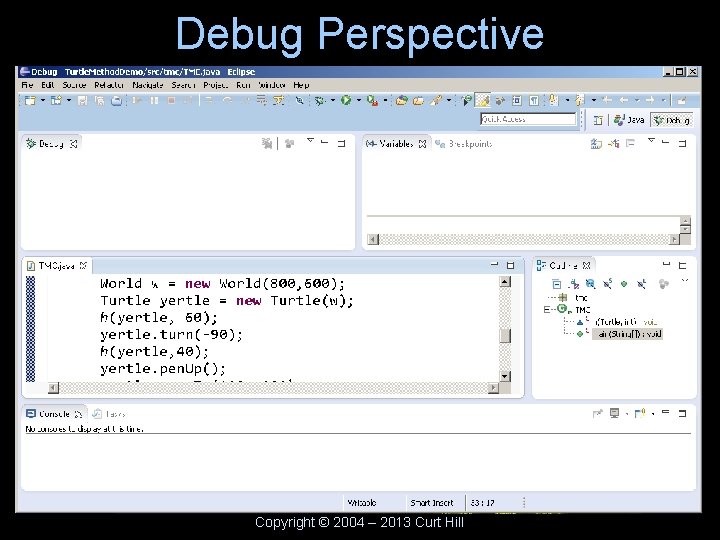
Debug Perspective Copyright © 2004 – 2013 Curt Hill
Debugging • There are two run buttons in either Java or Debug perspective • The green circle with triangle does a regular run • The bug icon does a debug run – If in Java perspective, Eclipse will ask whether you wish to change to Debug perspective upon finding a breakpoint Copyright © 2004 – 2013 Curt Hill
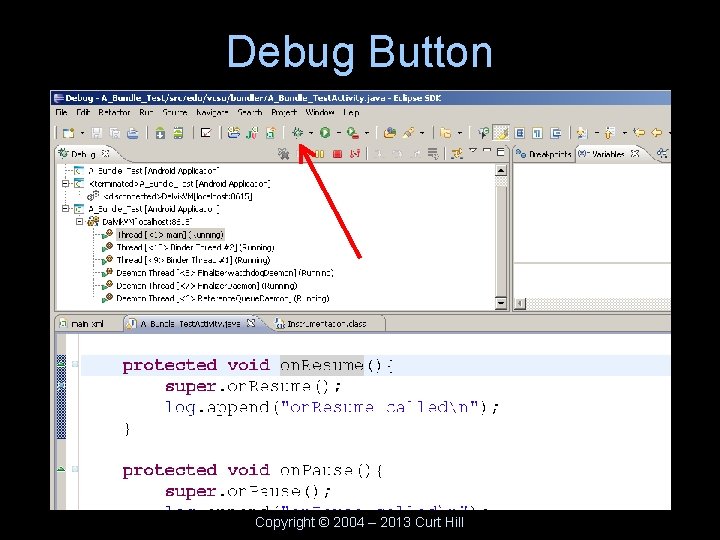
Debug Button Copyright © 2004 – 2013 Curt Hill

Breakpoints • To set a breakpoint right click on gutter of the edit pane • A drop down menu should allow setting a breakpoint • If a breakpoint was there it could be cleared as well • A breakpoint may also be cleared in the breakpoint tab • Consider the next screen Copyright © 2004 – 2013 Curt Hill
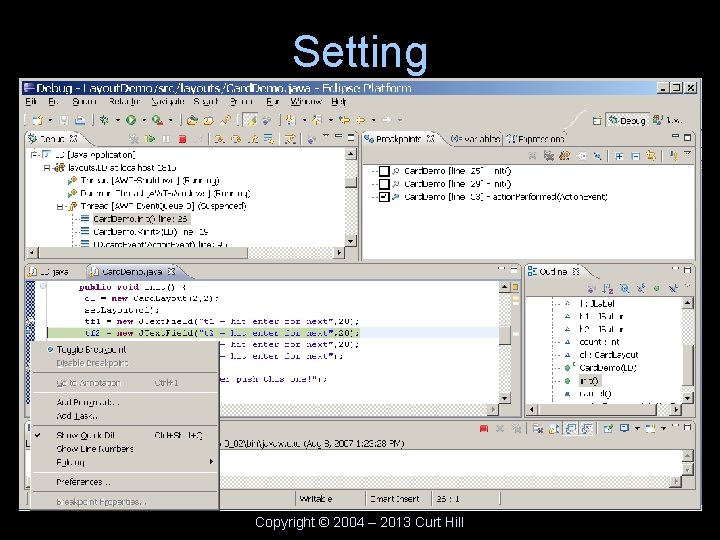
Setting Copyright © 2004 – 2013 Curt Hill
Breakpoint Found • The program will not be paused until the breakpoint is encountered • The program is paused, but the debugger is ready to do things • The upper right pane has various tabs that will show things – As does the run menu Copyright © 2004 – 2013 Curt Hill
Variables • In the upper right hand pane there should be tab for variables • It will only show the variables and parameters for this method • The universal variable for a non-static method is this • Opening it will show all the properties of the class • See next screen Copyright © 2004 – 2013 Curt Hill
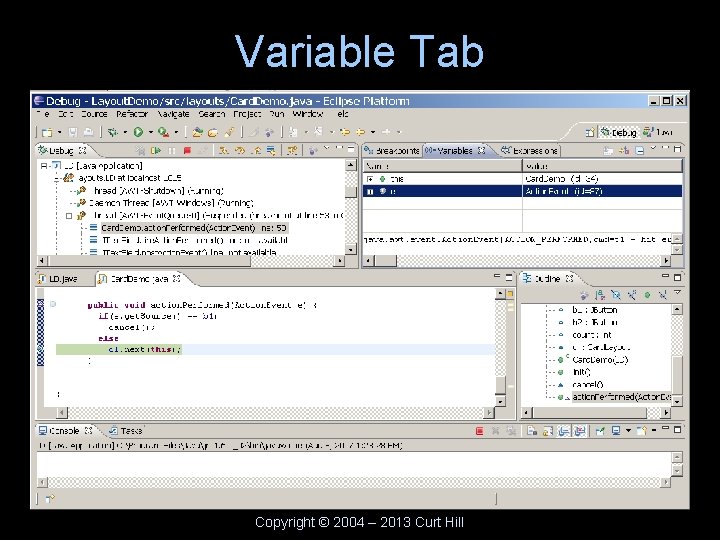
Variable Tab Copyright © 2004 – 2013 Curt Hill
Expressions • Most things that are needed may be observed with the variable tab • The expressions tab allows an expressions with variables and operators to be computed and viewed Copyright © 2004 – 2013 Curt Hill

Shortcut keys • F 6 execute one line – Treat a method call as one statement • F 5 execute one line – Enter to the first line of the method • F 8 resume execution (until next breakpoint) • F 7 will run until the end of the current method • Ctrl F 2 terminates the program – Also a button (a red square) Copyright © 2004 – 2013 Curt Hill
Lastly • This ought to be enough for now • There is plenty more to know, but we are unlikely to need it for this class • There also profiling tools – This would help find where a long running program is spending too much time Copyright © 2004 – 2013 Curt Hill
- Slides: 17