Jaroslav Cerni Institute for the Development of Water


- Slides: 22

“Jaroslav Cerni” Institute for the Development of Water Resources, Belgrade, Serbia Republic Hydrometeorological Service of Serbia GIS Presentation of Latest Results of Climate Parameter Processing in the Republic of Serbia Stevan Prohaska, Andjelka Koprivica, Vladislava Bartos Divac, Brankica Majkic-Dursun, Aleksandra Ilic, Samir Catovic, Dragan Djukic, Branislava Kapor.

All Hydrometeorological Processing Climate data are taken over the "Hydrological Basis of Serbian Water Master Plan", from: Ø 56 meteorological gauging stations Ø 437 precipitation stations and Ø 30 pluviograph rainfall stations.

The locations of the stations for observing and measuring climatological parameteres The locations of the precipitation stations

Methodology and GIS presentation of the Climatological data Processing Results in Serbia Ø The isolines maps were created using ESRI and Arc. GIS Program based on obtained results on all meteorological and gauguing stations: Mean annual air temperature Ø Apsolute minimum air temperature Ø Tsr (°C) High: 12 Low: 2

Ø Apsolute maximum air temperature Ø Annual sum of precipitation Ø Mean annual air humidity P (mm) High: 1362 Low: 524

Apsolute minimum air temperatures Apsolute maximum air temperature Tmax (°C) Tmin (°C) High: 43 High: -19 Low: 26 Low: -37

Mean annual air humidity W (%) High: 81 Low: 69

Methodology and GIS presentation of the pluviograph data Processing Results in Serbia v Research objective: To define the mathematical software for interpolation of storm’s rainfall values at any point defined by geographic coordinates (latitude and longitude), in Serbia, and to define the selected probability of occurrence for various duration of rainfall from 10 to 1440 minutes.

Introduction v Background – using the GIS techniques: positions of pluviograph and rain gauging stations were determined • each gauging and pluviograph station has its identification number - IBKS – IBPS • IBPSi IBKSij i = 1, 2, . . . . , 30 j = 1, 2, . . . . , 437 • period of observation was from the beginning of operation up to the year 2008

First step: For all pluviograph stations v • • v An extraction of series of maximum annual amount of rain for durations of τ = 10, 20, 30, 60, 120. 360, 720, 1440 minutes. Definition theoretical values of rain depth, for different duration of rain for characteristic probabilities For all regular precipitation stations: • Evaluation of theoretical values of maximum daily (24 -hour) rainfall for selected probabilities, p

Second step: 1. Definition of the reduction curves of high intensity rainfall for all 30 pluviograph stations 2. Using GIS processing (program ESRI Arc View 3. 3. ) the Thiessen's polygons were constructed on the basis of geographical locations of 30 pluviograph stations

Second step: 3. The Thiessen's polygons for the Republic of Srebia 4. For each rain gauge stations (437 stations) the heavy rains depth for different duration ware defined, as:

Second step: 5. Based on altitude and calculated values at 437 stations the vertical gradient of precipitation was defined for the entire territory of Serbia 6. Each values rain for different rainfall duration and probabilities are reduced to "0" altitude 7. For interpolation in grid points the Kriging geo-static method is adopted 8. All values in grid point at "0" above sea level, by the vertical gradient, "returned" to the altitude of the given terrain model. In this way orographic (digital model of the terrain) is inserted into a spatial distribution of shorter duration storms characteristics Using the program ESRI Arc GIS, a spatial distribution of high intensity rainfall in Serbia is given in the form of points, lines and polygons. This way, we created the isoline map of heavy rains depth for all specified duration of rain and probabilities of occurrence.

Heavy rains depth for duration 20 minutes and probability of occurrence p=1% (mm/min) Heavy rains depth for duration 360 minutes and probability of occurrence p=1% (mm/min) High: 76, 7 High: 144, 5 Low: 11, 6 Low: 26, 7

Using GIS procedure for automatic creation of high intensity rainfall in the territory of Serbia v GIS base is created in 54 layers consisting of isohyets polygons of maximum rainfall for different durations: 10, 20, 30, 60, 120, 180, 360, 720 and 1440 minutes as well as for maximum 24 hour daily amount of precipitation, and for different return periods: p = 0. 1, 1, 2, 5, 10, 20 and 50%

Reduction curves of rainfall intensity 1. Reduction curve of rainfall intensity: 2. Reduction curve of maximum mean rainfall intensity: maximum mean intensity of rainfall 3. Reduction curve of minimum rainfall intensity: minimum intensity of rainfall

Practical Application of GIS based software For the randomly chosen point, with geographical coordinates (longitude and latitude), for example mountain Kopaonik (the Pancic peak) where there are no records on short term rainfall. Click on the Calculation button and program for calculation appears. By clicking the Results-Table button, we can see table preview: q theoretical values of rain depth - Ht, p in the function of rainfall duration t and probabilities p, q theoretical values of rainfall intensity - iτp in the function of rainfall duration t and probabilities p, q reduction curves for high intensity rainfall ψτ, p, maximum mean intensity and minimum intensity q minimum intensity

Practical Application of GIS based software Computer program user’s interface

Practical Application of GIS based software For graphic presentation of the results for the intensity of rain Hτ, p in the function of rainfall duration τ and probabilities p, click on the button Results - Graphics Hτ, p Graphical presentation of analysis results Ht, p in the function of rainfall duration t and probability of occurrence p

Practical Application of GIS based software For graphic presentation of rainfall intensity iτ, p in the function of rainfall duration t and probabilities p, click on the button Results – Graphics- iτ, p Graphical presentation of results it, p in the function of rainfall duration t and probability of occurrence p

Practical Application of GIS based software For graphic presentation of high-intensity rainfall reduction curves , maximum mean intensity and minimum intensity , click on the Graphic-Reduction curve button Graphical presentation of high intensity rainfall reduction curves

FOR MORE INFO. . . stevan. prohaska@jcerni. co. rs +(381) 11 390 83 87
 Jaroslav cerni
 Water and water and water water
 Jaroslav seifert poetismus
 Jaroslav vrchota
 Jaroslav kříž pastor
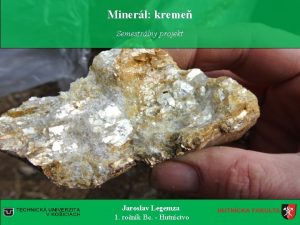
 Jaroslav legemza
 Jaroslav seifert tatínkova dýmka
 Jaroslav seifert poemas
 Rozpočítadlo petrklíč
 Kytička fialek seifert
 Jaroslav foglar prezentace
 Jaroslav zavadil
 Jaroslav duba
 Josef václav sládek lumírovci
 Judr jaroslav macek
 Jaroslav seifert prezentace
 Jaroslav duba
 Za trochu lásky šel bych světa kraj rozbor
 Jaroslav najbert
 Jaroslav macek sudca
 Jaroslav hašek prezentace
 Jaroslav foglar wikipedie
 Urban water institute
