Japanese EFV Diffusion Policy Nobutoshi Horie Deputy Director

Japanese EFV Diffusion Policy Nobutoshi Horie, Deputy Director Environment Policy Division, Road Transport Bureau, Ministry of Land, Infrastructure, Transport and Tourism Japan Ministry of Land, Infrastructure, Transport and Tourism

Today’s Topics • Fuel Efficiency standard in Japan • EFV incentive • EFV market growth and environmental effect

CO 2 Emission from transport sector in Japan CO 2 Emission from transport sector is about 20% of total emission in Japan. Road transport emits 88% of transport emission. CO 2 Emission in Japan Breakdown in Transport sector Others 150 m CO 2 ・ton 12. 5% Transport 232 m CO 2・ton 19. 5% Passenger cars 117 m CO 2・ton 50. 4% Private 172 m CO 2・ton 14. 4% Total CO 2 emission 1, 192 m CO 2・ton (2010 fiscal year) Service/Office 217 m CO 2・ton 18. 2% Industry 422 m CO 2・ton 35. 4% Freight vehicles 79 m CO 2・ton 34. 2% Break down Bus/coach 4. 3 m CO 2・ton (1. 8%) Taxi 3. 8 m CO 2・ton (1. 7%) Short sea 11 m CO 2・ton (4. 5%) Aviation 9 m CO 2・ton (4. 3%) Railway 8 m CO 2・ton (3. 3%) ※ Emission from electric generation and thermal generation are distributed to final demand sectors according to amount of consumption of each sector. ※Developed by MLIT referring to “Japanese GHG Inventory report “ 3

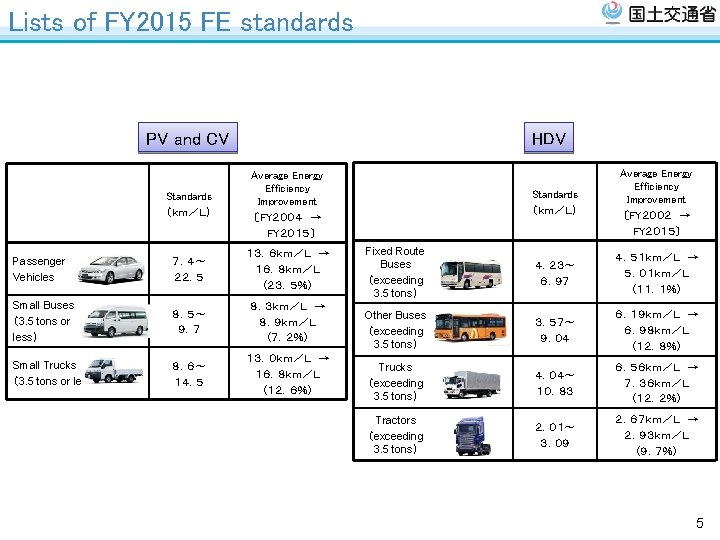
Fuel Efficiency standard ○ Based on “the Act on the Rational Use of Energy”, Japan establishes and publicizes the energy consumption efficiency standard for Passenger vehicles and commercial vehicles as well as other energy-consuming machinery and equipment. ○ Japanese Fuel efficiency standards are established by the “Top Runner Program. ” ○ The Act on the Rational Use of Energy imposed on manufactures and importers of Type Approved Vehicles. 【Scope】 Riding Capacity Gross Vehicle Weight 10 or fewer PV CV 11 or more 3. 5 tons or less Fuel Gasoline Diesel LP Gas ○ ○ ○ exceeding 3. 5 tons or less exceeding 3. 5 tons other ○ ○ ※Manufactures or importers whose total shipment volume is fewer than 2, 000 vehicles are exempted. 4

FY 2020 FE standard for PV ○ On Oct 2011, the Joint committee under MLIT and METI concluded the new standard toward FY 2020 for Passenger Vehicles. ○ FY 2020 Standard will require the automotive manufacturers to improve fuel efficiency at the highest level in the world. 30 25 Fuel Efficiency(km/L) FY 2015 standard FY 2020 standard 20 15 10 5 0 500 700 900 1100 1300 1500 1700 Vehicle Weight (kg) 1900 2100 2300 2500 6

Driving Mode ○ “JC 08 mode” are used in FY 2020 standard, as is the case in FY 2015 standard. CVS equipment for Diesel blower intake Chassis dynamometer Emission analyze equipment for Diesel dilution tunnel Emission analyze equipment for Gasoline CVS equipment for Gasoline Velocity (km/h) JC 08 mode = 1 0. 75 0. 25 + Cold start FE Hot start FE JC 08 Mode 7 Time (s)

Cooperative Average Fuel Efficiency Standard • • • Recently, technologies for improving fuel efficiency have been diversified, and those developing costs are increasing. In this context, it is difficult for manufacturers to achieve fuel efficiency target in all weight categories in weight category based standard, because manufacturers cannot focus and have to diversify their developing resources. CAFE (Cooperate Average Fuel Efficiency) standard is introduced, like US and EU. Each manufacturer is expected to focuses on developing their home ground techniques in each manufacturer, and technologies will be more sophisticated and diversified, in CAFE standard. Weight Category based Standard FE, km/L Cooperative Average Fuel Efficiency Standard FE, km/L Sales volume in Each weight category Good CAFE value = Sales volume in Each weight category Average FE in Each weight category ≧ Bad ○/× OK/NG Target value Curb weight, kg NG OK OK → Not accomplished because there are some weight categories which cannot be accomplished CAFE standard = Bad ○/× OK/NG Sales volume in Each weight category Target Values in Each weight category Target value Curb weight, kg OK → Accomplished in CAFE standard 8

Electric Vehicles / Plug-in Hybrid Electric Vehicles • • The number of EV and PHEV models is too small, and we don’t have enough information to make appropriate target values. So, we exclude EV and PHEV from the target scope of the new standard. Manufacturers can add EV and PHV by converting its electric efficiency to fuel efficiency, in case they meet the minimum requisite. Mitsubishi i-Mi. EV Nissan Leaf Toyota Prius Plug-in Hybrid Cruising distance 180 km 200 km 26. 4 km * Electric efficiency 9. 09 km/k. Wh 8. 06 km/k. Wh 8. 74 km/k. Wh Electric energy (3. 6 MJ/k. Wh), Gasoline energy (32. 9 MJ/L) Converted FE km/L = Electric efficiency ÷ 3. 6 MJ/k. Wh × 32. 9 MJ/L Converted FE 83. 1 km/L 73. 7 km/L Requisite condition: CAFE value ≥ CAFE standard × 0. 9 44. 6 km/L(combined) * Electric drive distance Source:Manufacturer's HP To improve conventional vehicles’ fuel efficiency in the same manner 9

Today’s Topics • Regulations in Japan • EFV incentive • EFV market growth and environmental effect

The tax reduction for Eco-Cars ○ The tax reduction for Eco-Cars, in vehicle weight tax and vehicle acquisition tax. ○ It was introduced to stimulate of auto sales and promote Eco-Cars. The target of requirement Fuel efficiency Emission The 2010 fuel efficiency Standard The 2005 emission standard Rate of tax reduction (Acquisition Tax and Weight Tax) Electric vehicles,Plug-in hybrid vehicles,Natural gas vehicles, Diesel passenger vehicles. Hybrid vehicles Gasoline Vehicles Exemption Surpass the 2010 FE standard by 25% Surpass the 2010 FE standard by 15% Surpass the 2005 emission standard by 75% (☆☆☆☆) 75%-reduction 50%-reduction

The tax reduction for Eco-Cars The Benefit for Consumers Rate of tax reduction Hybrid Vehicle Exemption 75%-reduction Gasoline Vehicle 50%-reduction Tax Name Price of tax reduction Automobile Acquisition Tax 90, 000 Automobile Weight Tax 56, 700 Total Reduction 146, 700 Automobile Acquisition Tax 67, 500 Automobile Weight Tax 42, 600 Total Reduction 110, 100 Automobile Acquisition Tax 45, 000 Automobile Weight Tax 28, 400 Total Reduction 73, 400 ※The case of the price 1, 800, 000, less than 1. 5 ton weight , less than engine capacity 1, 500 cc vehicle.

Today’s Topics • Regulations in Japan • EFV incentive • EFV market growth and environmental effect

New EFVs introduction ○After eco-cars tax reduction introduction, technology development is accelerating And New EFVs are introduced to Japanese market. ・ Hybrid vehicles are introduced several segments and there are model variations. ・ Zero Emission vehicle like electric and the plug-in hybrid are come up. ・ Some Internal combustion engine vehicle has equal to the mileage performance of the hybrid. か か Major EFV introduction to Japanese Market 2009 2010 2011 Feb:Insight(Honda) 31. 0 km/L(+93. 8% than Reg. ) May:New Prius(Toyota) 38. 0 km/L (+192. 3% than Reg. ) Hybrid Vehicle Dec:SAI(Toyota) 24. 0 km/L (+128. 6% than Reg. ) Feb: CR-Z (Honda) (25. 0 km/L (+56. 3% than Reg. ) Nov:Fuga HV(Nissan) 19. 0 km/L (+113. 5% than Reg. ) Jun:i-Mi. EV(Mitsubishi) Electric Vehicle Dec:Leaf(Nissan) 2012年PHEV (Toyota) Internal combustion Vehicle Jul. :Demio Sky Active(Mazda) 30. 0 km/L (+67. 5% than Reg. ) ※ 10・ 15 mode ※Reg. ; 2010 Fuel consumption regulation Nov:Mira Ys(Dayhatsu) 32. 0 km/L (+70. 2% than Reg. )

Market shear of Eco-cars: passenger vehicle ○ Just after eco-car reduction of taxes introduction, the eco-car sales ratio rises rapidly. (Apr. 2009: 42. 5%→ 2010 Mar. 73. 6%) ○ Demand shifts to a more fuel-efficient (a reduction of taxes rate is high) car afterwards. 27. 4% 31. 7% 26. 2% 24. 0% 19. 0% 57. 5% 14. 6% 13. 3% 17. 0% 21. 8% 30. 0% 25. 4% 24. 3% 53. 0% 49. 4% 19. 1% 37. 1% 32. 2% 30. 6% 12. 0% 12. 5% Apr. 2010 Oct. 47. 9% 17. 8% 5. 7% Apr. 2009 Feb. 2012 Oct Exemption 75% Reduction 50% Reduction 14. 5% 6. 4% Apr. 2011 Others Oct. 19. 2%

Market share of Eco-cars: Truck/Bus ○After eco-car reduction of taxes introduction, better spec vehicle(75% off) development accelerates. 120% 28. 6% 100% 37. 2% 33. 5% 37. 5% 46. 2% 50. 7% 80% 65. 7% 2. 9% 2. 4% 41. 3% 60% 45. 5% 40% 61. 4% 51. 9% 46. 6% 20% 33. 8% 58. 7% 29. 0% 14. 3% 0% 0. 5% 4月 Apr. 2009 Feb. 2012 2. 7% 10月 Oct 1. 8% 3. 0% 1. 2% 2. 2% 1. 3% 4月 10月 2月 Apr. 2010 免税対象車 Exemption 75%減税対象車 75% Reduction Oct. 50%減税対象車 50% Reduction Apr. 2011 減税対象外車 Others Oct.

Fuel efficiency Improvement Trend ○ Average FE of PV in Japan has been improving steadily due to manufactures’ activities and policy measures such as a tax reduction scheme for Eco-Cars. 8% Increase 17

CO 2 emission in Transport sector Emissions from passenger transport on road peaked in FY 2001. Since FY 2001, emissions from the transportation sector have been on a downward trend. Improvement of mileage of passenger vehicles - Fuel Efficiency regulation - Green Tax (Since FY 2001) 18. 2 mil. /57. 7 mil. registered vehicles are GREEN FY 2010 Target Carbon dioxide emission (million t-CO 2) 300 263 % +21. 0 250 +1. 6% 267 -11. 6% 240 217 200 150 100 Passenger vehicles Other modes of transport 232 . 4% +36 +12. 0% +10. 8% 50 Freight vehicles % +12. 7 -10. 4 -2. 4% -13. 8 -8. 9% % % -16. 9 % Efficiency improvement of freight road transport - Deployment of largersize trucks: 24 -25 t truck: 80, 000(FY 02) ⇢ 160, 000(FY 08) - Shift of cargo from in-house distribution to freight carriers: freight carriers/total: 77. 2% (FY 97) ⇢ 87. 4% (FY 08) 0 1991 1992 1993 1994 1995 1996 1997 1998 1999 2000 2001 2002 2003 2004 2005 2006 2007 2008 2009 2010 Emissions from freight transport on road peaked out in FY 1996 18

Target of sales share of Next Gen. EFVs ○ After Eco-cars Tax Reduction introduction, Sales Share of Next Gen. EFVs is jumping up: 3%⇒ 14% ○ However, Stock share of Next Gen, EFVs is still around 2% Stock share of Next Gen. EFVs Sales share of Next Gen. EFVs (Passenger vehicle) 30% 50% 25% 50% 4. 5% 4. 0% 3. 5% 20% App. 11 points UP 15% 10% 3. 0% 14. 2% 11. 0% 2. 5% Aim to achieve 50% By 2020 1. 9% 2. 0% 1. 5% 1. 3% 1. 0% 5% 0% 0. 5% 2. 2% 3. 0% 1 Half 2 Half 1 Half 1 FY 2007 FY 2008 FY 2009 FY 2010 FY 2011 0. 0% FY 2020 Next Gen. EFVs: Hybrid , Electric plug-in Hybrid Fuel cell, Clean Diesel, CNG 0. 4% 0. 5% 0. 6% 0. 8% 1 2 3 4 FY 2005 FY 2006 FY 2007 FY 2008 5 6 FY 2009 FY 2010
- Slides: 19